")


TikZ contains a graph layout library, which works surprisingly well for making Feynman diagrams. Here are a couple of examples. The syntax could be shortened (f instead of fermion, for example), this is just to show the idea:

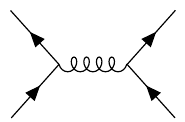
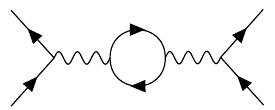
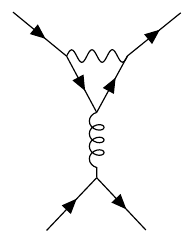
There are some issues with decorating curved paths using waves, and the coils decoration sometimes ends with a straight path segment, but that could be fixed. Here’s the complete code (requires lualatex).
%!TEX lualatex
\documentclass[a4paper,12pt, border=5mm]{standalone}
\usepackage{tikz}
\usetikzlibrary{decorations, decorations.markings, decorations.pathmorphing, arrows, graphs, graphdrawing, shapes.geometric, snakes}
\usegdlibrary{trees,force, layered}

\pgfdeclaredecoration{complete sines}{initial}
{
    \state{initial}[
        width=+0pt,
        next state=sine,
        persistent precomputation={\pgfmathsetmacro\matchinglength{
            \pgfdecoratedinputsegmentlength / int(\pgfdecoratedinputsegmentlength/\pgfdecorationsegmentlength)}
            \setlength{\pgfdecorationsegmentlength}{\matchinglength pt}
        }] {}
    \state{sine}[width=\pgfdecorationsegmentlength]{
        \pgfpathsine{\pgfpoint{0.25\pgfdecorationsegmentlength}{0.5\pgfdecorationsegmentamplitude}}
        \pgfpathcosine{\pgfpoint{0.25\pgfdecorationsegmentlength}{-0.5\pgfdecorationsegmentamplitude}}
        \pgfpathsine{\pgfpoint{0.25\pgfdecorationsegmentlength}{-0.5\pgfdecorationsegmentamplitude}}
        \pgfpathcosine{\pgfpoint{0.25\pgfdecorationsegmentlength}{0.5\pgfdecorationsegmentamplitude}}
}
    \state{final}{}
}

\tikzset{
    photon/.style={
        decoration={complete sines, amplitude=0.15cm, segment length=0.2cm},
        decorate
    },
    fermion/.style={
        decoration={
            markings,
            mark=at position 0.5 with {\node[transform shape, xshift=-0.5mm, fill=black, inner sep=1pt, draw, isosceles triangle]{};}
        },
        postaction=decorate
    },
    gluon/.style={
        decoration={coil, aspect=0.75, mirror, segment length=1.5mm},
        decorate
    },
    left/.style={
        bend left=90,
        looseness=1.75
    }
}

\begin{document}%
\begin{tikzpicture}
\graph [spring layout, nodes=coordinate, horizontal'=c to d]
{
c -- [fermion] a,
b --[fermion] c -- [photon] d,
e -- [fermion] d -- [fermion] f;
};

\graph [spring layout, anchor at={(0,-2)}, nodes=coordinate, horizontal'=c to d]
{
c -- [fermion] a,
b --[fermion] c -- [gluon] d,
e -- [fermion] d -- [fermion] f;
};

\graph [spring layout, anchor at={(0,-4)}, nodes=coordinate, horizontal'= b to d]
{
a -- [fermion] b -- [fermion] c,
b -- [photon] d -- [left, fermion] e -- [left, fermion] d,
e -- [photon] f -- [fermion] g,
h -- [fermion] f;
};

\graph [spring layout, anchor at={(0,-5)}, nodes=coordinate, vertical= e to f]
{
a -- [fermion] b -- [photon] c -- [fermion] d,
b -- [fermion] e -- [fermion] c,
e -- [gluon]  f,
h -- [fermion] f -- [fermion] i
};
\end{tikzpicture}
\end{document}