Edit and compile if you like:
\documentclass{article}
\usepackage{tikz}
\usepackage{tikz-3dplot}
\usepackage[active,tightpage]{preview}
\PreviewEnvironment{tikzpicture}
\setlength\PreviewBorder{0.125pt}
%
% File name: deltoidal-icositetrahedron.tex
% Description:
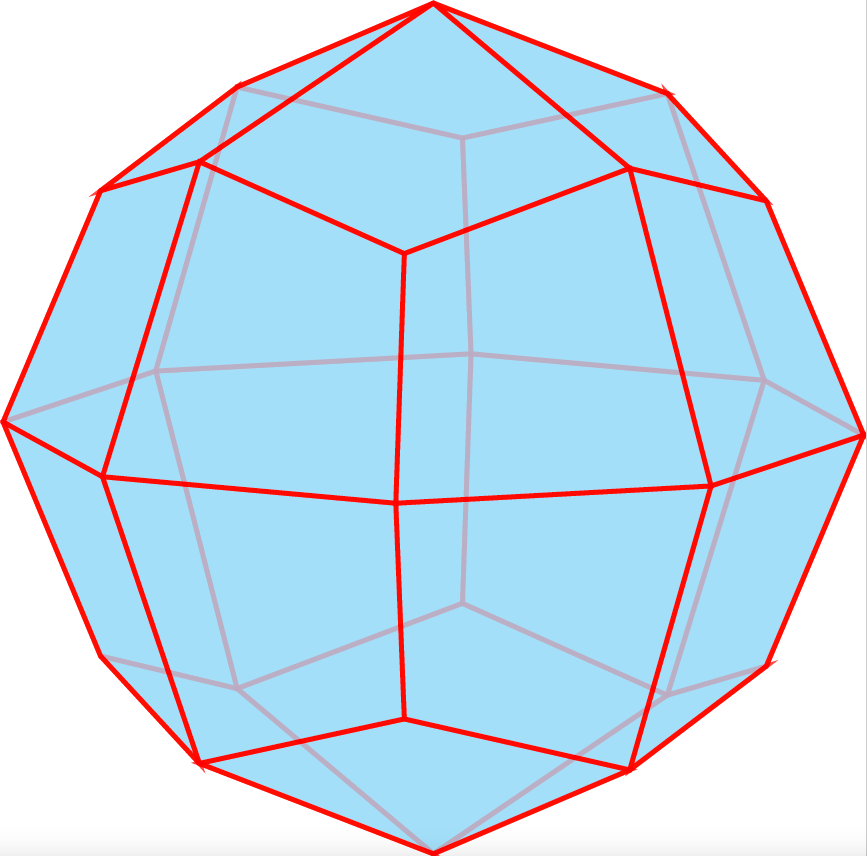
% A geometric representation of a deltoidal icositetrahedron is shown.
%
% Date of creation: May, 18th, 2021.
% Date of last modification: October, 9th, 2022.
% Author: Efraín Soto Apolinar.
% https://www.aprendematematicas.org.mx/author/efrain-soto-apolinar/instructing-courses/
% Source: page 234 of the
% Glosario Ilustrado de Matem\'aticas Escolares.
% https://tinyurl.com/5udm2ufy
%
% Terms of use:
% According to TikZ.net
% https://creativecommons.org/licenses/by-nc-sa/4.0/
% Your commitment to the terms of use is greatly appreciated.
%
\begin{document}
\tdplotsetmaincoords{80}{140}
%
\begin{tikzpicture}[tdplot_main_coords]
	% Change the value of the number at {\escala}{##} to scale the figure up or down
	\pgfmathsetmacro{\escala}{1.5}
	% Coordinates of the vertices
	\coordinate(1) at (-\escala*1.19448, \escala* -1.19448, \escala* 0.);
	\coordinate(2) at (-\escala*1.19448, \escala* 0., \escala* -1.19448);
	\coordinate(3) at (-\escala*1.19448, \escala* 0., \escala* 1.19448);
	\coordinate(4) at (-\escala*1.19448, \escala* 1.19448, \escala* 0.);
	\coordinate(5) at (\escala*0., \escala* -1.19448, \escala* -1.19448);
	\coordinate(6) at (\escala*0., \escala* -1.19448, \escala* 1.19448);
	\coordinate(7) at (\escala*0., \escala* 0., \escala* -1.68925);
	\coordinate(8) at (\escala*0., \escala* 0., \escala* 1.68925);
	\coordinate(9) at (\escala*0., \escala* 1.19448, \escala* -1.19448);
	\coordinate(10) at (\escala*0., \escala* 1.19448, \escala* 1.19448);
	%
	\coordinate(11) at (\escala*0., \escala* -1.68925, \escala* 0.);
	\coordinate(12) at (\escala*0., \escala* 1.68925, \escala* 0.);
	\coordinate(13) at (\escala*1.19448, \escala* -1.19448, \escala* 0.);
	\coordinate(14) at (\escala*1.19448, \escala* 0., \escala* -1.19448);
	\coordinate(15) at (\escala*1.19448, \escala* 0., \escala* 1.19448);
	\coordinate(16) at (\escala*1.19448, \escala* 1.19448, \escala* 0.);
	\coordinate(17) at (-\escala*1.68925, \escala* 0., \escala* 0.);
	\coordinate(18) at (\escala*1.68925, \escala* 0., \escala* 0.);
	\coordinate(19) at (\escala*0.92388, \escala* 0.92388, \escala* 0.92388);
	\coordinate(20) at (\escala*0.92388, \escala* 0.92388, \escala* -0.92388);
	%
	\coordinate(21) at (\escala*0.92388, \escala* -0.92388, \escala* 0.92388);
	\coordinate(22) at (\escala*0.92388, \escala* -0.92388, \escala* -0.92388);
	\coordinate(23) at (-\escala*0.92388, \escala* 0.92388, \escala* 0.92388);
	\coordinate(24) at (-\escala*0.92388, \escala* 0.92388, \escala* -0.92388);
	\coordinate(25) at (-\escala*0.92388, \escala* -0.92388, \escala* 0.92388);
	\coordinate(26) at (-\escala*0.92388, \escala* -0.92388, \escala* -0.92388);
	% Faces of the polyhedron
	\draw[red,thick,fill=cyan!35,opacity=0.75]  (1) -- (26) -- (5) -- (11) -- (1);
	\draw[red,thick,fill=cyan!35,opacity=0.75]  (26) -- (2) -- (7) -- (5) -- (26);
	\draw[red,thick,fill=cyan!35,opacity=0.75]  (1) -- (17) -- (2) -- (26) -- (1);
	\draw[red,thick,fill=cyan!35,opacity=0.75]  (2) -- (17) -- (4) -- (24) -- (2);
	%
	\draw[red,thick,fill=cyan!35,opacity=0.75]  (13) -- (21) -- (6) -- (11) -- (13);
	\draw[red,thick,fill=cyan!35,opacity=0.75]  (6) -- (8) -- (3) -- (25) -- (6);
	\draw[red,thick,fill=cyan!35,opacity=0.75]  (11) -- (6) -- (25) -- (1) -- (11);
	\draw[red,thick,fill=cyan!35,opacity=0.75]  (2) -- (24) -- (9) -- (7) -- (2);
	\draw[red,thick,fill=cyan!35,opacity=0.75]  (11) -- (5) -- (22) -- (13) -- (11);
	\draw[red,thick,fill=cyan!35,opacity=0.75]  (25) -- (3) -- (17) -- (1) -- (25);
	\draw[red,thick,fill=cyan!35,opacity=0.75]  (23) -- (4) -- (17) -- (3) -- (23);
	%
	\draw[red,thick,fill=cyan!35,opacity=0.75]  (24) -- (4) -- (12) -- (9) -- (24);
	\draw[red,thick,fill=cyan!35,opacity=0.75]  (22) -- (5) -- (7) -- (14) -- (22);
	\draw[red,thick,fill=cyan!35,opacity=0.75]  (7) -- (9) -- (20) -- (14) -- (7);
	\draw[red,thick,fill=cyan!35,opacity=0.75]  (20) -- (9) -- (12) -- (16) -- (20);
	%
	\draw[red,thick,fill=cyan!35,opacity=0.75]  (8) -- (10) -- (23) -- (3) -- (8);
	\draw[red,thick,fill=cyan!35,opacity=0.75]  (10) -- (12) -- (4) -- (23) -- (10);
	\draw[red,thick,fill=cyan!35,opacity=0.75]  (15) -- (8) -- (6) -- (21) -- (15);
	\draw[red,thick,fill=cyan!35,opacity=0.75]  (15) -- (19) -- (10) -- (8) -- (15);
	\draw[red,thick,fill=cyan!35,opacity=0.75]  (16) -- (12) -- (10) -- (19) -- (16);
	\draw[red,thick,fill=cyan!35,opacity=0.75]  (13) -- (22) -- (14) -- (18) -- (13);
	\draw[red,thick,fill=cyan!35,opacity=0.75]  (18) -- (15) -- (21) -- (13) -- (18);
	\draw[red,thick,fill=cyan!35,opacity=0.75]  (14) -- (20) -- (16) -- (18) -- (14);
	\draw[red,thick,fill=cyan!35,opacity=0.75]  (18) -- (16) -- (19) -- (15) -- (18);
	%
	\end{tikzpicture}
	%
\end{document}
Click to download: deltoidal-icositetrahedron.tex • deltoidal-icositetrahedron.pdf
Open in Overleaf: deltoidal-icositetrahedron.tex
See more on the author page of Efraín Soto Apolinar.


