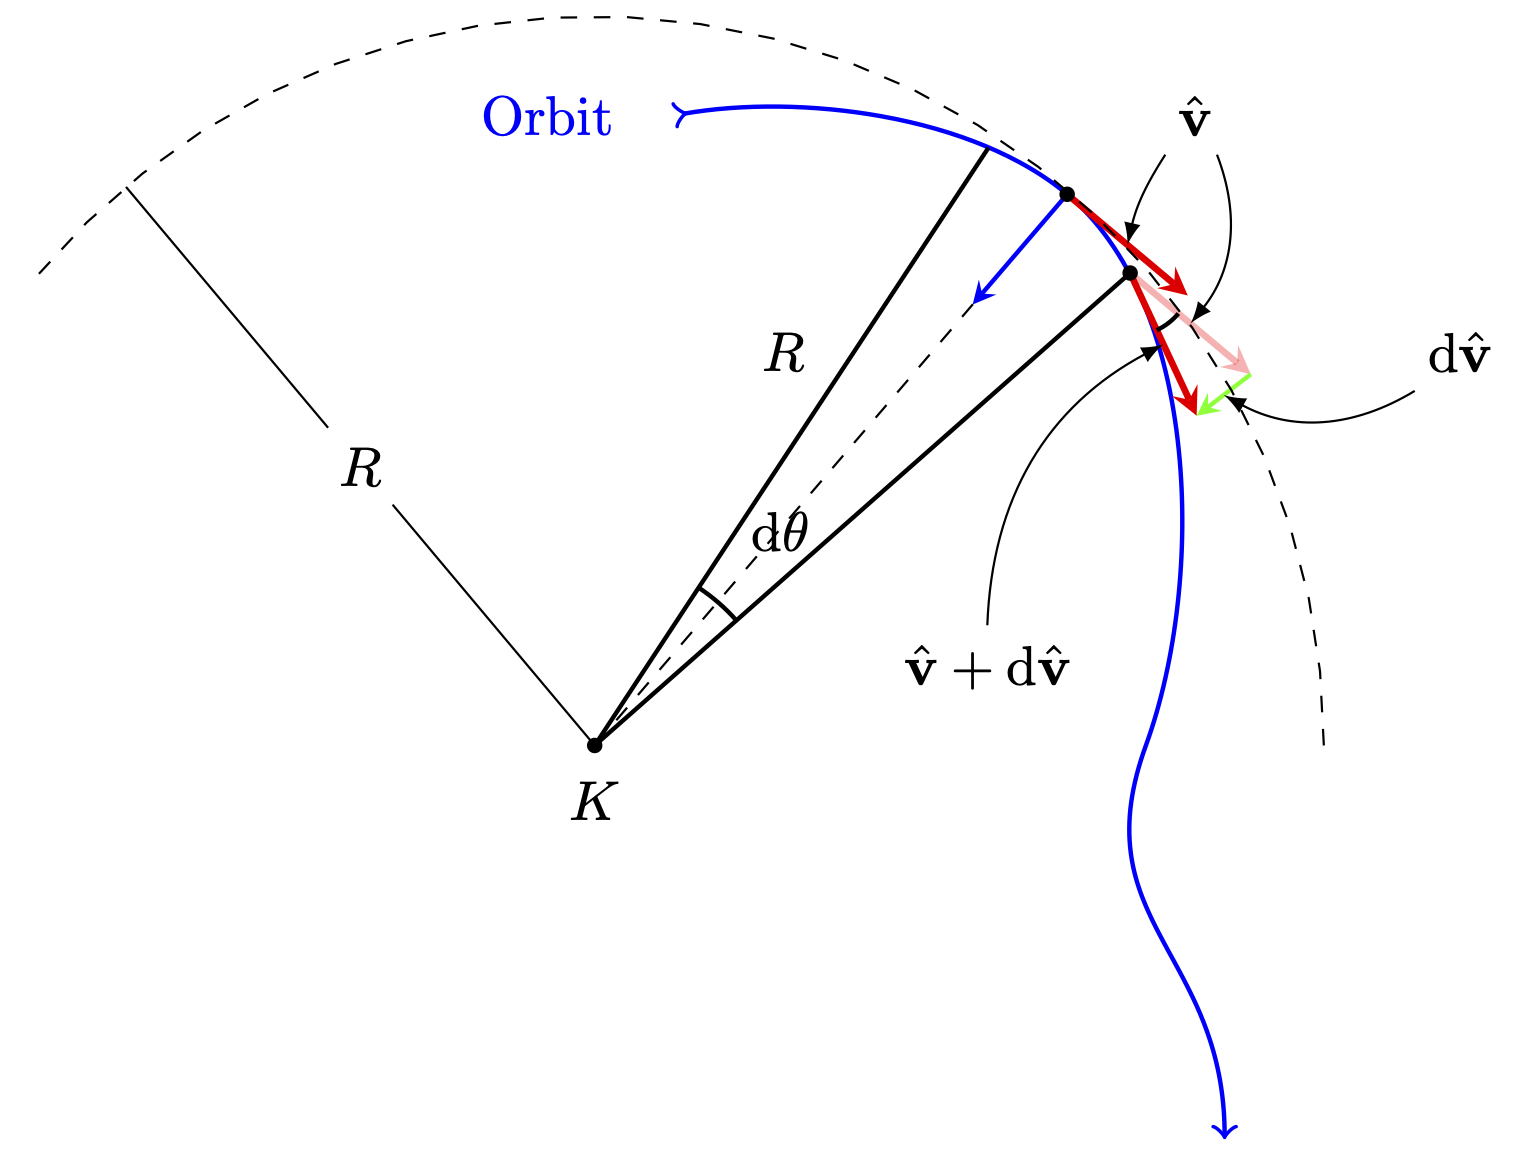
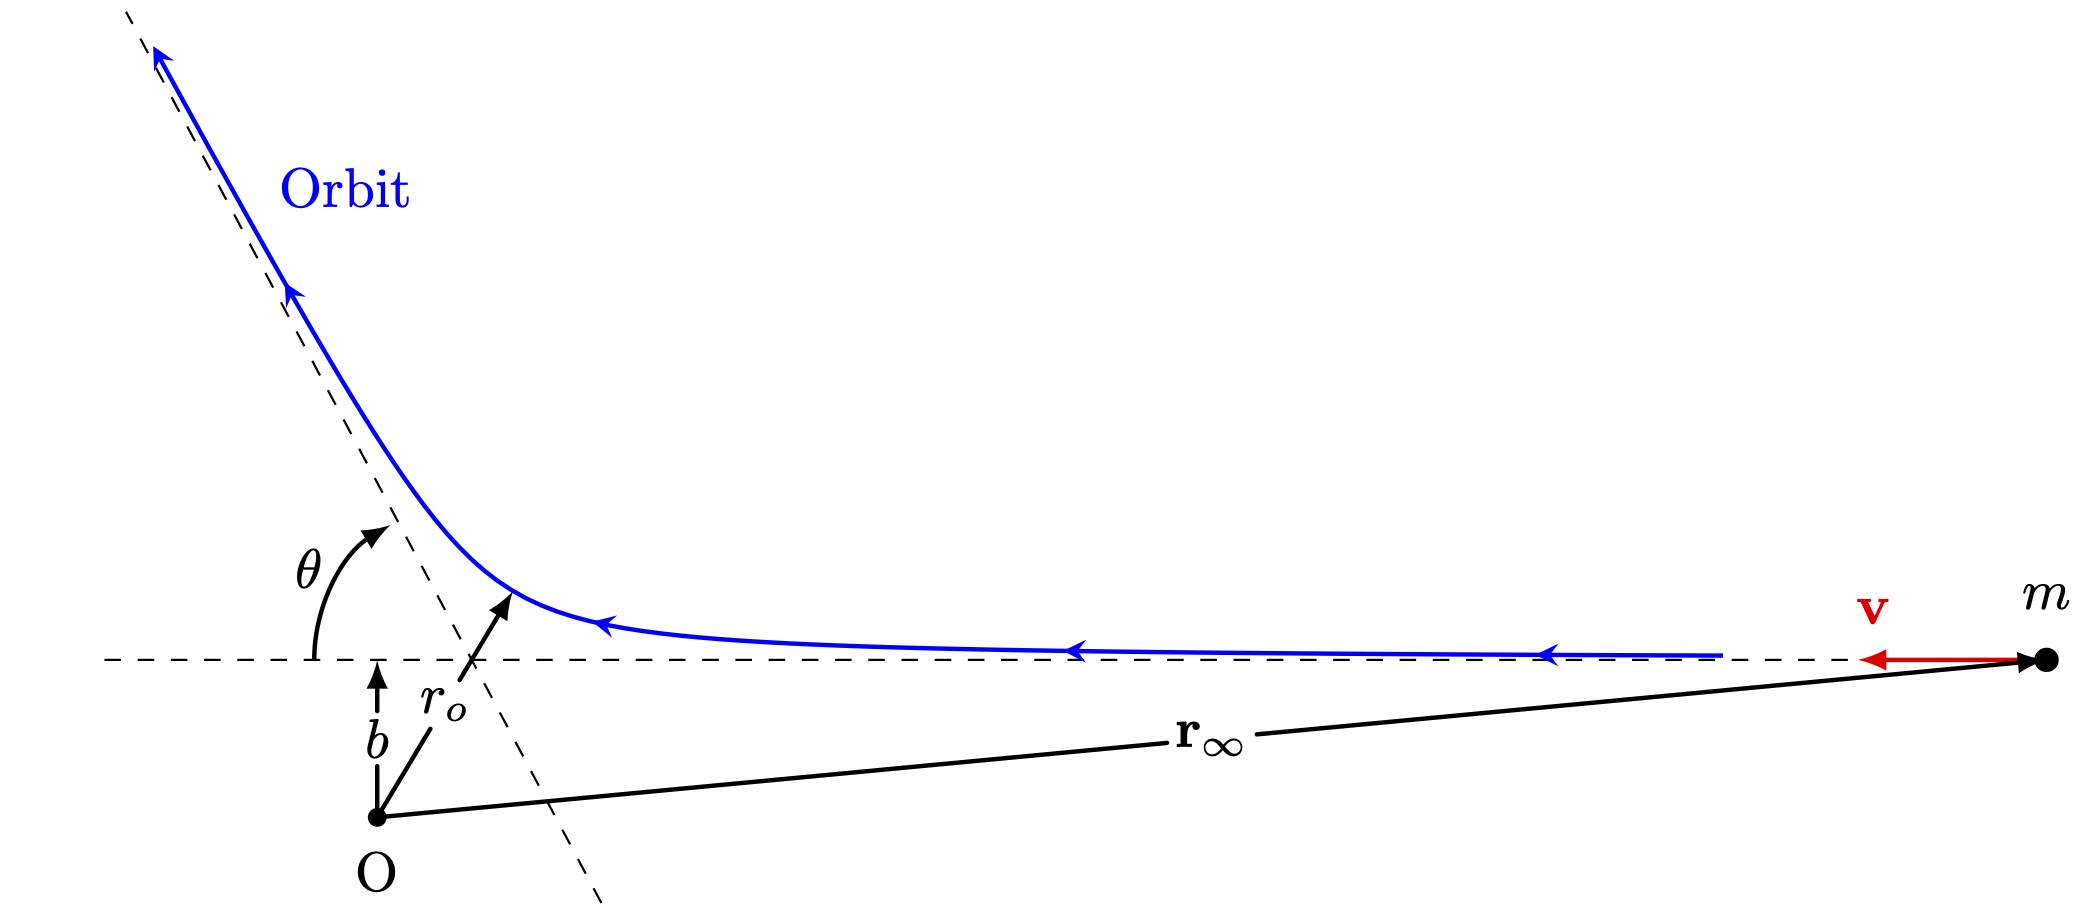
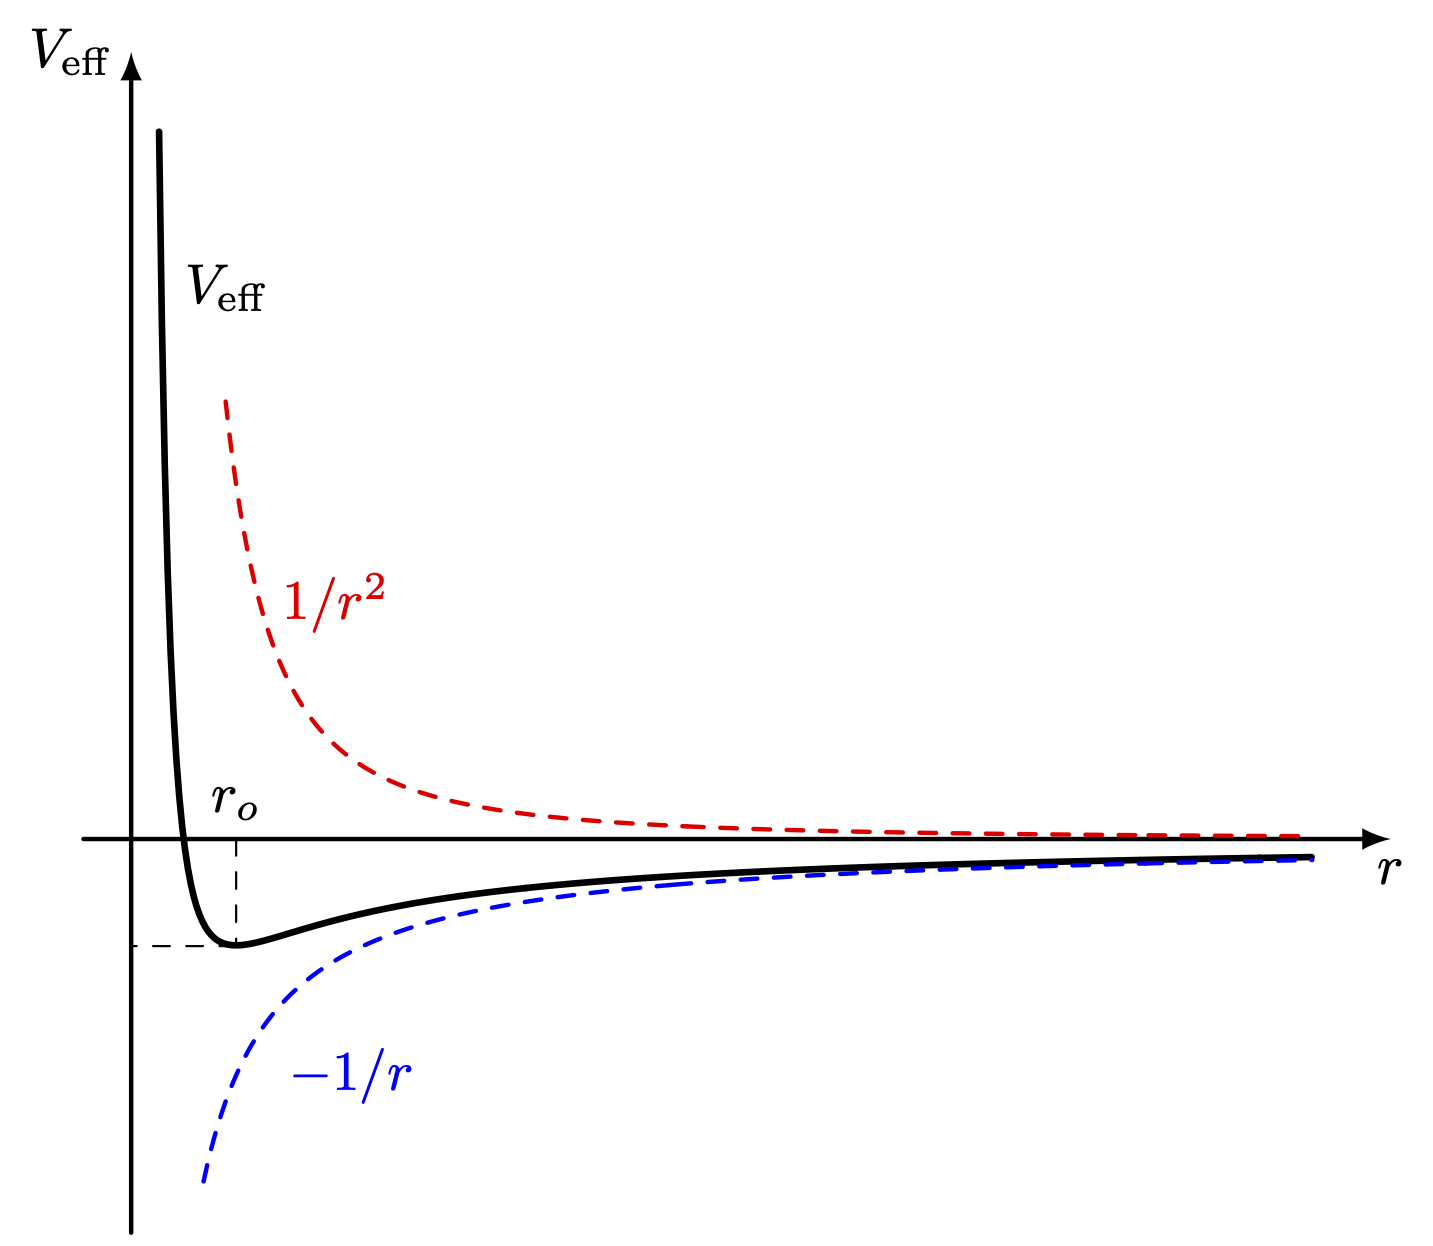
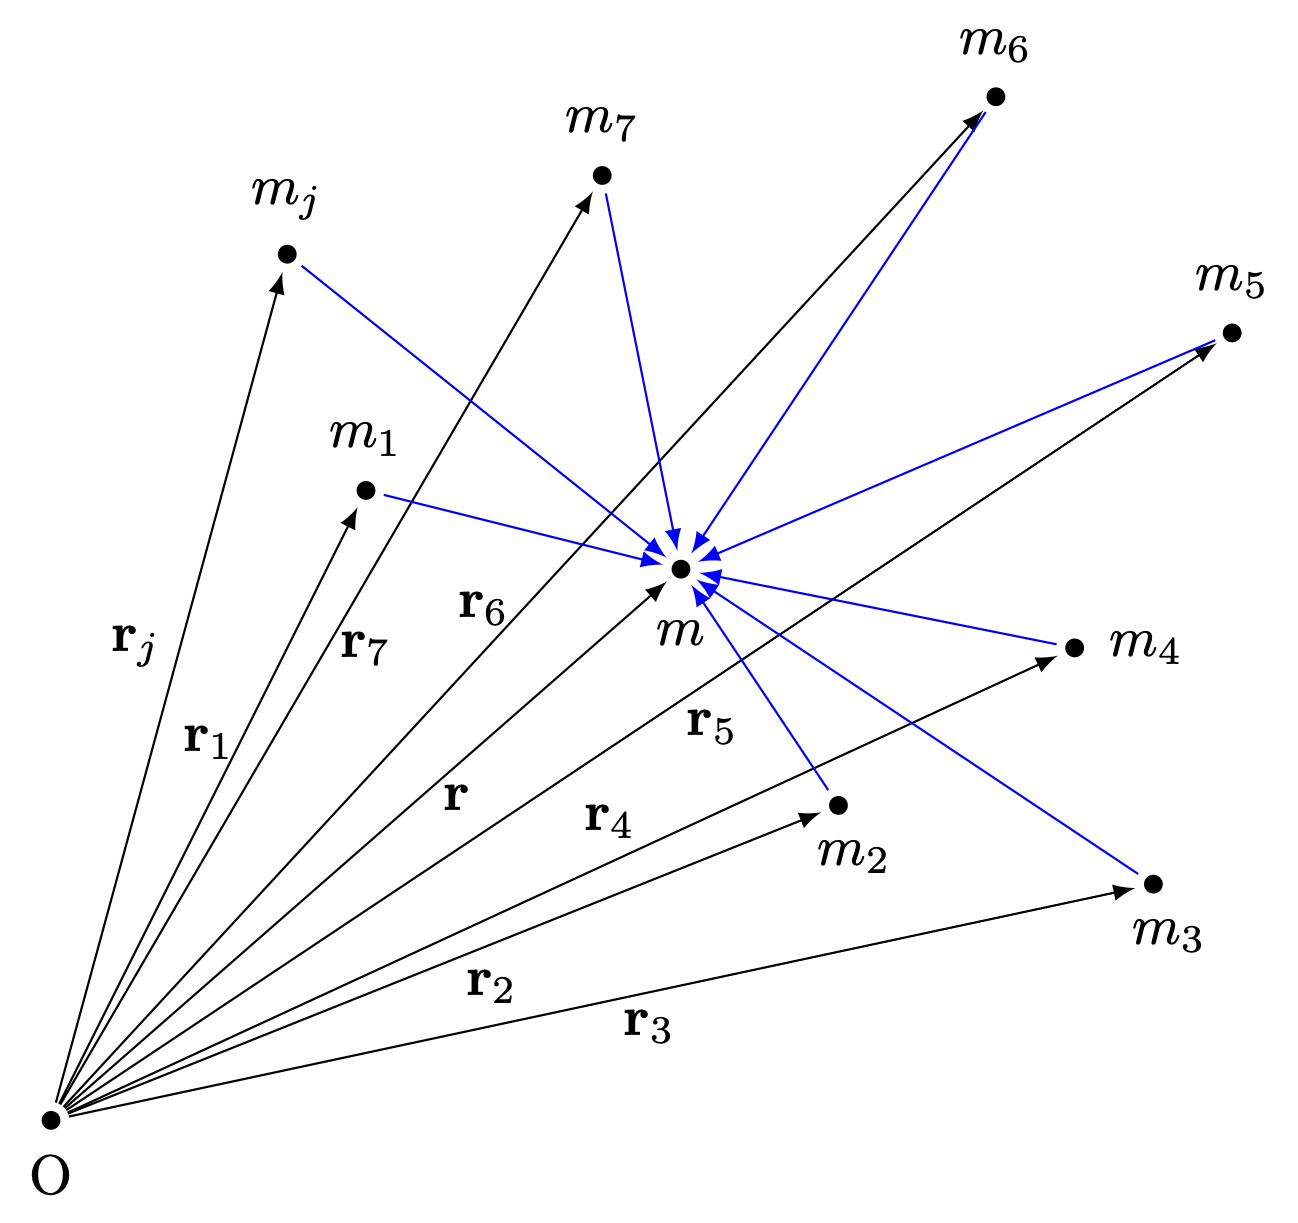
Edit and compile if you like:
\documentclass[border=3pt]{standalone}

%Figures
\usepackage{graphicx}

%Drawing
\usepackage{tikz}

%Tikz Library
\usetikzlibrary{angles, quotes, calc, decorations.markings, intersections}

%Notation
\usepackage{physics}
\usepackage{bm}

%New Command

%%Right Angle
\def\rightangle[size=#1](#2,#3,#4){\draw[thick] ($(#3)!#1!(#2)$) -- ($($(#3)!#1!(#2)$)!#1!90:(#2)$) -- ($(#3)!#1!(#4)$)}

%%Midline Label
\newcommand{\midlabelline}[3]{
   \node (midlabel) at ($ (#1)!.5!(#2) $) {#3};
   \draw (#1) --  (midlabel);
   \draw (midlabel) -- (#2);
}

%Styles

%%Arrow in the Middle
\tikzset{midarrow/.style = {[postaction=decorate, decoration={markings,mark=at position .52 with \arrow{stealth}}, red, line width=1.5]}}

\begin{document}

	%Macros
	\pgfmathsetmacro{\rcircle}{4.63}

	\begin{tikzpicture}
%		%Grid
%		\draw[thin, dotted] (0,0) grid (10,10);
%		\foreach \i in {1,...,10}
%		{
%			\node at (\i,-2ex) {\i};
%		}
%		\foreach \i in {1,...,10}
%		{
%			\node at (-2ex,\i) {\i};
%		}
%		\node at (-2ex,-2ex) {0};

		%Coordinates
		\coordinate (A) at (6,7.5);
		\coordinate (B) at (3.5,8);
		\coordinate (C) at (6.5,4);
		\coordinate (D) at (7,1.5);
		\coordinate (E) at (3,4);
		\coordinate (F) at (5.5,7.795);
		\coordinate (G) at (6.4,7);
		\coordinate (AA) at ($(G)+(-40:1)$);
		\coordinate (AAa) at ($(A)+(-40:1)$);
		\coordinate (GG) at ($(G)+(-65:1)$);
		\coordinate (AAA) at ($(A)+(-40:-1.3)$);
		\coordinate (GGG) at ($(G)+(-63:-1.5)$);
%		%%Nodes
%		\node at (A) {A};
%		\node at (B) {B};
%		\node at (C) {C};
%		\node at (D) {D};
%		\node at (E) {E};
%		\node at (F) {F};
%		\node at (G) {G};

		%Orbit
		\draw[>->, thick, blue] (B) to[out=10, in=140, looseness=0.8] (A) to[out=-40, in=70, looseness=0.8] (C)
					to[out=250, in=90, looseness=1.2] (D);
		\node[blue] at (2.7,8) {Orbit};

		%%Lines
		\draw[dashed] (E) -- (A);
		\draw[thick] (E) -- (F);
		\node at (4.2,6.5) {$R$};
		\draw[thick] (E) -- (G);
%		\draw[dashed, red, domain=5:8] plot (\x,{-0.857*\x+12.657});
%		\draw[dashed, red, domain=5.8:7.9] plot (\x,{-1.82*\x+18.65});

		%%Vector
		\draw[thick, blue, -stealth] (A) -- ($(A)!.2!(E)$);
		\draw[very thick, red, -stealth, name path=line1] (A) -- (AAa);
		\draw[very thick, red, -stealth, opacity=0.3] (G) -- (AA);
		\draw[thick, green, -stealth] (AA) -- (GG);
		\draw[very thick, red, -stealth] (G) -- (GG);
%		%%Vector Dashed
%		\draw[thick, dashed, red] (A) -- ++(-40:-1.2);
%		\draw[thick, dashed, red, name path=line2] (G) -- ++(-63:-1.75);
%		%%Intersection
%		\path [name intersections={of=line1 and line2, by=int}];

		%%Nodes
		\node[shift={(0,1.3)}] (m) at ($(A)!0.7!(AA)$) {$\vu{v}$};
		\draw[-latex] (m) to[bend right=10] ($(A)!0.5!(AAa)$);
		\draw[-latex] (m) to[bend left=30] ($(G)!0.5!(AA)$);
		\node (a) at (5.5,4.5) {$\vu{v}+\dd\vu{v}$};
		\draw[-latex] (a) to[bend left=30] ($(G)!0.5!(GG)$);
		\node (b) at (8.5,6.5) {$\dd\vu{v}$};
		\draw[-latex] (b) to[bend left=30] ($(AA)!0.5!(GG)$);

		%Circle
		\draw[dashed, domain=0:140] plot ({\rcircle*cos(\x)+3}, {\rcircle*sin(\x)+4});
		%%Radius
		\midlabelline{E}{{\rcircle*cos(130)+3}, {\rcircle*sin(130)+4}}{$R$}
		%%Center
		\node[shift={(0,-0.35)}] at (E) {$K$};

		%Angles
		\pic[draw=black, thick, "$\dd\theta$", angle radius=1.2cm, angle eccentricity=1.5] {angle = G--E--F};
		\pic[draw, thick, angle radius=0.4cm] {angle = GG--G--AA};

		%Points
		\draw[fill=black] (A) circle (1.2pt);
		\draw[fill=black] (E) circle (1.2pt);
		\draw[fill=black] (G) circle (1.2pt);

	\end{tikzpicture}

\end{document}
Click to download: acceleration_1.tex
Open in Overleaf: acceleration_1.tex
This file is available on GitHub.
See more on the author page of Alexandros Tsagkaropolulos.


