")


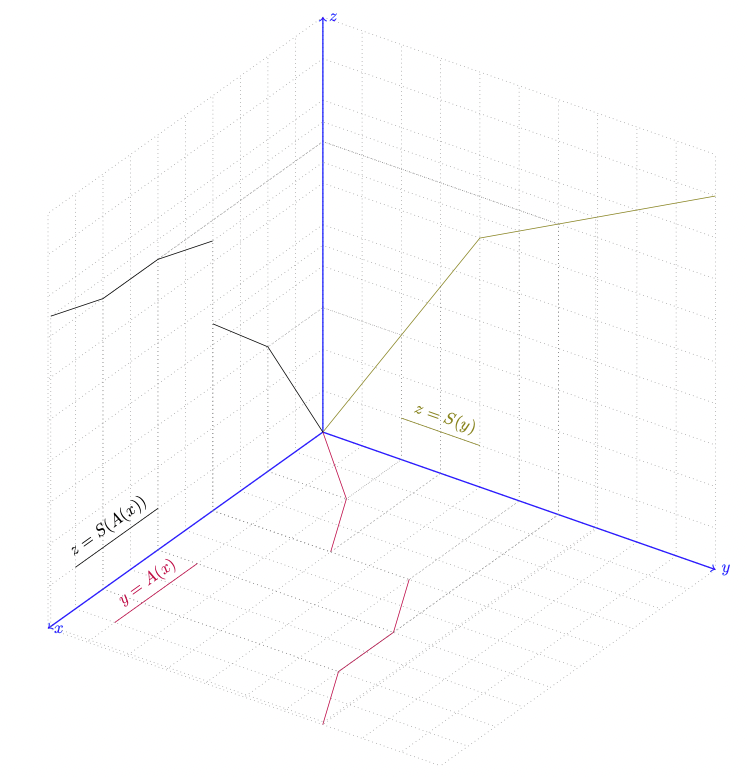
This example draws the composition of two functions in a semi-automatic way, using 3d and intersections.
\documentclass[tikz,border=10pt]{standalone}
\usetikzlibrary{intersections}
\usepackage{tikz-3dplot}
\begin{document}
%%%%%%%%%%%%%%%%%%%%%%%%%%%%%%%%%%%%%%%%%%%%%%%%%%%%%%%%%%%%%%%%%%%%%%
%% This tikz-code allow to "draw" the composition of two functions.
%%
%% The principle is the following: one have to draw y=A(x) and z=S(y),
%% then, for each X, uses projections and intersections to define the
%% point (X,0,S(A(X)).

%%% This is the core command:
%%% It assumes
%%%  - the function A is drawn on name path=A
%%%  - the same for S
%%%  - it exist paths Xaxis, Yaxis, Zaxis
% Parameters:
% #1: X
% #2: name of the point to store (X,0,S(A(X))
\newcommand{\drawDfromX}[2]{
  % Set the source
  \coordinate (X) at (#1,0,0);

  % Goes from (x,0) to (x, A(x))
  \path[name path=XtoA] (X) -- ++(0,10,0);
  \draw[proj,name intersections={of=A and XtoA}] (X) --
  (intersection-1) coordinate (AX);
  % Goes to A(X) on Y axis
  \path[name path=AtoY] (AX) -- ++(-10,0,0);
  \draw[proj, name intersections={of=AtoY and Yaxis}] (AX) --
  (intersection-1) coordinate (YfromX);
  \path[name path=YtoS] (YfromX) -- ++(0,0,10);
  % Goes from (0,y,0) to (0, y, S(y))
  \draw[proj, name intersections={of=S and YtoS}] (YfromX) --
  (intersection-1) coordinate (SY);
  \path[name path=SYtoZ] (SY) -- ++(0,-10,0);
  \draw[proj, name intersections={of=SYtoZ and Zaxis}] (SY) --
  (intersection-1) coordinate (Z);
  % Draw z=S(A(x))=D(x)
  \path[name path=XtoD] (X) -- ++(0,0,10);
  \path[name path=ZtoD] (Z) -- ++(10,0,0);
  \path[name intersections={of= XtoD and ZtoD}]  (intersection-1)
  coordinate  (D) -- (0,0);
  \draw[proj] (X) -- (D)  -- (Z);
  \coordinate (#2) at (D);
}
\tdplotsetmaincoords{60}{125}
\begin{tikzpicture}[tdplot_main_coords,
  cube/.style = {very thick, black},
% grid/.style = {very thin, gray},
  grid/.style = {gray, dotted},
% proj/.style = {very thin, gray},
  proj/.style = {gray, dotted},
  axis/.style = {->, blue, thick}]

  % Draw grids
  \foreach \i in {0,...,10}
  {
    \draw[grid] (\i,0,0) -- (\i,10,0);
    \draw[grid] (\i,0,0) -- (\i,0,10);
    \draw[grid] (0,\i,0) -- (10,\i,0);
    \draw[grid] (0,\i,0) -- (0,\i,10);
    \draw[grid] (0,0,\i) -- (0,10,\i);
    \draw[grid] (0,0,\i) -- (10,0,\i);
  }

  % Draw the axes
  \draw[axis,name path=Xaxis] (0,0,0) -- (10,0,0) node[anchor=west]{$x$};
  \draw[axis,name path=Yaxis] (0,0,0) -- (0,10,0) node[anchor=west]{$y$};
  \draw[axis,name path=Zaxis] (0,0,0) -- (0,0,10) node[anchor=west]{$z$};

  % Draw y=A(x)

  \draw[purple, name path=A] (0,0,0) -- (2,2) -- (4,3)
    (4,5) -- ++(2,1,0) -- ++(2,0,0) -- ++(2,1,0);

  % Draw z = S(y)
  \draw[olive,name path=S] (0,0,0) -- ++(0,4,6) -- ++(0,6,3);

  % Compute D = S(A(x))
  \drawDfromX{2}{D2}
  \drawDfromX{4}{D4}
  \drawDfromX{4.01}{D4+}
  \drawDfromX{6}{D6}
  \drawDfromX{8}{D8}
  \drawDfromX{9.9}{D9}

  % Plot D
  \draw (0,0,0) -- (D2) -- (D4) (D4+) -- (D6) -- (D8) -- (D9);

  % Legend
  \draw[black]  (9,0,1) -- ++(-3,0,0) node[above,pos=.5,sloped] {$z=S(A(x))$};
  \draw[olive]  (0,2,1) -- ++(0,2,0)  node[above,pos=.5,sloped]
  {$z=S(y)$};
  \draw[purple] (9,1,0) -- ++(-3,0,0) node[above,pos=.5,sloped]
  {$y=A(x)$};
\end{tikzpicture}
\end{document}