Here are the Code examples of this chapter. These pages will be updated over time (sectioning, adding pictures, captions, and possibly further examples). I will synchronize the content with GitHub. Finally, the chapter pages and Code examples will be moved to a dedicated website TikZ.org.
Figure 14.1 – A flowchart depicting a diagram creation process:
\documentclass[tikz,border=10pt]{standalone}
\usepackage{smartdiagram}
\smartdiagramset{font=\sffamily}
\begin{document}
\smartdiagram[flow diagram:horizontal]{
  Define Styles, Position nodes, Add arrows,
  Add labels, Review and refine}
\end{document}

Figure 14.2 – A vertical flowchart with flat colors and without shadows:
\documentclass[tikz,border=10pt]{standalone}
\usepackage{smartdiagram}
\smartdiagramset{font=\sffamily,
   text width = 3cm, back arrow disabled}
\tikzset{module/.append style=
  { top color=\col, bottom color=\col},
  every shadow/.style = {fill=none, shadow scale=0}}
\begin{document}
\smartdiagram[flow diagram]{
  Define styles, Position nodes, Add arrows,
  Add labels, Review and refine}
\end{document}
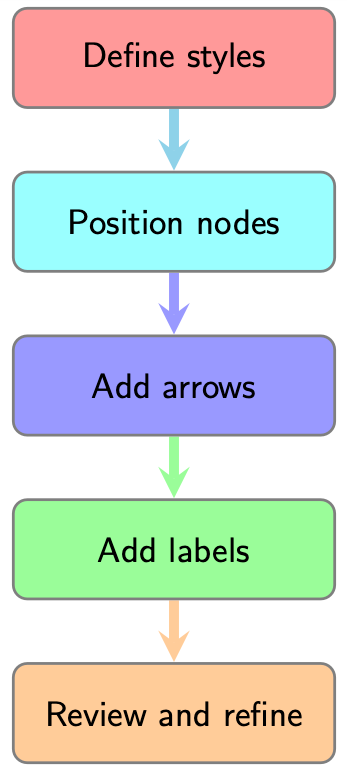
Figure 14.3 – A sequence diagram with custom colors
\documentclass[tikz,border=10pt]{standalone}
\usepackage{smartdiagram}
\begin{document}
\smartdiagramset{sequence item font size=\sffamily\Large\strut,
   set color list={red!80, red!60, red!45, red!30} }
\tikzset{module/.append style = {top color=\col} }
\smartdiagram[sequence diagram]{
  Styles, Positions, Arrows, Labels}
\end{document}

Figure 14.4 – A circular diagram:
\documentclass[tikz,border=10pt]{standalone}
\usepackage{smartdiagram}
\smartdiagramset{font=\sffamily}
\begin{document}
\smartdiagram[circular diagram:clockwise]{
  Define styles, Position nodes, Add arrows,
  Add labels, Review and refine}
\end{document}
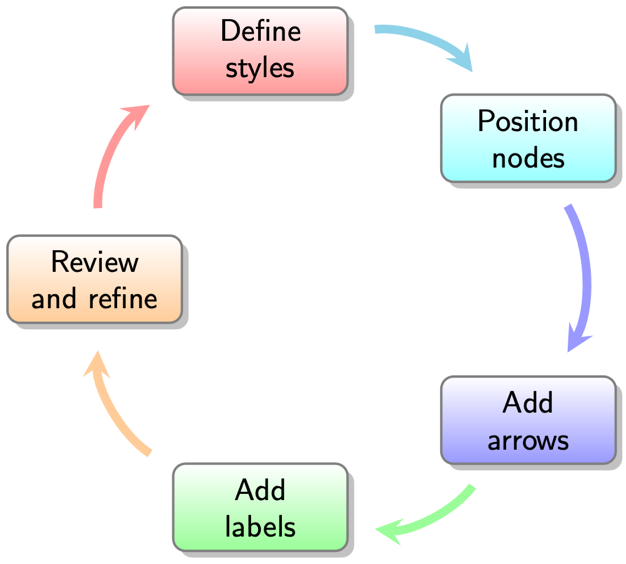
Figure 14.5 – A bubble diagram:
\documentclass[tikz,border=10pt]{standalone}
\usepackage{smartdiagram}
\smartdiagramset{bubble node font=\sffamily\Large,
 bubble center node font=\sffamily\Huge}
\begin{document}
\smartdiagram[bubble diagram]{Diagrams,
      Nodes, Edges, Arrows, Labels, Colors}
\end{document}
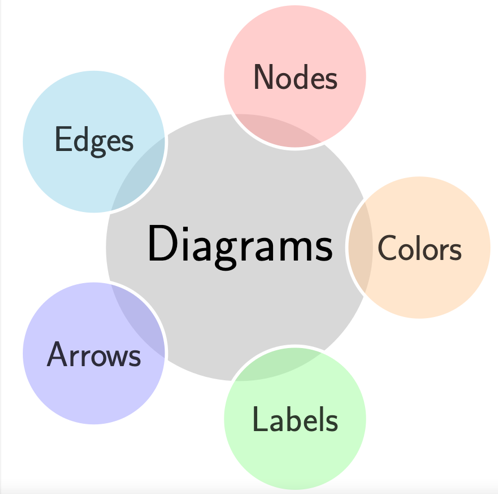
Figure 14.6 – A connected constellation diagram:
\documentclass[tikz,border=10pt]{standalone}
\usepackage{smartdiagram}
\smartdiagramset{planet font=\sffamily\LARGE,
  planet text width=2.2cm,
  satellite font=\sffamily}
\begin{document}
\smartdiagram[connected constellation diagram]{
  Drawing diagrams, Define styles,
  Position nodes, Add arrows, Add labels}
\end{document}
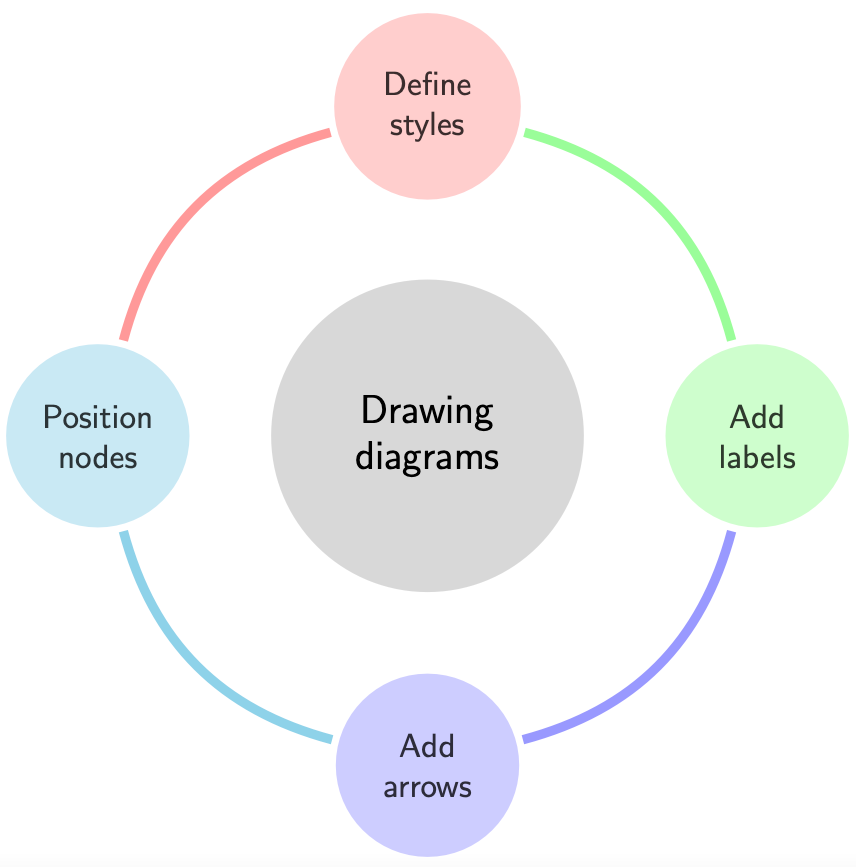
Figure 14.7 – A constellation diagram with arrows:
\documentclass[tikz,border=10pt]{standalone}
\usepackage{smartdiagram}
\usetikzlibrary{shapes.geometric}
\smartdiagramset{planet font=\sffamily\Huge,
   satellite font=\sffamily,
   planet color=green!40, uniform connection color=true,
   uniform color list = red!40 for 8 items}
\tikzset{satellite/.append style={regular polygon,
  regular polygon sides=8, inner sep=0pt},
  planet/.append style={regular polygon,
  regular polygon sides=8, inner sep=6pt}}
\begin{document}
\smartdiagram[constellation diagram]{TikZ,
  pgfplots, smartdiagram, hobby, tikzducks,
  tikzlings, tikzpeople, tikzmark, tikz-ext}
\end{document}
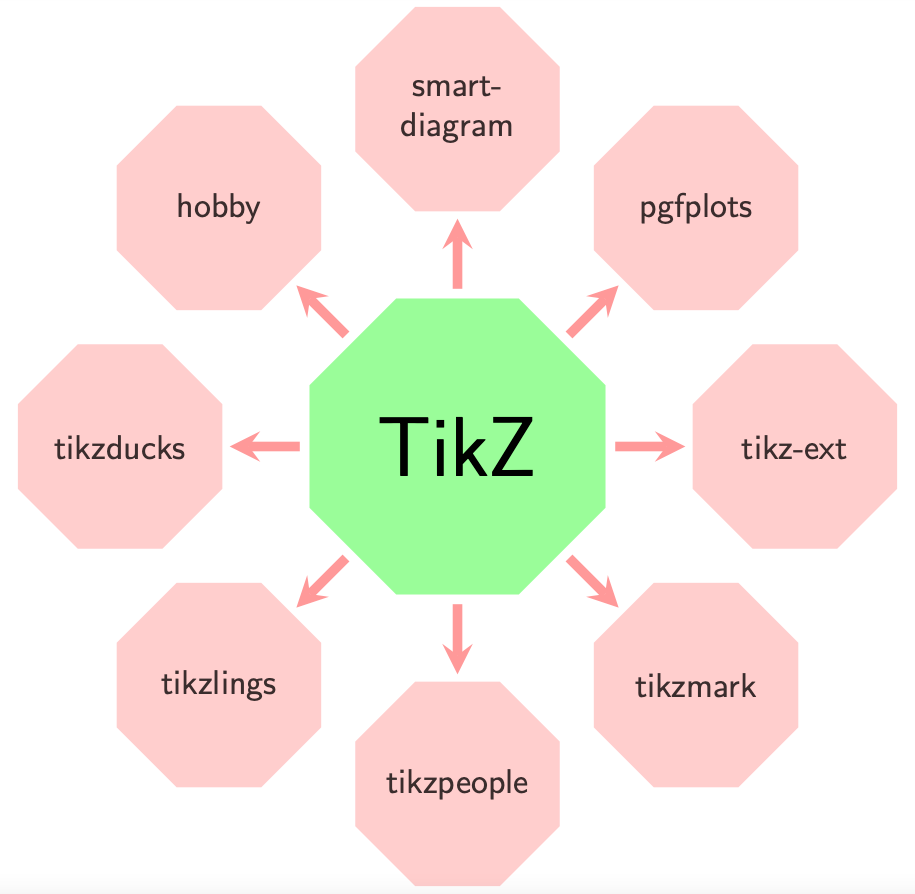
Figure 14.8 – A descriptive diagram:
\documentclass[tikz,border=10pt]{standalone}
\usepackage{smartdiagram}
\begin{document}
\smartdiagramset{description title font=\sffamily\LARGE,
  description font=\sffamily\footnotesize}
\smartdiagram[descriptive diagram]{
  {PGF,{Portable Graphics Format, package for
        creating graphics in \LaTeX{} documents}},
  {TikZ, {User-friendly frontend for PGF}},}
\end{document}
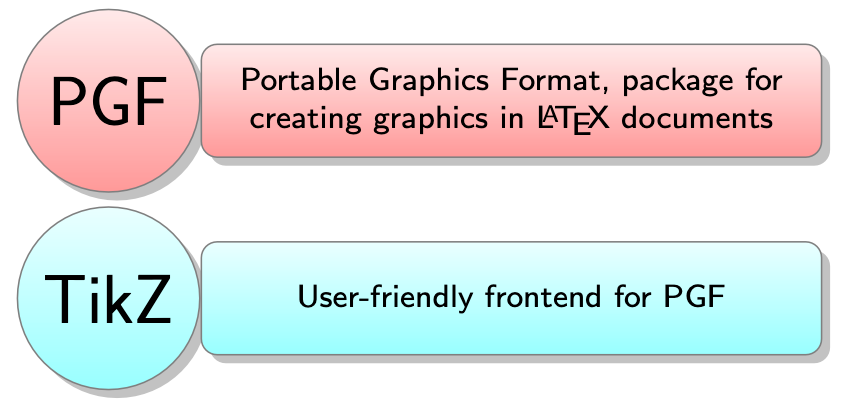
Figure 14.9 – A customized bullet list diagram:
\documentclass[tikz,border=10pt]{standalone}
\usepackage{smartdiagram}
\usepackage{fontawesome5}
\begin{document}
\smartdiagramset{description title font=\LARGE,
  description font=\sffamily}
\smartdiagram[descriptive diagram]{
  {\faLightbulb[regular],{Identify purpose and message,
    gather information and data}},
  {\faProjectDiagram, {Select diagram type,
    define node shapes, colors, and text styles}},
  {\faPencil*, {Draw nodes, insert text, draw arrows,
    add labels}},
  {\faAlignLeft, {Align nodes, refine positioning}},
  {\faRedo, {Fine-tune, review and revise}}, }
\end{document}
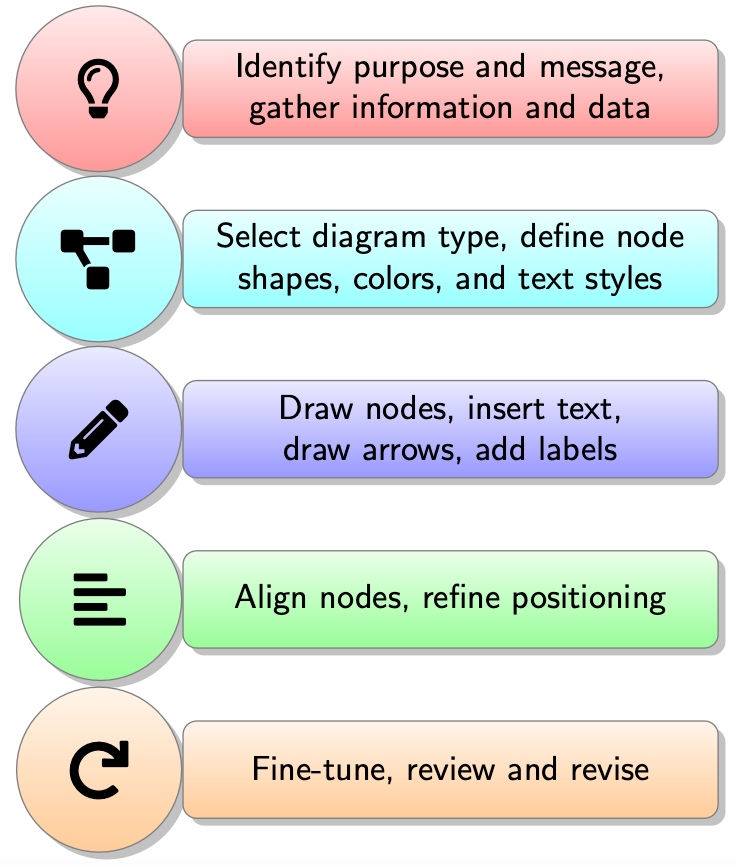
Figure 14.10 – A priority descriptive diagram:
\documentclass[tikz,border=10pt]{standalone}
\usepackage{smartdiagram}
\begin{document}
\smartdiagramset{description font=\sffamily\Large,
  description text width = 1.9cm,
  description width = 2cm}
\smartdiagram[priority descriptive diagram]{
      \TeX, \LaTeX, PGF, TikZ, pgfplots}
\end{document}
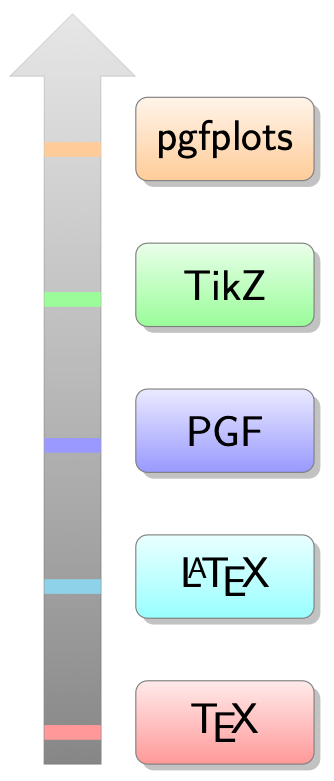
Figure 14.11 – A Google Trends chart for LaTeX graphics packages:
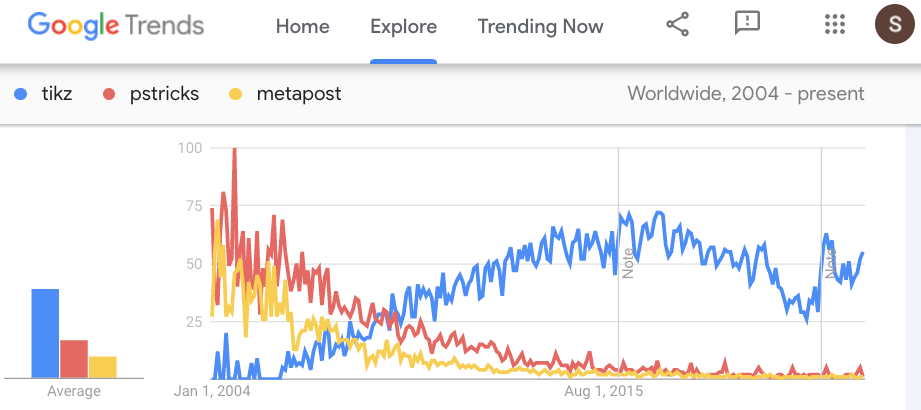
Figure 14.12 – A line chart representing keyword popularity over time:
\documentclass[border=10pt]{standalone}
\usepackage{pgfplots}
\tikzset{every node/.style={font=\sffamily}}
\usepackage{sansmath}
\pgfplotsset{tick label style = {font=\sansmath}}
\begin{document}
\begin{tikzpicture}
  \begin{axis}[title  = Keyword popularity in Google trends,
    x tick label style =
      {/pgf/number format/set thousands separator={}},
    legend pos = north west,
    legend cell align=left ]
  \addplot coordinates { (2007,16) (2008,19) (2009,30) (2010,36)
    (2011,42) (2012,48) (2013,55)};
  \addplot coordinates { (2007,39) (2008,28) (2009,24) (2010,19)
    (2011,15) (2012,12) (2013,8)};
  \addplot coordinates { (2007,22) (2008,13) (2009,11) (2010,8)
    (2011,6) (2012,4) (2013,4)};
  \legend{tikz, pstricks, metapost}
  \end{axis}
\end{tikzpicture}
\end{document}
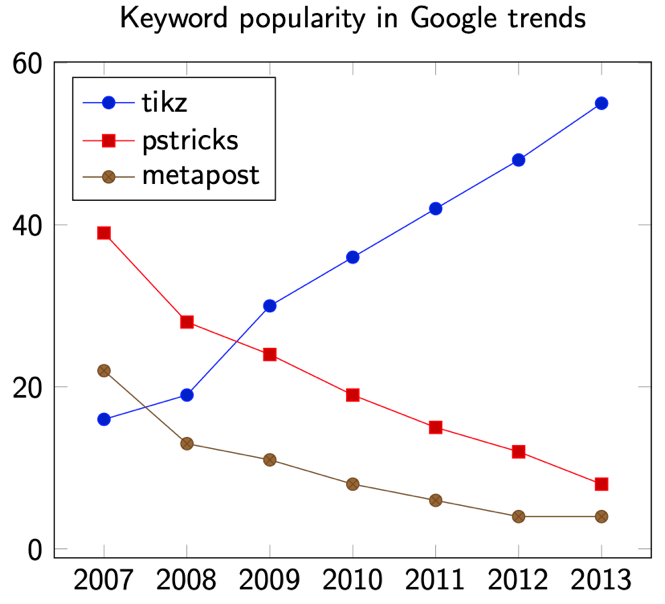
Figure 14.13 – A stacked line chart showing cumulated values and relative proportions:
\documentclass[border=10pt]{standalone}
\usepackage{pgfplots}
\usepackage{sansmath}
\pgfplotsset{tick label style = {font=\sansmath\sffamily}}
\begin{document}
\begin{tikzpicture}[every node/.style={font=\sffamily}]
  \begin{axis}[title  = Keyword popularity in Google trends,
    stack plots=y,
    area style,
    x tick label style =
      {/pgf/number format/set thousands separator={}},
    legend pos = outer north east,
    legend cell align=left ]
  \addplot coordinates { (2007,16) (2008,19) (2009,30) (2010,36)
    (2011,42) (2012,48) (2013,55)}\closedcycle;;
  \addplot coordinates { (2007,39) (2008,28) (2009,24) (2010,19)
    (2011,15) (2012,12) (2013,8)}\closedcycle;;
  \addplot coordinates { (2007,22) (2008,13) (2009,11) (2010,8)
    (2011,6) (2012,4) (2013,4)}\closedcycle;;
  \legend{tikz, pstricks, metapost}
  \end{axis}
\end{tikzpicture}
\end{document}
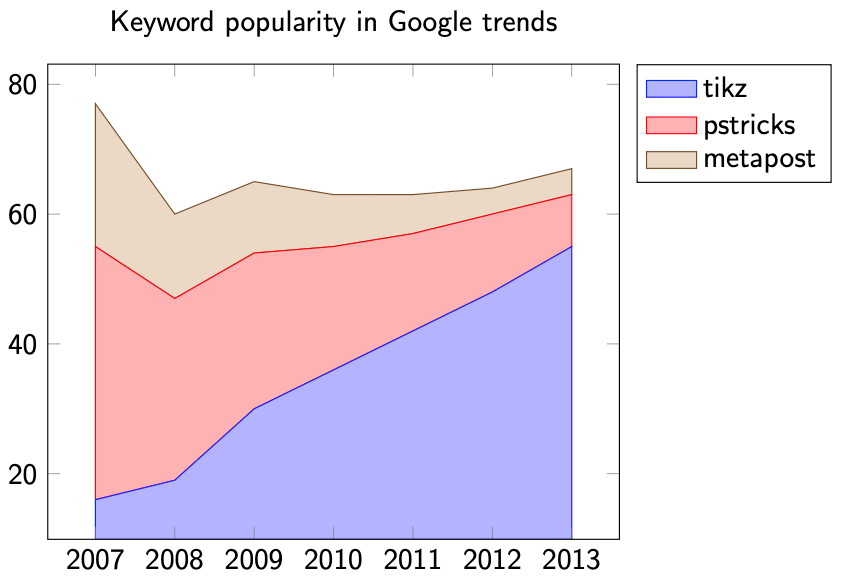
Figure 14.14 – A bar chart visualizing relative and absolute values over time:
\documentclass[border=10pt]{standalone}
\usepackage{pgfplots}
\usepackage{sansmath}
\pgfplotsset{tick label style = {font=\sansmath\sffamily}}
\begin{document}
\begin{tikzpicture}[every node/.style={font=\sffamily}]
  \begin{axis}[title  = Keyword popularity in Google trends,
    ybar,
    bar width=2mm,
    x tick label style =
      {/pgf/number format/set thousands separator={}},
  legend pos=north west,
  legend cell align=left]
  \addplot coordinates { (2007,16) (2008,19) (2009,30) (2010,36)
    (2011,42) (2012,48) (2013,55)};
  \addplot coordinates { (2007,39) (2008,28) (2009,24) (2010,19)
    (2011,15) (2012,12) (2013,8)};
  \addplot coordinates { (2007,22) (2008,13) (2009,11) (2010,8)
    (2011,6) (2012,4) (2013,4)};
  \legend{tikz, pstricks, metapost}
  \end{axis}
\end{tikzpicture}
\end{document}
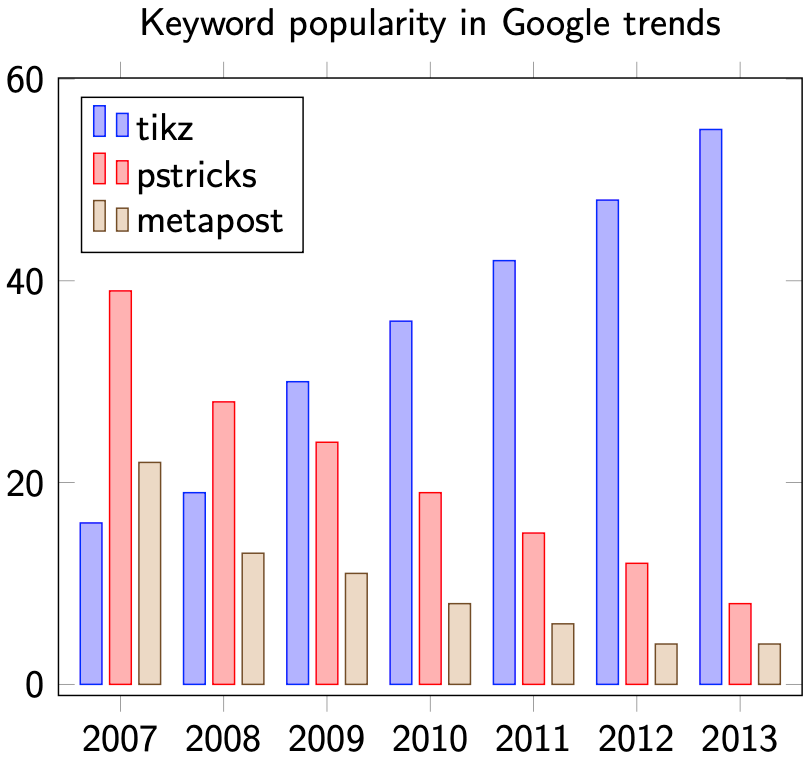
Figure 14.15 – A stacked bar chart showing cumulated values and relative proportions:
\documentclass[border=10pt]{standalone}
\usepackage{pgfplots}
\usepackage{sansmath}
\pgfplotsset{tick label style = {font=\sansmath\sffamily}}
\begin{document}
\begin{tikzpicture}[every node/.style={font=\sffamily}]
  \begin{axis}[title  = Keyword popularity in Google trends,
    ybar stacked,
    x tick label style =
      {/pgf/number format/set thousands separator={}},
    legend pos = outer north east,
    legend cell align=left]
  \addplot coordinates { (2007,16) (2008,19) (2009,30) (2010,36)
    (2011,42) (2012,48) (2013,55)};
  \addplot coordinates { (2007,39) (2008,28) (2009,24) (2010,19)
    (2011,15) (2012,12) (2013,8)};
  \addplot coordinates { (2007,22) (2008,13) (2009,11) (2010,8)
    (2011,6) (2012,4) (2013,4)};
  \legend{tikz, pstricks, metapost}
  \end{axis}
\end{tikzpicture}
\end{document}
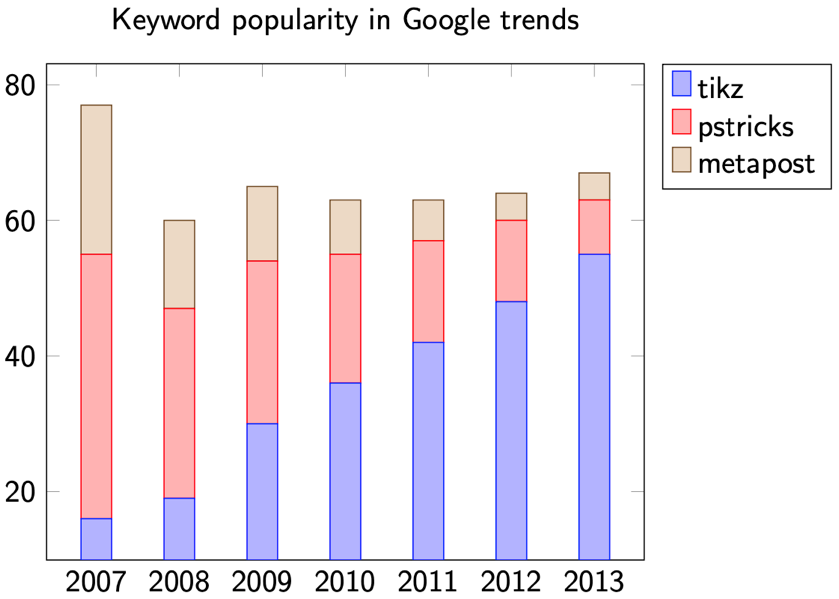
Figure 14.16 – A horizontal bar chart with symbolic coordinates:
\documentclass[border=10pt]{standalone}
\usepackage{pgfplots}
\pgfplotsset{compat=1.18}
\usepackage{sansmath}
\begin{document}
\begin{tikzpicture}[every node/.style={font=\sffamily}]
  \begin{axis}[title  = Keyword popularity on LaTeX.org,
    height=6cm, enlarge y limits  = 0.6,
    xbar,
    axis x line = none,
    y axis line style = transparent,
    ytick = data,
    tickwidth = 0pt,
    symbolic y coords = {TikZ, PSTricks, MetaPost},
    nodes near coords,
    nodes near coords style = {font=\sansmath},
    legend cell align = right ]
  \addplot coordinates { (2750,TikZ) (1568,PSTricks)
                         (69,MetaPost) };
  \addplot coordinates { (1197,TikZ) (585,PSTricks)
                         (41,MetaPost)};
  \legend{Posts,Topics}
  \end{axis}
\end{tikzpicture}
\end{document}
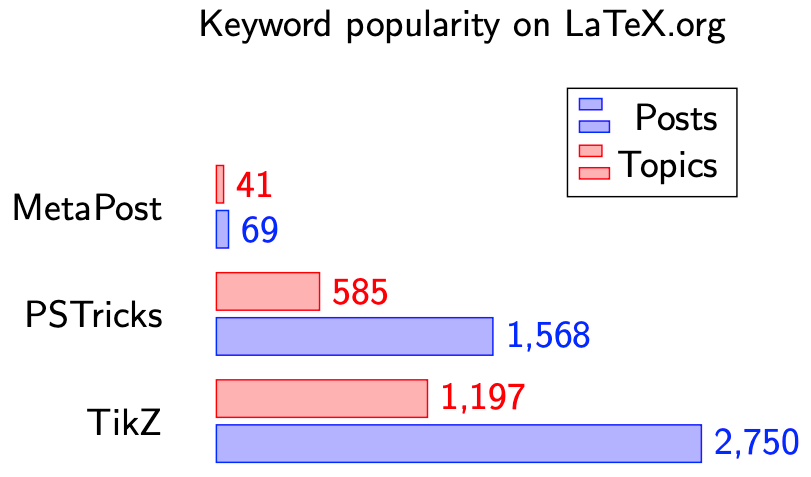
Figure 14.17 – A stacked horizontal bar chart
\documentclass[border=10pt]{standalone}
\usepackage{pgfplots}
\pgfplotsset{compat=1.18}
\usepackage{sansmath}
\begin{document}
\begin{tikzpicture}[every node/.style={font=\sffamily}]
  \begin{axis}[title  = Keyword popularity on LaTeX.org,
    height=6cm, enlarge y limits  = 2.2,
    xbar stacked, xmin=-10,
    axis x line = none,
    y axis line style = transparent,
    ytick = data,
    tickwidth = 0pt,
    symbolic y coords = {TikZ, PSTricks, MetaPost},
    nodes near coords,
    nodes near coords style = {font=\sansmath},
    legend cell align = right ]
    \addplot coordinates { (2750,TikZ) (1568,PSTricks) };
    \addplot coordinates { (1197,TikZ) (585,PSTricks)  };
    \legend{Posts,Topics}
  \end{axis}
\end{tikzpicture}
\end{document}
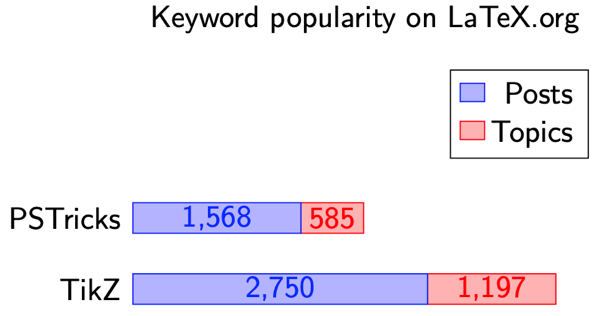
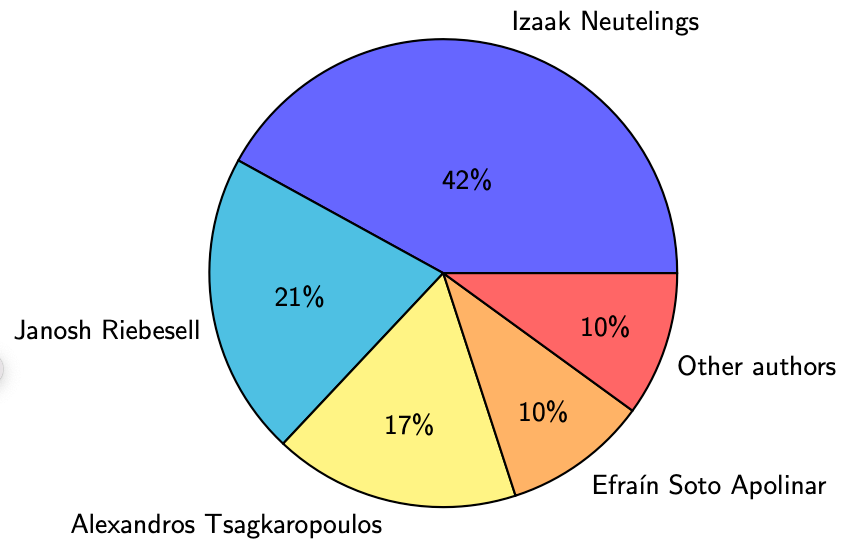
Figure 14.18 – A pie chart:
\documentclass[border=10pt]{standalone}
\usepackage{pgf-pie}
\begin{document}
\begin{tikzpicture}[every node/.style={font=\sffamily}]
  \pie{ 42/Izaak Neutelings,
        21/Janosh Riebesell,
        17/Alexandros Tsagkaropoulos,
        10/Efraín Soto Apolinar,
        10/Other authors }
\end{tikzpicture}
\end{document}
With absolute values and auto-summation:
\documentclass[border=10pt]{standalone}
\usepackage{pgf-pie}
\begin{document}
\begin{tikzpicture}[every node/.style={font=\sffamily}]
  \pie[sum=auto]{ 207/Izaak Neutelings,
        105/Janosh Riebesell,
        85/Alexandros Tsagkaropoulos,
        49/Efraín Soto Apolinar,
        49/Other authors }
\end{tikzpicture}
\end{document}
Wheel chart:
\documentclass[border=10pt]{standalone}
\usepackage{wheelchart}
\begin{document}
\begin{tikzpicture}[every node/.style={font=\sffamily}]
  \wheelchart [middle={{\LARGE TikZ.net}\\contributions},
    inner data = {\scriptsize\WCperc}, inner data sep=0.3,
    wheel lines=white]
    {42/red/Izaak\\Neutelings,
     21/orange/Janosh Riebesell,
     17/yellow/Alexandros\\Tsagkaropoulos,
     10/green/Efraín Soto Apolinar,
     10/blue/Other authors}
\end{tikzpicture}
\end{document}