")


Edit and compile if you like:
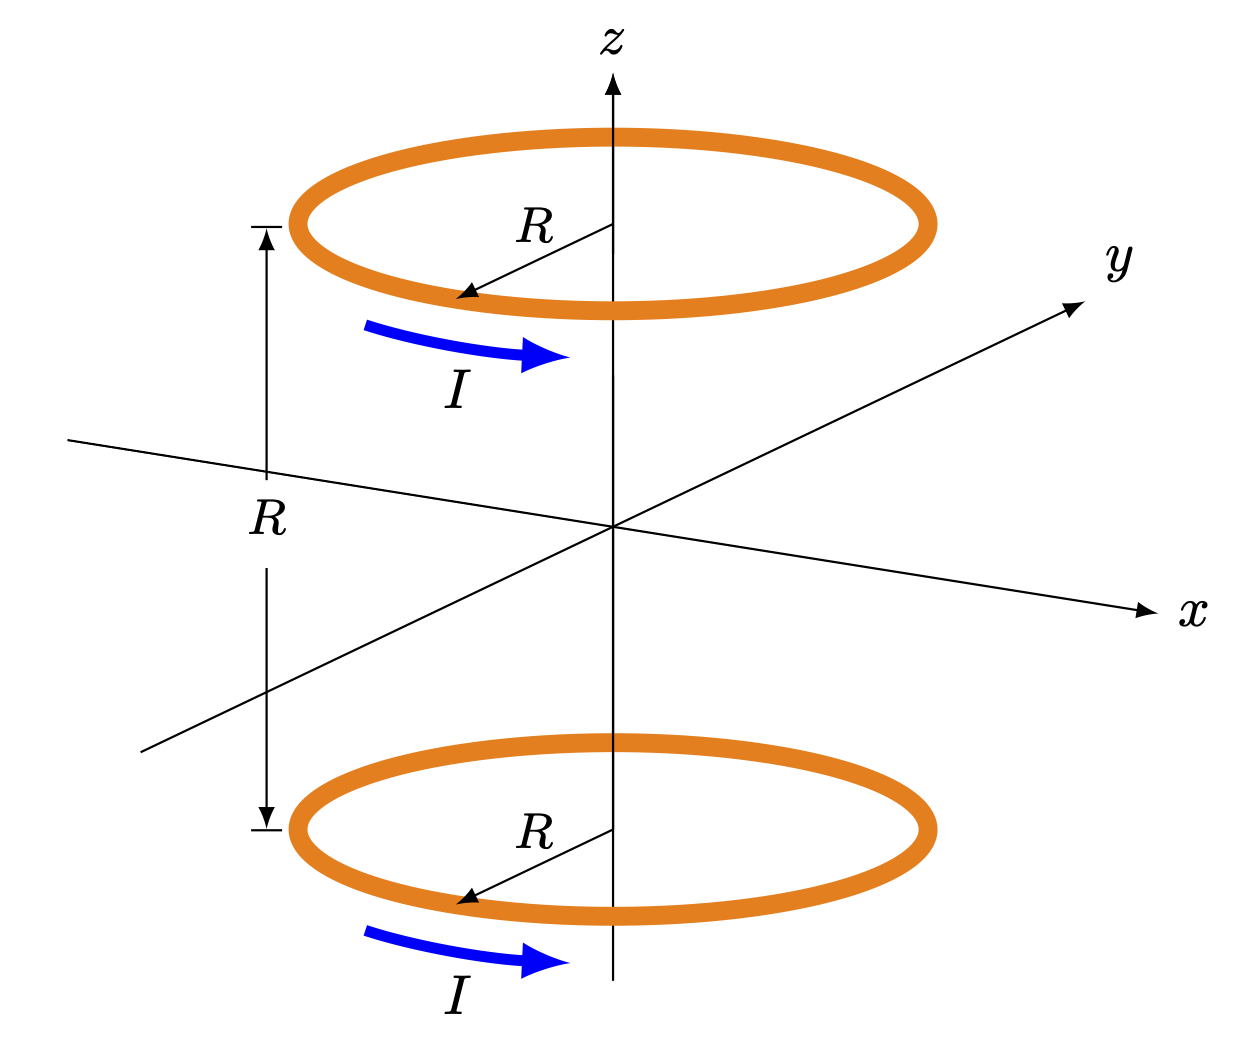
\documentclass[border=2pt]{standalone}

% Drawing
\usepackage{tikz}
\usepackage{tikz-3dplot}

% Style
\tikzset{>=latex}

% Define Color
\definecolor{amber}{rgb}{1.0, 0.5, 0}

\begin{document}

	% Axis Angles
	\tdplotsetmaincoords{74}{120}

	\begin{tikzpicture}[scale=2, tdplot_main_coords]
		% Axis
	    \draw[->] (3,0,0) -- (-3,0,0) node[above right]{$y$};
	    \draw[->] (0,-2,0) -- (0,2,0) node[right]{$x$};
	    \draw[->] (0,0,-1.5) -- (0,0,1.5) node[above]{$z$};

	    % Circular Loops
		\draw[line width = 1.2mm, amber] (0,0,1) circle [radius=1];
		\draw[line width = 1.2mm, amber] (0,0,-1) circle [radius=1];

		% Refinements for 3d View
		\draw (0,0,-1) -- (0,0,0.5);
		\draw[->] (0,0,0.9) -- (0,0,1.5);

		% Radius
		\draw [->] (0,0,1) -- (1,0,1) node [midway, above] {\small$R$} ;
		\draw [->] (0,0,-1) -- (1,0,-1) node [midway, above] {\small$R$} ;

		% Center Distance
		\draw[|<-] (2.2,0,1.54) -- (2.2,0,0.7) node [below] {\small$R$};
		\draw[->|] (2.2,0,0.41)-- (2.2,0,-0.46) ;

		% Current Direction
		\draw [line width = 0.7mm, blue, ->] (1.4,-0.1,1) arc (-20:20:1.1) node [black, midway, below] {$I$};
		\draw [line width = 0.7mm, blue, ->] (1.4,-0.1,-1) arc (-20:20:1.1) node [black, midway, below] {$I$};
	\end{tikzpicture}

\end{document}
Click to download: helmholtz_coils.tex
Open in Overleaf: helmholtz_coils.tex
This file is available on GitHub.
See more on the author page of Alexandros Tsagkaropolulos.