\documentclass[border=3pt]{standalone}

% Drawing
\usepackage{tikz}

% Notation
\usepackage{amsmath}

\begin{document}

	\begin{tikzpicture}[line cap=round]
%		%Grid
%		\def\length{4}
%		\draw[thin, dotted] (-\length,-\length) grid (\length,\length);
%		\foreach \i in {1,...,\length}
%		{
%			\node at (\i,-2ex) {\i};
%			\node at (-\i,-2ex) {-\i};
%		}
%		\foreach \i in {1,...,\length}
%		{
%			\node at (-2ex,\i) {\i};
%			\node at (-2ex,-\i) {-\i};
%		}
%		\node at (-2ex,-2ex) {0};

		% Axis
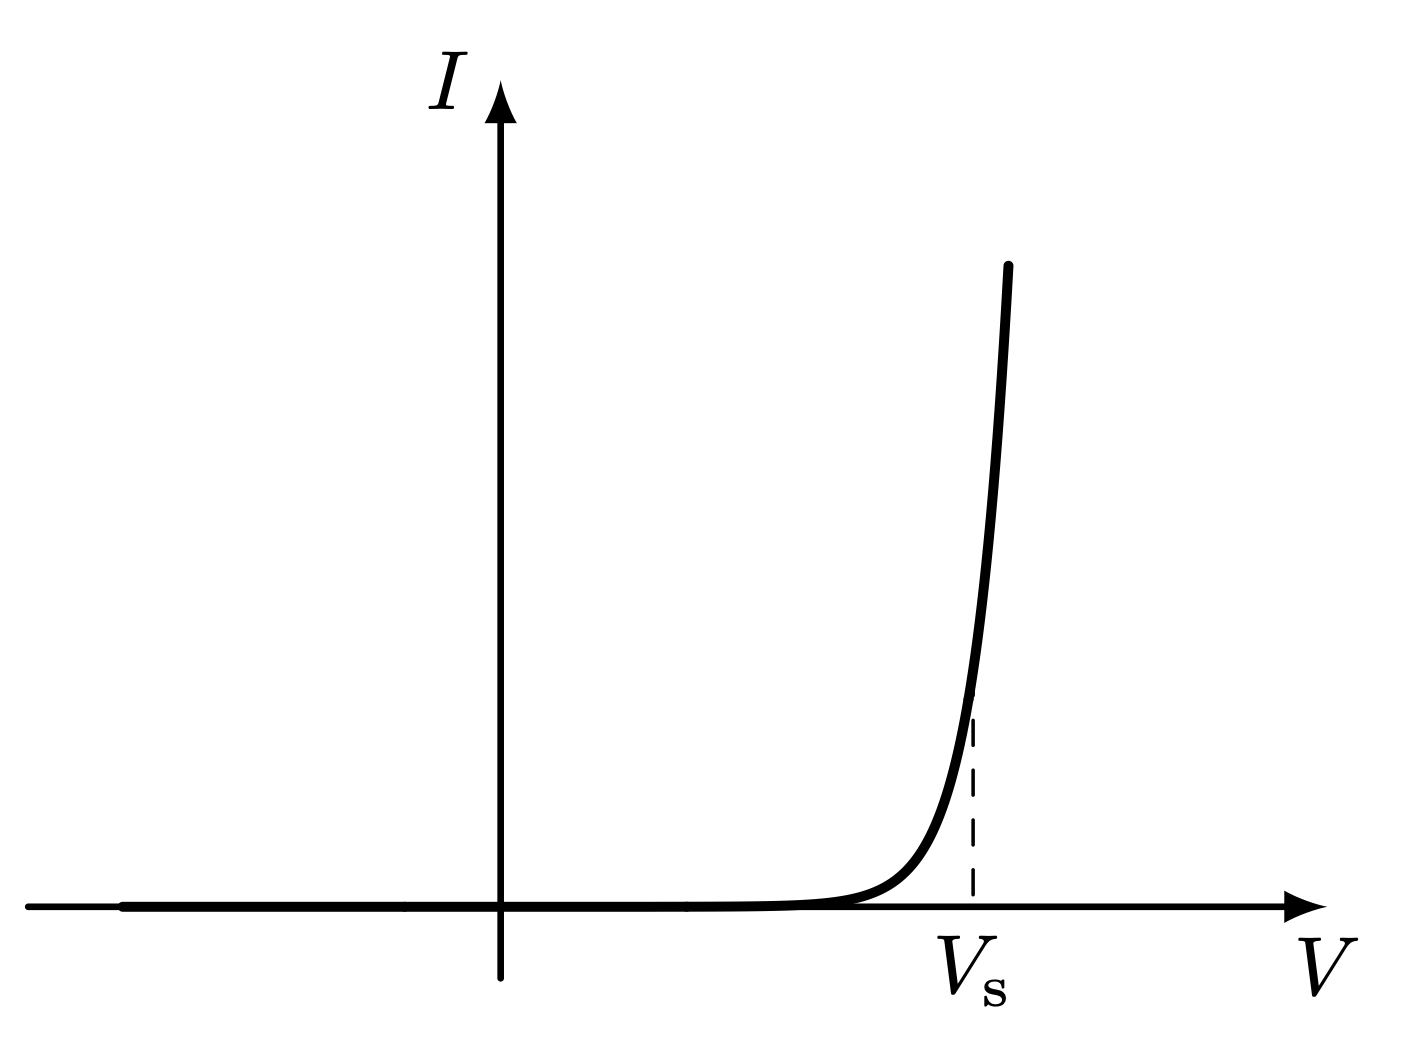
		\draw[thick, -latex] (-2,0) -- (3.5,0) node[below] {$V$};
		\draw[thick, -latex] (0,-2ex) -- (0,3.5) node[left] {$I$};

		% Plot Function
		\draw[domain=-12:0.5, samples=400, variable=\x, very thick] plot ({0.3*\x+2},{e^(\x*2)});
		\draw[dashed, line width=0.15mm] (2,1) -- (2,0) node[below] {$V_\text{s}$};
	\end{tikzpicture}

\end{document}


