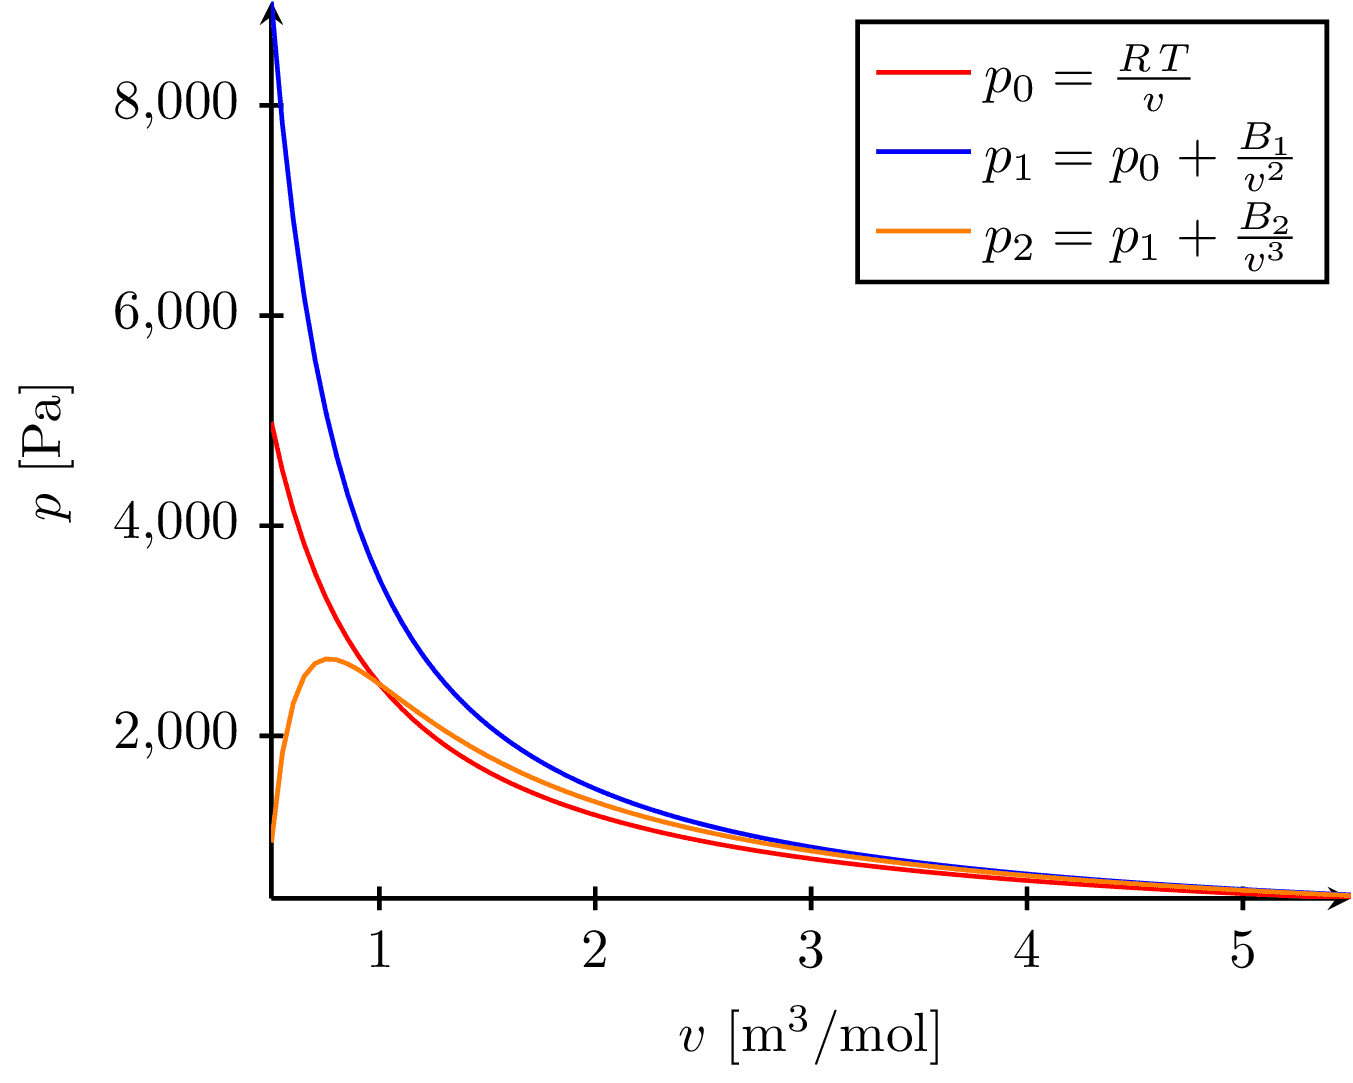
Edit and compile if you like:
\documentclass{standalone}
\usepackage{pgfplots}
\pgfplotsset{compat=newest}

\begin{document}
\begin{tikzpicture}
  \begin{axis}[
      axis lines=middle,
      xtick=\empty,
      ytick=\empty,
      ylabel=$\log\vec x$,
      xlabel=$\vec x$,
      xmin=0,
      ymin=-1,
      thick,
      decoration={name=none},
    ]
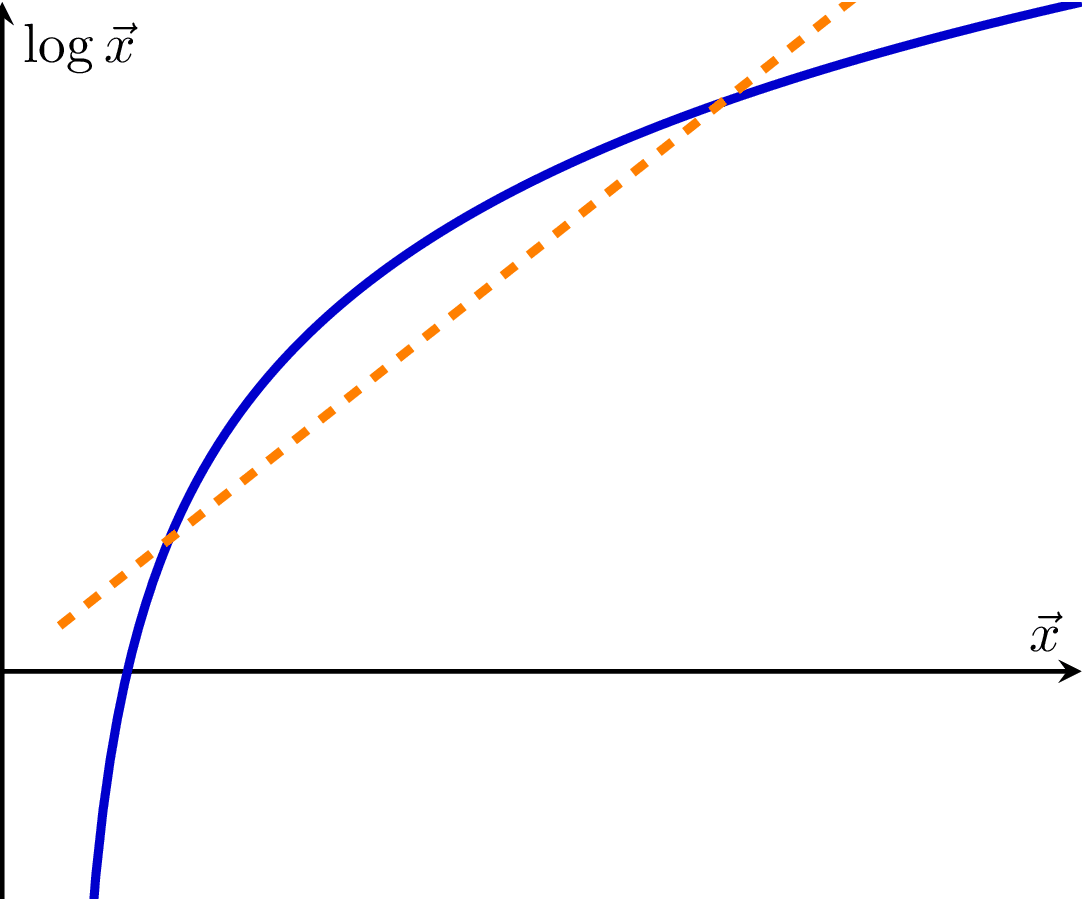
    \addplot[no marks,blue!80!black,ultra thick,samples=150,domain=1:150] {ln(x-10)-2};
    \draw[orange,dashed,ultra thick] (axis cs:8, 0.2) -- (axis cs:120, 3);
  \end{axis}
\end{tikzpicture}
\end{document}
Click to download: jensens-inequality.tex
Open in Overleaf: jensens-inequality.tex
This file is available on tikz.netlify.app and on GitHub and is MIT licensed.
See more on the author page of Janosh Riebesell..


