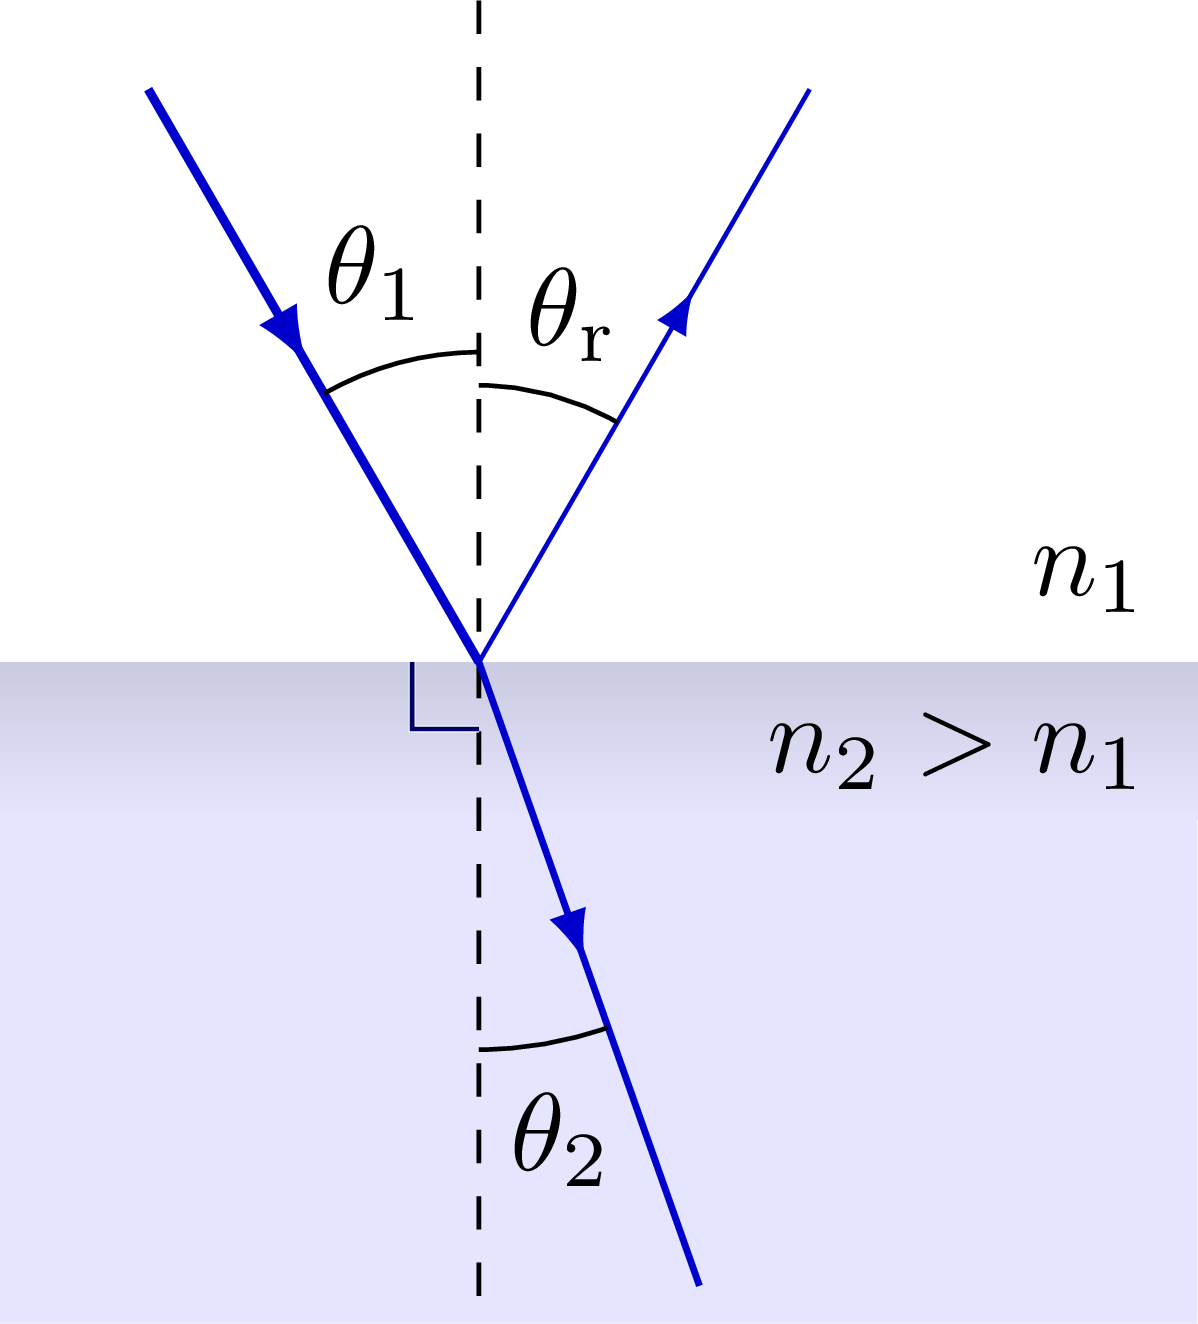
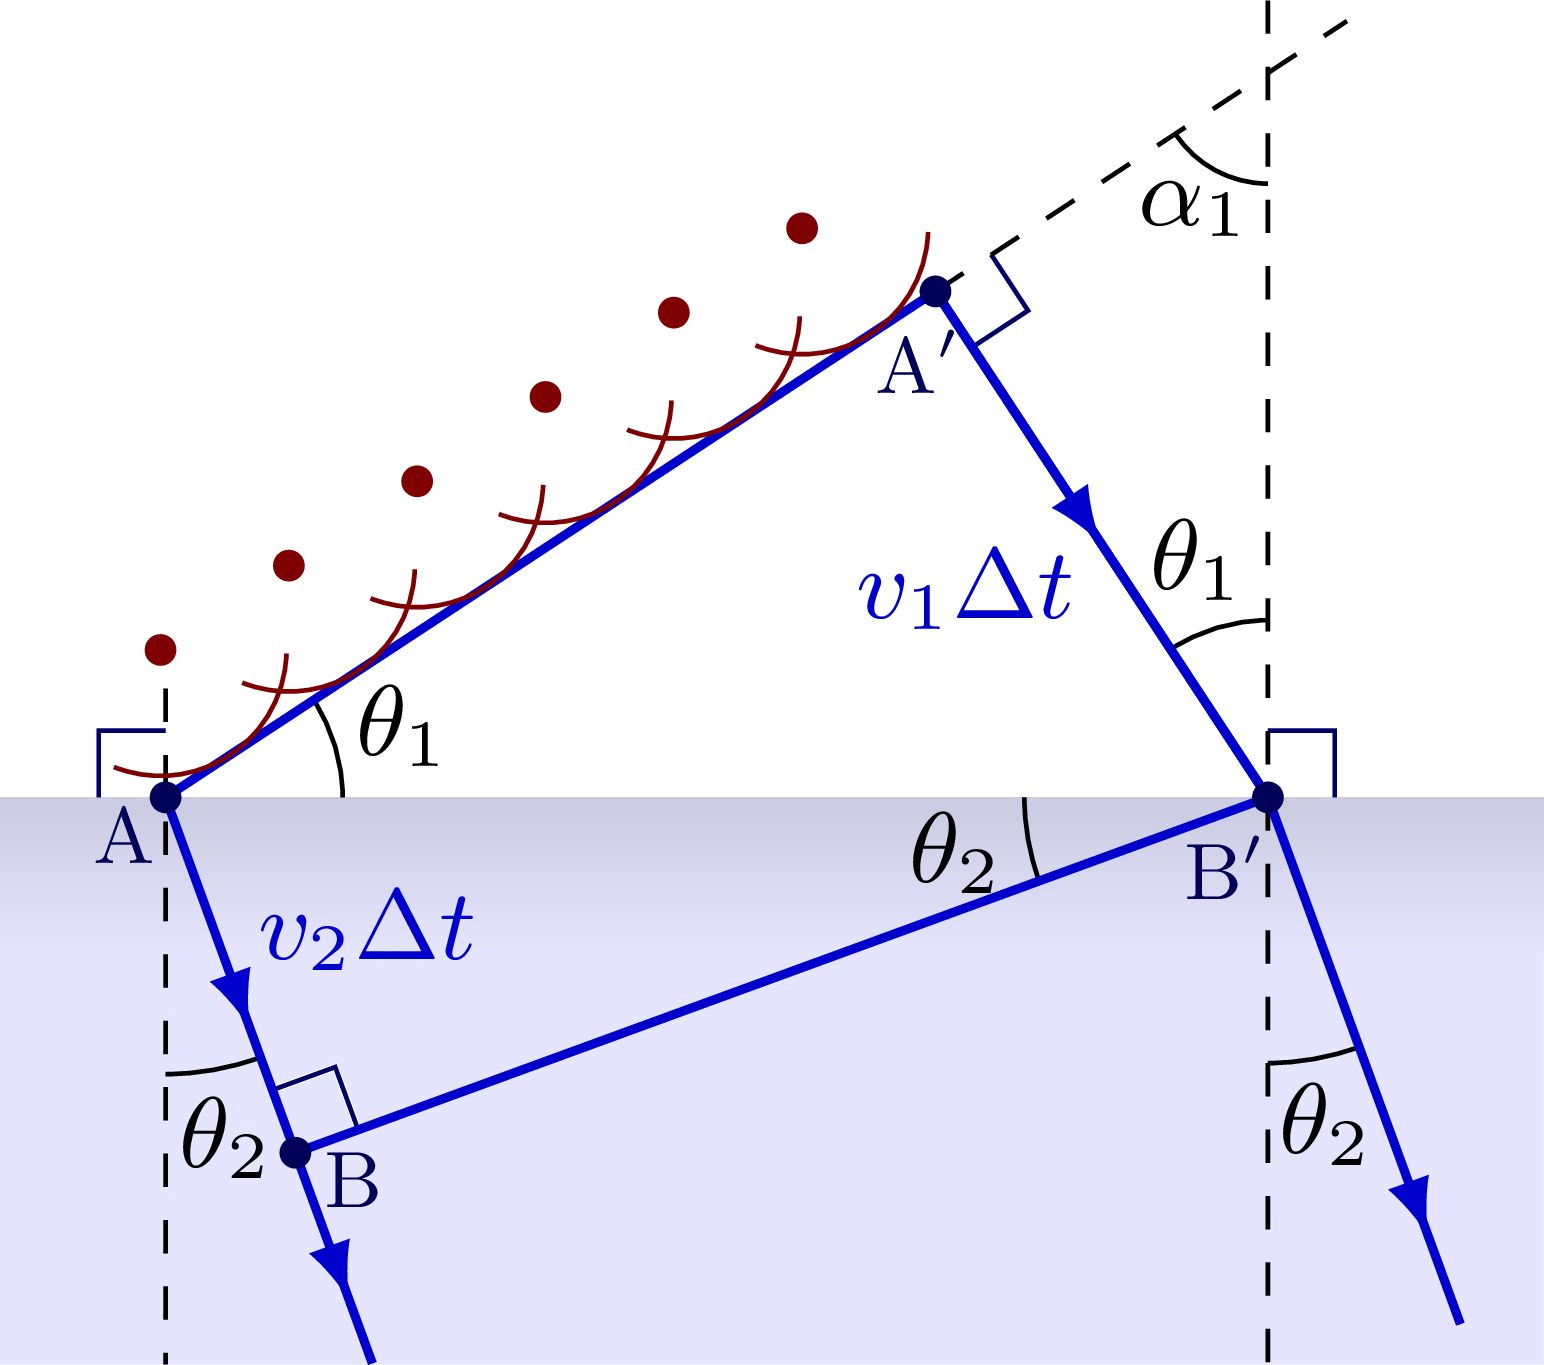
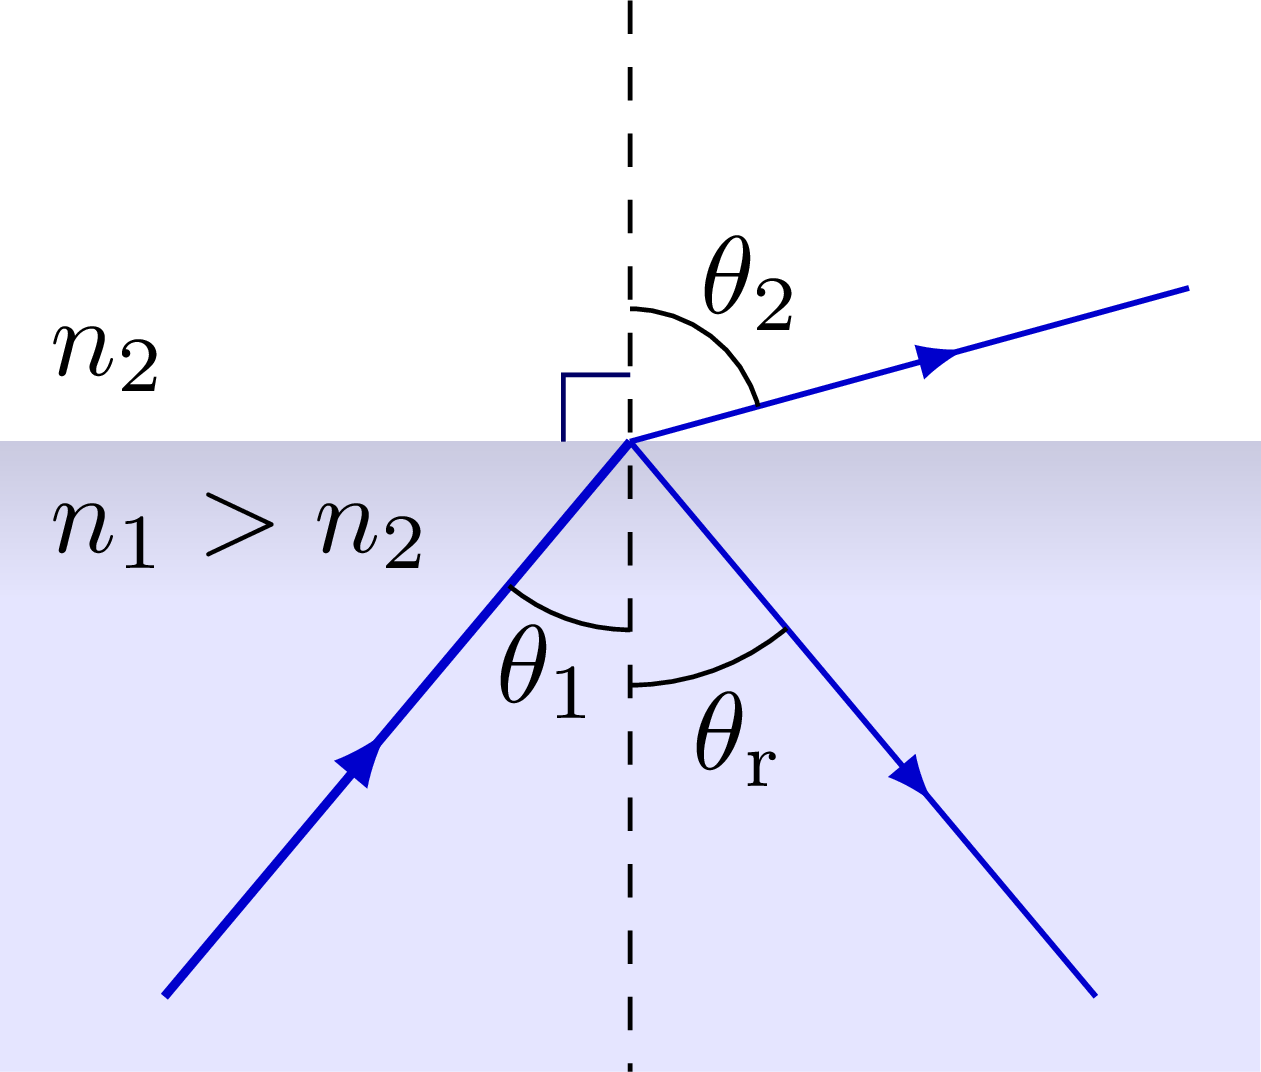
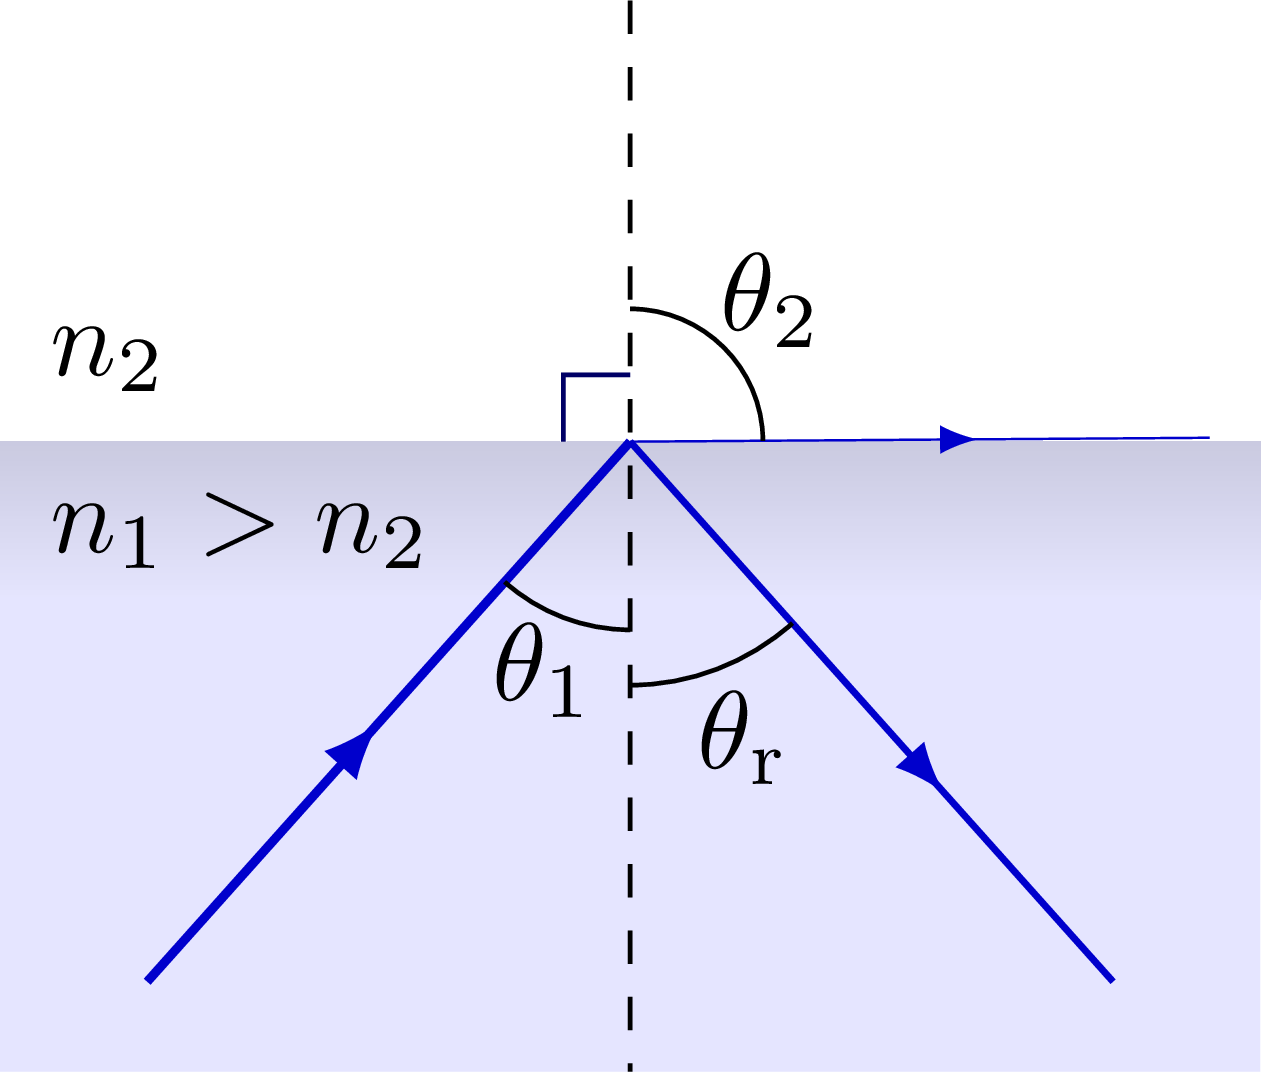
")


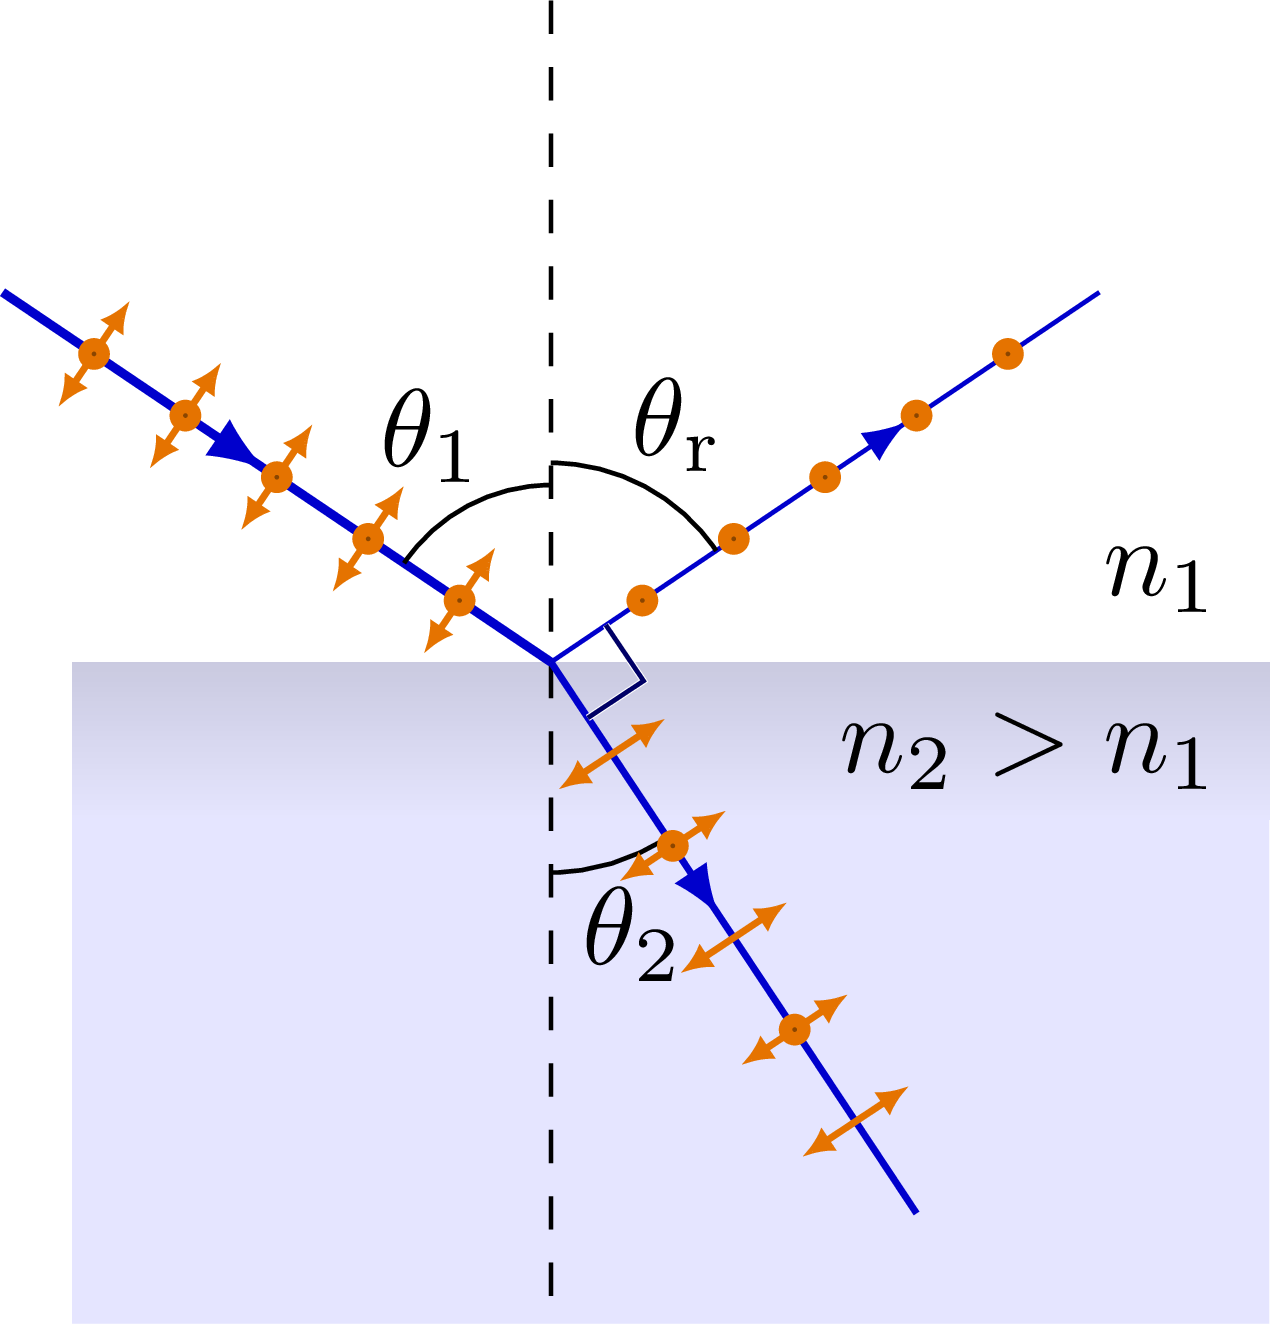
Refraction of incident light, the explanation with wavelets from the Huygens-Fresnel principle, internal reflection, polarization by reflection.
For more related figures, please see the Optics category.
Edit and compile if you like:
% Author: Izaak Neutelings (May 2020)
% Inspiration: https://tex.stackexchange.com/questions/285578/how-to-draw-parallelepiped-and-cube-with-latex/288101#288101
\documentclass[border=3pt,tikz]{standalone}
\usetikzlibrary{arrows,arrows.meta}
\usetikzlibrary{calc}
\usetikzlibrary{decorations.markings}
\usetikzlibrary{angles,quotes} % for pic (angle labels)
%\usepackage{tkz-euclide} % for \tkzMarkRightAngle
%\usetkzobj{all}
\tikzset{>=latex} % for LaTeX arrow head
\colorlet{myblue}{blue!80!black}
\colorlet{mydarkblue}{blue!35!black}
\colorlet{myred}{black!50!red}
\colorlet{glasscol}{blue!10}
\colorlet{Ecol}{orange!90!black}
\tikzstyle{myarr}=[-{Latex[length=3,width=2]}]
\tikzstyle{Evec}=[Ecol,{Latex[length=2.8,width=2.5]}-{Latex[length=2.8,width=2.5]},line width=0.6]
\tikzstyle{glass}=[top color=glasscol!88!black,bottom color=glasscol,shading angle=0]
%\tikzstyle{glass}=[top color=glasscol!88!black,bottom color=glasscol,middle color=glasscol!98!black,shading angle=0]
\tikzset{
light beam/.style={thick,myblue,decoration={markings,
mark=at position #1 with {\arrow{latex}}},
postaction={decorate}},
light beam/.default=0.5}
\newcommand\rightAngle[4]{
\pgfmathanglebetweenpoints{\pgfpointanchor{#2}{center}}{\pgfpointanchor{#3}{center}}
\coordinate (tmpRA) at ($(#2)+(\pgfmathresult+45:#4)$);
\draw[white,line width=0.6] ($(#2)!(tmpRA)!(#1)$) -- (tmpRA) -- ($(#2)!(tmpRA)!(#3)$);
\draw[blue!40!black] ($(#2)!(tmpRA)!(#1)$) -- (tmpRA) -- ($(#2)!(tmpRA)!(#3)$);
}
% WAVEFRONT
\def\p{0.03}
\def\r{0.25}
\tikzset{
wavefront/.pic={
\tikzset{/wavefront/.cd,#1}
\fill (0,0) circle (\p);
\draw (\wang:\r) arc(\wang:-\wang:\r);
}
/wavefront/.search also={/tikz},
/wavefront/.cd,
ang/.store in=\wang, ang={60},
}
\begin{document}
% REFLECTION & REFRACTION
\begin{tikzpicture}
\def\L{3.8} % width interface
\def\l{2.1} % length ray
\def\t{0.5} % depth glass gradient
\def\h{2.1} % bisector height
\def\f{0.4} % fraction of interface to the left
\def\na{1.0} % air
\def\ng{1.5} % glass
\def\anga{30} % angle of incident ray
\def\angg{asin(\na/\ng*sin(\anga))}
\coordinate (O) at (0,0); % point of contact
\coordinate (I) at (90+\anga:\l); % point incident (top left)
\coordinate (M) at (90-\anga:\l); % point reflected (top right)
\coordinate (F) at ({-90+\angg}:\l); % point refracted (bottom)
\coordinate (L) at (-\f*\L,0); % left point interface
\coordinate (R) at ({(1-\f)*\L},0); % right point interface
\coordinate (T) at (0,\h); % top middle point (bisector)
\coordinate (B) at (0,-1.0*\h); % bottom middle point (bisector)
% MEDIUM
\fill[glass] (L) rectangle++ (\L,-\t); % glass gradient
\fill[glasscol] (-\f*\L,-0.99*\t) rectangle ({1-\f)*\L},-\h); % glass bulk
%\fill[glass] (L) rectangle (\L/2,-\h);
\node[above left=1] at (R) {$n_1$};
\node[below left=1] at (R) {$n_2>n_1$};
% LINES
\draw[dashed] (T) -- (B); % bisector
\draw[light beam={0.48}] (I) -- (O); % incoming ray
\draw[light beam={0.65},line width=0.4] (O) -- (M); % reflected ray
\draw[light beam={0.48},line width=0.6] (O) -- (F); % refracted ray
% ANGLES
\draw pic["$\theta_1$",draw=black,angle radius=28,angle eccentricity=1.3] {angle = T--O--I}; %\contour{white}{
\draw pic["$\theta_\mathrm{r}$",draw=black,angle radius=25,angle eccentricity=1.3] {angle = M--O--T};
\draw pic["$\theta_2$",draw=black,angle radius=35,angle eccentricity=1.25] {angle = B--O--F};
\rightAngle{B}{O}{L}{0.3}
\end{tikzpicture}
% REFRACTION: Hughens' principle
\begin{tikzpicture}
\small
\def\N{6} % number of wavefronts
\def\r{0.4} % wavefront radius
\def\w{3.5} % width
\def\h{2.3} % height
\def\d{1.8} % depth
\def\t{0.5} % thickness
\def\l{1.78} % length light beam
\def\p{0.05} % point size
\def\ang{atan(\h/\w)}
\def\ymin{-0.15*\w}
\def\ymax{ 1.25*\w}
\def\na{1.0} % air
\def\ng{1.6} % glass
\def\anga{20}
\def\angg{asin(\na/\ng*\h/sqrt(\h^2+\w^2))}
\def\sangg{\na/\ng*\h/sqrt(\h^2+\w^2)}
\coordinate (O) at (0,0);
\coordinate (WR) at (\w,0);
\coordinate (WT) at (\w,\h);
\coordinate (L) at (\ymin,0);
\coordinate (R) at (\ymax,0);
\coordinate (T) at (\w, 1.10*\h);
\coordinate (B) at (\w,-\d);
\coordinate (BL) at (0,-\d);
\coordinate (TL) at (0,0.15*\h);
\coordinate (P) at ($(WT)!(WR)!(O)$);
\coordinate (F) at ({\w+\l*cos(-90+\angg)},{\l*sin(-90+\angg)});
\coordinate (VT) at ({\w*\sangg*\sangg},{-\w*\sangg*cos(\angg)});
%\coordinate (VI) at ({\w+\l*cos(180+\angg)},{\l*sin(180+\angg)});
% MEDIUM
\fill[glass] (L) rectangle (\ymax,-\t);
\fill[glasscol] (\ymin,-0.99*\t) rectangle (\ymax,-\d);
% ANGLE
\rightAngle{WT}{WR}{R}{0.3}
\rightAngle{WT}{P}{WR}{0.3}
\rightAngle{O}{VT}{WR}{0.3}
\rightAngle{L}{O}{TL}{0.3}
\draw pic["$\theta_1$",draw=black,angle radius=16,angle eccentricity=1.4] {angle = R--O--WT};
\draw pic["$\theta_1$",draw=black,angle radius=16,angle eccentricity=1.4] {angle = WT--WR--P};
\draw pic["$\theta_2$",draw=black,angle radius=24,angle eccentricity=1.25] {angle = B--WR--F};
\draw pic["$\alpha_1$",draw=black,angle radius=10,angle eccentricity=1.4] {angle = O--WT--WR};
\draw pic["$\theta_2$",draw=black,angle radius=22,angle eccentricity=1.3] {angle = L--WR--VT};
\draw pic["$\theta_2$",draw=black,angle radius=25,angle eccentricity=1.25] {angle = BL--O--VT};
% LINES
\draw[dashed] (TL) -- (BL);
\draw[dashed] (T) -- (B);
\draw[dashed] (P) -- (WT) --++ ({\ang}:0.3);
\draw[light beam={0.65}] (O) -- (VT) node[midway,above=4,right=-1] {$v_2 \Delta t$};
\draw[light beam={0.70}] (VT) --++ ({\angg-90}:0.4*\l);
\draw[] (P) -- (WR) -- (F);
\draw[light beam={0.50}] (P) -- (WR) node[midway,above=2,below left=-1] {$v_1 \Delta t$};
\draw[light beam={0.92}] (P) -- (WR) -- (F);
%\draw[] (WT) -- (WR);
\draw[myblue,thick] (O) -- (P);
\draw[myblue,thick] (VT) -- (WR);
\fill[mydarkblue] (O) circle (\p) node[scale=0.8,below left=-2] {A};
\fill[mydarkblue] (P) circle (\p) node[scale=0.8,left=2,below=1] {A$'$};
\fill[mydarkblue] (VT) circle (\p) node[scale=0.8,below=3,right=0] {B};
\fill[mydarkblue] (WR) circle (\p) node[scale=0.8,right=4,below left=1] {B$'$};
% WAVE FRONTS
% \foreach \i [evaluate={\x=-\r*sin(\ang)+\i*\w/(\N+1);
% \y=\r*cos(\ang)+\i*\h/(\N+1);}] in {1,...,\N}{
% \pic[myred,rotate=\ang-90] at (\x,\y) {wavefront={ang={55}}};
% }
\foreach \i [evaluate={\f=(\i-0.5)/\N;}] in {1,...,\N}{
\pic[myred,rotate=\ang-90] at ($(O)!\f!(P)+({\ang+90}:\r)$) {wavefront={ang={55}}};
}
\end{tikzpicture}
% INTERNAL REFLECTION: almost
\begin{tikzpicture}
\def\L{4.0}
\def\l{2.3}
\def\t{0.5}
\def\h{2.0}
\def\f{0.5}
\def\na{1.0} % air
\def\ng{1.5} % glass
\def\angg{40} % asin(1/1.5)*180/pi
\def\anga{asin(\ng/\na*sin(\angg))}
\coordinate (O) at (0,0);
\coordinate (I) at (-90-\angg:\l);
\coordinate (M) at (-90+\angg:\l);
\coordinate (F) at ({90-\anga}:0.8*\l);
\coordinate (L) at (-\f*\L,0);
\coordinate (R) at ({(1-\f)*\L},0);
\coordinate (T) at (0,0.7*\h);
\coordinate (B) at (0,-\h);
% MEDIUM
\fill[glass] (L) rectangle++ (\L,-\t); % glass gradient
\fill[glasscol] (-\f*\L,-0.99*\t) rectangle ({1-\f)*\L},-\h);
%\fill[glass] (L) rectangle (\L/2,-\h);
\node[above right=1] at (L) {$n_2$};
\node[below right=1] at (L) {$n_1>n_2$};
% LINES
\draw[dashed] (T) -- (B);
\draw[light beam={0.48}] (I) -- (O);
\draw[light beam={0.65},line width=0.5] (O) -- (M);
\draw[light beam={0.60},line width=0.5] (O) -- (F);
% ANGLES
\draw pic["$\theta_1$",draw=black,angle radius=17,angle eccentricity=1.3] {angle = I--O--B}; %\contour{white}{
\draw pic["$\theta_\mathrm{r}$",draw=black,angle radius=22,angle eccentricity=1.3] {angle = B--O--M};
\draw pic["$\theta_2$",draw=black,angle radius=12,angle eccentricity=1.5] {angle = F--O--T};
\rightAngle{L}{O}{T}{0.3}
\end{tikzpicture}
% INTERNAL REFLECTION: critical
\begin{tikzpicture}
\def\L{4.0}
\def\l{2.3}
\def\t{0.5}
\def\h{2.0}
\def\f{0.5}
\def\na{1.0} % air
\def\ng{1.5} % glass
\def\angg{41.804} % asin(1/1.5)*180/pi
\def\anga{asin(\ng/\na*sin(\angg))}
\coordinate (O) at (0,0);
\coordinate (I) at (-90-\angg:\l);
\coordinate (M) at (-90+\angg:\l);
\coordinate (F) at ({90-\anga}:0.8*\l);
\coordinate (L) at (-\f*\L,0);
\coordinate (R) at ({(1-\f)*\L},0);
\coordinate (T) at (0,0.7*\h);
\coordinate (B) at (0,-\h);
% MEDIUM
\fill[glass] (L) rectangle++ (\L,-\t);
\fill[glasscol] (-\f*\L,-0.99*\t) rectangle ({1-\f)*\L},-\h);
%\fill[glass] (L) rectangle (\L/2,-\h);
\node[above right=1] at (L) {$n_2$};
\node[below right=1] at (L) {$n_1>n_2$};
% LINES
\draw[dashed] (T) -- (B);
\draw[light beam={0.48}] (I) -- (O);
\draw[light beam={0.65},line width=0.6] (O) -- (M);
\draw[light beam={0.60},line width=0.2] (O) -- (F);
% ANGLES
\draw pic["$\theta_1$",draw=black,angle radius=17,angle eccentricity=1.3] {angle = I--O--B}; %\contour{white}{
\draw pic["$\theta_\mathrm{r}$",draw=black,angle radius=22,angle eccentricity=1.3] {angle = B--O--M};
\draw pic["$\theta_2$",draw=black,angle radius=12,angle eccentricity=1.5] {angle = F--O--T};
\rightAngle{L}{O}{T}{0.3}
\end{tikzpicture}
% BREWSTER/POLARIZATION ANGLE
\begin{tikzpicture}
\def\A{0.2}
\def\L{3.8}
\def\l{2.1}
\def\t{0.5}
\def\h{2.1}
\def\f{0.4}
\def\na{1.0} % air
\def\ng{1.5} % glass
\def\anga{56} % atan(1.5)*180/pi
\def\angg{asin(\na/\ng*sin(\anga))}
\def\N{5}
\coordinate (O) at (0,0);
\coordinate (I) at (90+\anga:\l);
\coordinate (M) at (90-\anga:\l);
\coordinate (F) at ({-90+\angg}:\l);
\coordinate (L) at (-\f*\L,0);
\coordinate (R) at ({(1-\f)*\L},0);
\coordinate (T) at (0,\h);
\coordinate (B) at (0,-1.0*\h);
\def\dot#1{
\fill[Ecol] (#1) circle (0.05);
\fill[Ecol!60!black] (#1) circle (0.007);
%\draw[Ecol!70!black,line width=0.05] (90+\anga:\t) circle (0.03);
}
% MEDIUM
\fill[glass] (L) rectangle++ (\L,-\t);
\fill[glasscol] (-\f*\L,-0.99*\t) rectangle ({1-\f)*\L},-\h);
%\fill[glass] (L) rectangle (\L/2,-\h);
\node[above left=1] at (R) {$n_1$};
\node[below left=1] at (R) {$n_2>n_1$};
% LINES
\draw[dashed] (T) -- (B);
\draw[light beam={0.48}] (I) -- (O);
\draw[light beam={0.65},line width=0.4] (O) -- (M);
\draw[light beam={0.46},line width=0.6] (O) -- (F);
% ANGLES
\draw pic["$\theta_1$",draw=black,angle radius=16,angle eccentricity=1.45] {angle = T--O--I}; %\contour{white}{
\draw pic["$\theta_\mathrm{r}$",draw=black,angle radius=18,angle eccentricity=1.35] {angle = M--O--T};
\draw pic["$\theta_2$",draw=black,angle radius=19,angle eccentricity=1.35] {angle = B--O--F};
\rightAngle{M}{O}{F}{0.3}
% VECTORS
\foreach \i [evaluate={\t=\i*\l/(\N+1);}] in {1,...,\N}{
\draw[Evec] (90+\anga:\t)++(\anga+180:\A) --++ (\anga:2*\A); % incident
\dot{90+\anga:\t} % incident
%\draw[Evec] (90-\anga:\t)++(180-\anga:\A) --++ (-\anga:2*\A); % reflected
%\dot{{-90+\angg}:\t} % refracted
\draw[Evec] ({-90+\angg}:\t)++({-180+\angg}:\A) --++ ({\angg}:2*\A); % reflected
\dot{{90-\anga}:\t} % refracted
}
\dot{{-90+\angg}:{\l*2/(\N+1)}} % refracted
\dot{{-90+\angg}:{\l*4/(\N+1)}} % refracted
\end{tikzpicture}
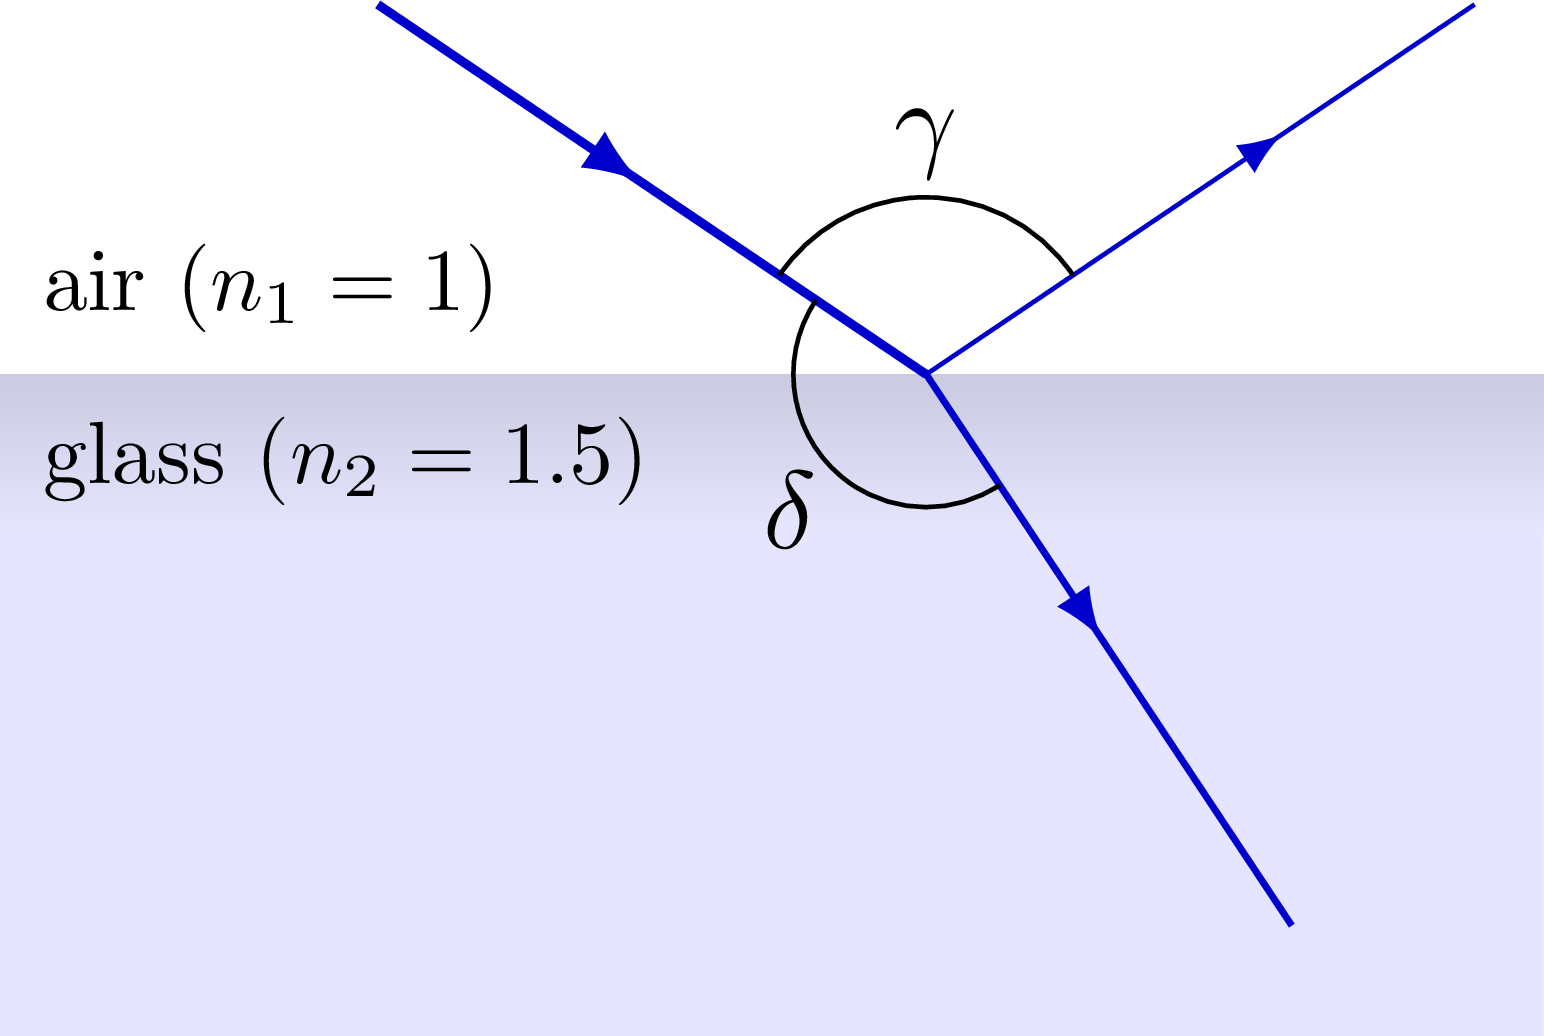
% REFLECTION & REFRACTION - Brewster angle
\begin{tikzpicture}
\def\L{4.9} % width interface
\def\l{2.1} % length ray
\def\t{0.5} % depth glass gradient
\def\h{2.1} % bisector height
\def\f{0.6} % fraction of interface to the left
\def\na{1.0} % air
\def\ng{1.5} % glass
\def\anga{56} % angle of incident ray
\def\angg{asin(\na/\ng*sin(\anga))}
\coordinate (O) at (0,0); % point of contact
\coordinate (I) at (90+\anga:\l); % point incident (top left)
\coordinate (M) at (90-\anga:\l); % point reflected (top right)
\coordinate (F) at ({-90+\angg}:\l); % point refracted (bottom)
\coordinate (L) at (-\f*\L,0); % left point interface
\coordinate (R) at ({(1-\f)*\L},0); % right point interface
\coordinate (T) at (0,\h); % top middle point (bisector)
\coordinate (B) at (0,-1.0*\h); % bottom middle point (bisector)
% MEDIUM
\fill[glass] (L) rectangle++ (\L,-\t); % glass gradient
\fill[glasscol] (-\f*\L,-0.99*\t) rectangle ({1-\f)*\L},-\h); % glass bulk
\node[above right=1,scale=0.8] at (L) {air ($n_1=1$)};
\node[below right=1,scale=0.8] at (L) {glass ($n_2=1.5$)};
% LINES
%\draw[dashed] (T) -- (B); % bisector
\draw[light beam={0.48}] (I) -- (O); % incoming ray
\draw[light beam={0.65},line width=0.4] (O) -- (M); % reflected ray
\draw[light beam={0.48},line width=0.6] (O) -- (F); % refracted ray
% ANGLES
\draw pic["$\gamma$",draw=black,angle radius=16,angle eccentricity=1.30] {angle = M--O--I};
\draw pic["$\delta$",draw=black,angle radius=12,angle eccentricity=1.45] {angle = I--O--F};
\end{tikzpicture}
\end{document}Click to download: optics_refractions.tex • optics_refractions.pdf
Open in Overleaf: optics_refractions.tex


Hello!
I modified a code I found here to show how an image is formed in a convex lens (see code below). I was wondering if there would be a way to further modify it, so that by changing the position of the object (at 2f, between 2f and f, at f and within f, it would automatically change the rays and image. My skills are not that great yet! hehehe
Thank you,
Wagner.
\documentclass[border=2pt]{standalone}
%Drawing
\usepackage{tikz}
\tikzset{>=latex}
\usetikzlibrary{calc, decorations.markings}
%Styles
%%Arrow in the Middle
\tikzset{arrow inside/.style = {postaction=decorate,decoration={markings,mark=at position 0.52 with \arrow{stealth}}}}
%Newcommand
%%Midline Label
\newcommand{\midlinelabel}[3]{
\node (midlabel) at ($ (#1)!.5!(#2) $) {#3};
\draw[] (midlabel) — (#2);
}
% Define Color
\definecolor{glass}{cmyk}{0.2,0,0,0}
\begin{document}
\begin{tikzpicture}[scale=1.8]
% Grid
% \draw[help lines] (-3,-3) grid (6,6);
% Lens
\path[fill=glass, draw=black, line width = 0.6] (1,-2) .. controls (0.8,0) .. (1,2) .. controls (1.2,0) .. (1,-2);
% Axis
\draw[dashed, black!60] (1,-2) — +(0,4);
\draw[black!60] (-4,0) — (6,0) node[below]{\small Principal Axis};
% Points
\draw[fill=red] (-2,0) circle (0.5pt) node[below] {$2f$};
\draw[fill=red] (-0.5,0) circle (0.5pt) node[below] {$f$};
\draw[fill=magenta] (1,0) circle (0.5pt) node[below] {$C$};
\draw[fill=red] (2.5,0) circle (0.5pt) node[below] {$f$};
\draw[fill=red] (4,0) circle (0.5pt) node[below] {$2f$};
%Rays
%%1
\draw[red, line width = 0.6, arrow inside] (-3.,1.2) — (1,0);
%\draw[red, line width = 0.6] (0.88,0.7) — (1.12,0.67);
\draw[red, line width = 0.6, arrow inside] (1,0) — (5,-1.2);
%%2
\draw[red, line width = 0.6, arrow inside] (-3.,1.2) — (0.92,1.2);
\draw[red, line width = 0.6] (0.92,1.2) — (1.09,1.13);
\draw[red, line width = 0.6, arrow inside] (1.09,1.13) — (4.5,-1.6);
%%3
\draw[red, line width = 0.6, arrow inside] (-3.,1.2) — (0.875,-0.658);
\draw[red, line width = 0.6] (0.875,-0.658) — (1.11,-0.72);
\draw[red, line width = 0.6, arrow inside] (1.11,-0.72) — (4.5,-0.72);
% Distances
%\midlinelabel{-2,-0.75}{1,-0.75}{$\alpha$}
\midlinelabel{1,0.1}{2.5,0.1}{$F$}
%\midlinelabel{1,0}{1,1.18}{\small$h$}
%\midlinelabel{1,1.18}{2,1.18}{\small$\beta(h)$}
% Dashed
%\draw[dashed] (2,0) — (2,1.18);
%Object and Image
\draw[->, thick, blue] (-3,0) node[below]{\small $Object$} –++ (0,1.2);
\draw[->, thick, cyan] (3.4,0) node[above]{\small $Image$} –++ (0,-0.72);
\end{tikzpicture}
\end{document}