")


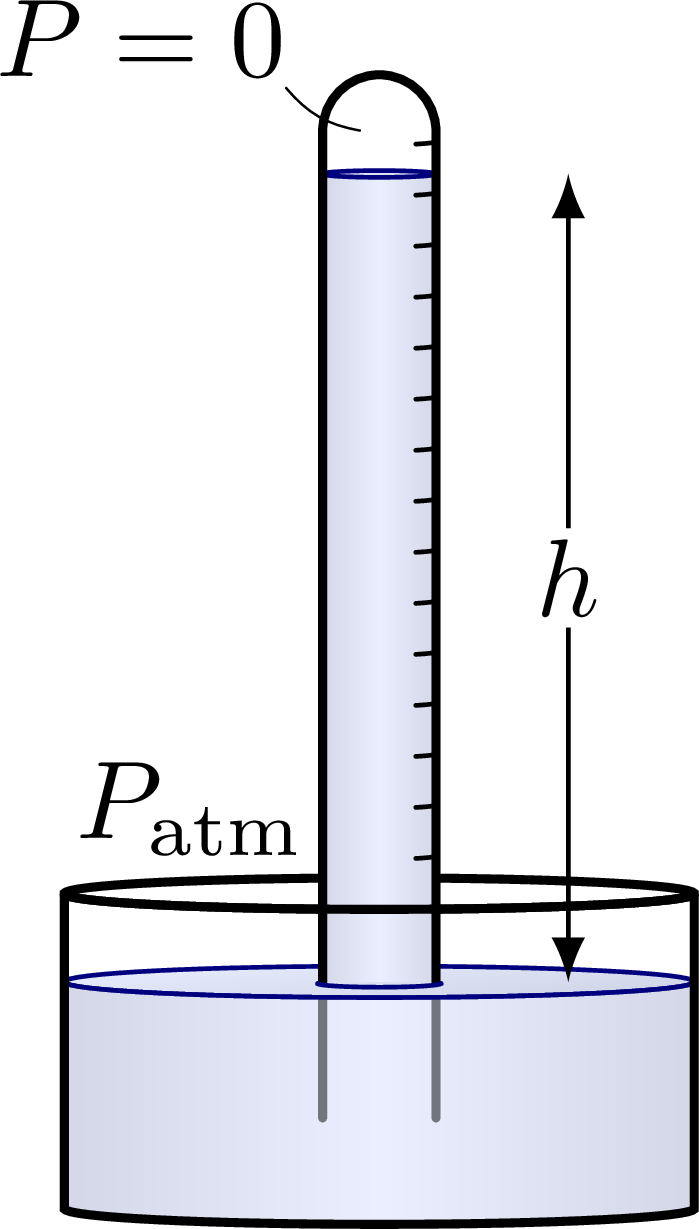
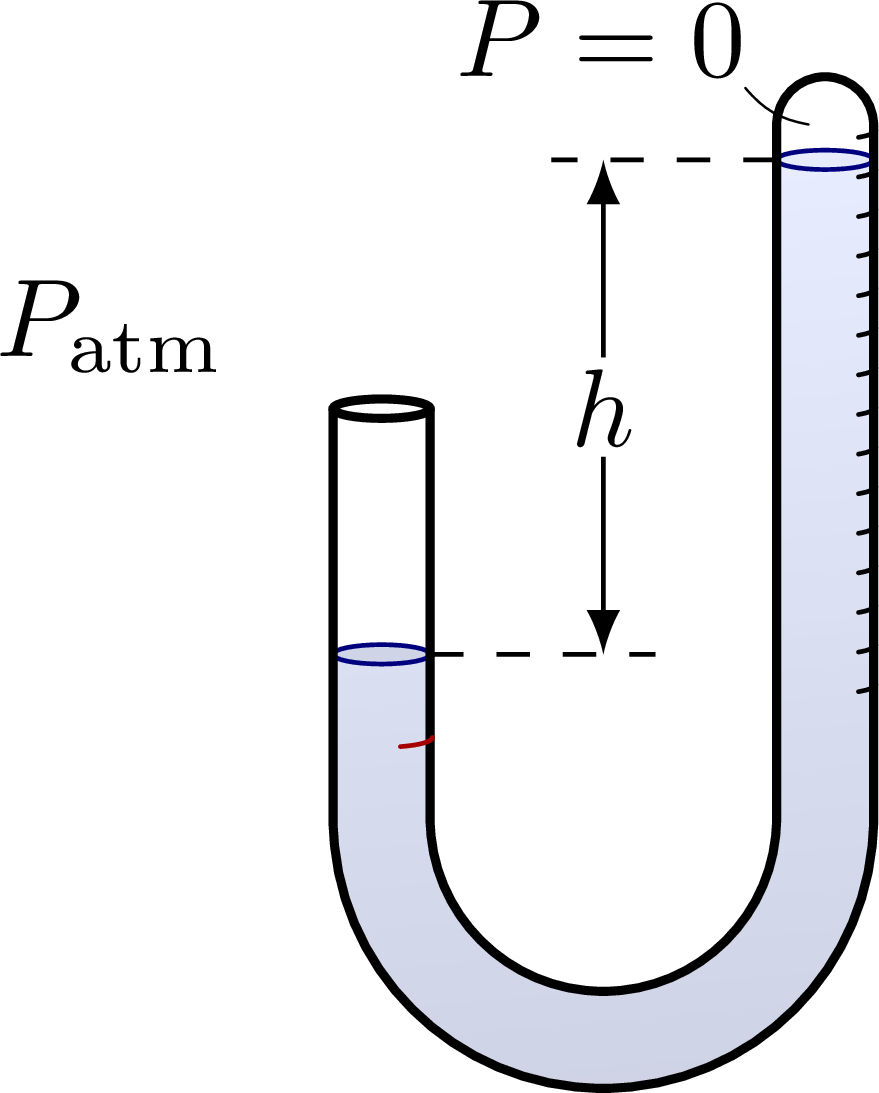
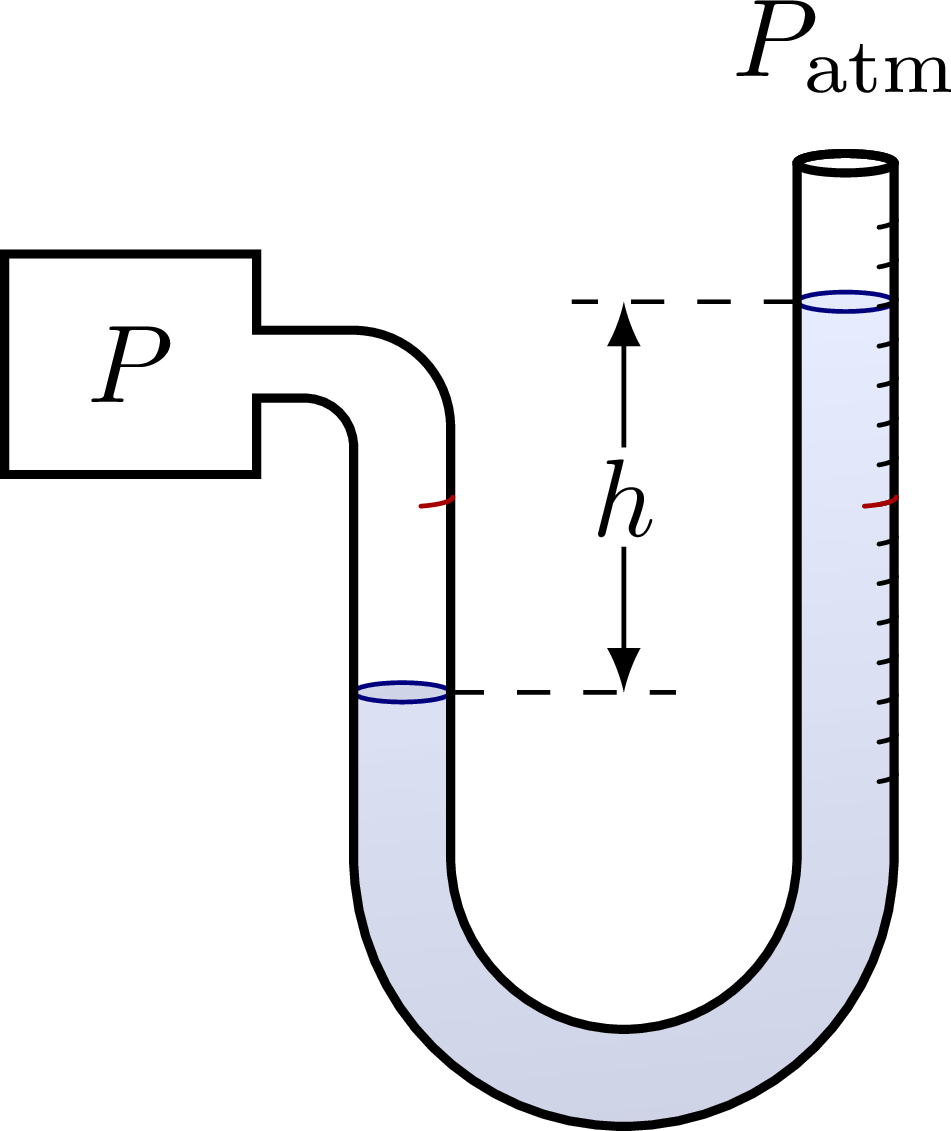
Some basic diagrams to explain pressure with a Torricelli’s experiment creating vacuum (P = 0), a barometer, and a manometer.
For more related figures, please have a look at the Fluid Dynamics category.
Torricelli’s experiment with water (height h ~ 10 m), creating a vacuum inside the tube:
Barometer (open-ended tube) to measure air pressure:
Manometer (closed tube):
Edit and compile if you like:
% Author: Izaak Neutelings (November 2020)
\documentclass[border=3pt,tikz]{standalone}
\usepackage{siunitx}
\usepackage{physics}
\usepackage{tikz}
\usepackage[outline]{contour} % glow around text
\usetikzlibrary{patterns,decorations.pathmorphing}
\usetikzlibrary{arrows.meta}
\tikzset{>=latex}
\contourlength{1.1pt}

\colorlet{mydarkblue}{blue!50!black}
\colorlet{myred}{red!65!black}
\colorlet{watercol}{blue!80!cyan!10!white}
\colorlet{darkwatercol}{blue!80!cyan!20!white}
\tikzstyle{piston}=[blue!50!black,top color=blue!30,bottom color=blue!50,middle color=blue!20,shading angle=0]
\tikzstyle{water}=[draw=mydarkblue,top color=watercol!90,bottom color=watercol!90!black,shading angle=5]
\tikzstyle{vertical water}=[water,
  top color=watercol!90!black!90,bottom color=watercol!90!black!90,middle color=watercol!80,shading angle=90]
\def\tick#1#2{\draw[thick] (#1)++(#2:0.1) --++ (#2-180:0.2)}

\begin{document}


% PRESSURE TORRICELLI
\begin{tikzpicture}
  \def\Rx{1.0}
  \def\Ry{0.05*\Rx}
  \def\rx{0.18*\Rx}
  \def\ry{0.06*\rx}
  \def\H{1.0}
  \def\h{0.72*\H}   % water level height
  \def\th{2.7*\H}   % tube height
  \def\ty{0.95*\th} % tube level
  \def\td{0.6*\h}   % tube depth
  \def\N{14}

  % WATER + CONTAINER
  \draw[vertical water] %rounded corners=2
    (-\Rx,\h) --++ (0,-\h) arc(180:360:{\Rx} and {\Ry}) --++ (0,\h);
  \draw[water]
    (0,\h) ellipse ({\Rx} and {\Ry});
  \draw[thick] (0,\H) ellipse ({\Rx} and {\Ry});

  % TUBE
  \draw[vertical water]
    (-\rx,\h) |-++ (2*\rx,\ty) --++ (0,-\ty);
  \draw[water]
    (0,\h+\ty) ellipse ({\rx} and {\ry});
  \draw[thick,line cap=round]
    (-\rx,\h) --++ (0,\th) coordinate (T) arc(180:0:\rx) --++ (0,-\th);
  \draw[mydarkblue,line cap=round]
    (-1.09*\rx,\h-0.005) arc(180:360:{1.09*\rx} and 1.12*\ry);
  \foreach \i [evaluate={\y=1.12*\H+0.84*\th*\i/\N}] in {0,...,\N}{
    \draw[line cap=round] (\rx,\y) arc(0:-50:{\rx} and \ry);
  }
  \begin{scope}
    \clip (-\Rx,\h) |-++ (2*\Rx,-\h) --++ (0,\h) arc(360:180:{\Rx} and {\Ry}) -- cycle;
    \draw[thick,line cap=round]
      (-\rx,\h) --++ (0,-\td) (\rx,\h) --++ (0,-\td);
      %(-\rx,\h) --++ (0,-\td) arc(180:360:{\rx} and {\ry}) --++ (0,\td);
    \draw[vertical water,opacity=0.5]
      (-\Rx,\h) --++ (0,-\h) arc(180:360:{\Rx} and {\Ry}) --++ (0,\h);
  \end{scope}
  \draw[mydarkblue]
    (-\Rx,\h) arc(180:360:{\Rx} and {\Ry});
  \draw[<->] (0.6*\Rx,\h) --++ (0,\ty) node[midway,fill=white,inner sep=1] {$h$};
  \draw[very thin,line cap=round]
    (T)++(130:\rx) node[anchor=-19,inner sep=1] {$P=0$} to[out=-50,in=170]++ (-30:1.5*\rx);
  \node[above] at (-0.6*\Rx,\H) {$P_\mathrm{atm}$};

  % CONTAINER
  \draw[thick]
    (-\Rx,\H) --++ (0,-\H) arc(180:360:{\Rx} and {\Ry})
              --++ (0,\H) arc(360:180:{\Rx} and {\Ry}) -- cycle;

\end{tikzpicture}


% OPEN MANOMETER
\begin{tikzpicture}
  \def\W{0.8}       % pressure box height
  \def\H{0.7}       % pressure box height
  \def\Rx{0.55}     % tube bend radius horizontal
  \def\Ry{0.2*\Rx}  % tube bend radius vertical
  \def\rx{0.28*\Rx} % tube radius horizontal
  \def\ry{0.28*\Ry} % tube radius vertical
  \def\HL{1.3}      % tube height left
  \def\HR{2.2}      % stube height right
  \def\hL{0.40*\HL} % water level height left
  \def\hR{0.95*\HR} % water level height right
  %\def\th{2.7*\H}   % tube height
  %\def\ty{0.93*\th} % tube level
  \def\N{14}

  % WATER + CONTAINER
  \draw[water]
    (-\Rx,\hL) --++ (0,-\hL) arc(180:360:\Rx) --++ (0,\hR) --++ (2*\rx,0) --++
    (0,-\hR) arc(360:180:\Rx+2*\rx) --++ (0,\hL);
  \draw[water]
    (-\Rx-\rx,\hL) ellipse({\rx} and {\ry})
    (\Rx+\rx,\hR) ellipse({\rx} and {\ry});
  \draw[thick]
    (-\Rx,\HL) --++ (0,-\HL) arc(180:360:\Rx) --++ (0,\HR) coordinate (T) arc(180:0:\rx)
    --++ (0,-\HR) arc(360:180:\Rx+2*\rx) --++ (0,\HL);
  \draw[thick]
    (-\Rx-\rx,\HL) ellipse({\rx} and {\ry});
  \foreach \i [evaluate={\y=(\hL+\hR)/2+0.8*\HR*(\i-\N/2)/\N;}] in {0,...,\N}{
    \draw[line cap=round] (\Rx+2*\rx+0.007,\y) arc(0:-50:{\rx} and \ry);
  }
  %\draw[line cap=round,myred] (\Rx+2*\rx+0.007,{(\hL+\hR)/2}) arc(0:-70:{\rx} and \ry);
  \draw[line cap=round,myred] (-\Rx+0.007,\hL+\hR-\HR-\rx) arc(0:-70:{\rx} and \ry);
  \node at (-\W/2-4*\rx-\Rx,\HL+1.7*\rx) {$P_\mathrm{atm}$};
  \draw[very thin,line cap=round]
    (T)++(130:\rx) node[anchor=-19,inner sep=1] {$P=0$} to[out=-50,in=170]++ (-30:1.5*\rx);
  \draw[dashed] (-\Rx,\hL) --++ (1.3*\Rx,0) (\Rx,\hR) --++ (-1.3*\Rx,0);
  \draw[<->] (0,\hL) -- (0,\hR) node[midway,fill=white,inner sep=1] {$h$};

\end{tikzpicture}


% MANOMETER
\begin{tikzpicture}
  \def\W{0.8}       % pressure box height
  \def\H{0.7}       % pressure box height
  \def\Rx{0.55}     % tube bend radius horizontal
  \def\Ry{0.2*\Rx}  % tube bend radius vertical
  \def\rx{0.28*\Rx} % tube radius horizontal
  \def\ry{0.28*\Ry} % tube radius vertical
  \def\HL{1.3}      % tube height left
  \def\HR{2.2}      % stube height right
  \def\hL{0.40*\HL} % water level height left
  \def\hR{0.80*\HR} % water level height right
  %\def\th{2.7*\H}   % tube height
  %\def\ty{0.93*\th} % tube level
  \def\N{14}
  \draw[water]
    (-\Rx,\hL) --++ (0,-\hL) arc(180:360:\Rx) --++ (0,\hR) --++ (2*\rx,0) --++
    (0,-\hR) arc(360:180:\Rx+2*\rx) --++ (0,\hL);
  \draw[water]
    (-\Rx-\rx,\hL) ellipse({\rx} and {\ry})
    (\Rx+\rx,\hR) ellipse({\rx} and {\ry});
  \draw[thick]
    (-\Rx,\HL) --++ (0,-\HL) arc(180:360:\Rx) --++ (0,\HR) arc(180:0:{\rx} and \ry)
    --++ (0,-\HR) arc(360:180:\Rx+2*\rx) --++ (0,\HL)
    arc(0:90:\rx) --++ (-\rx,0) --++ (0,0.7*\rx-\H/2) -|++ (-\W,\H) -|++ (\W,0.7*\rx-\H/2)
    --++ (2*\rx,0) arc(90:0:2*\rx) -- cycle;
  \draw[thick]
    (\Rx+\rx,\HR) ellipse({\rx} and \ry);
  \foreach \i [evaluate={\y=(\hL+\hR)/2+0.8*\HR*(\i-\N/2)/\N;}] in {0,...,\N}{
    \draw[line cap=round] (\Rx+2*\rx+0.007,\y) arc(0:-50:{\rx} and \ry);
  }
  \draw[line cap=round,myred] (\Rx+2*\rx+0.007,{(\hL+\hR)/2}) arc(0:-70:{\rx} and \ry);
  \draw[line cap=round,myred] (-\Rx+0.007,{(\hL+\hR)/2}) arc(0:-70:{\rx} and \ry);
  \node at (-\W/2-4*\rx-\Rx,\HL+1.7*\rx) {$P$};
  \node[above=2] at (\Rx+\rx,\HR+\ry) {$P_\mathrm{atm}$};
  \draw[dashed] (-\Rx,\hL) --++ (1.3*\Rx,0) (\Rx,\hR) --++ (-1.3*\Rx,0);
  \draw[<->] (0,\hL) -- (0,\hR) node[midway,fill=white,inner sep=1] {$h$};
\end{tikzpicture}


\end{document}
Click to download: fluid_dynamics_barometer.tex • fluid_dynamics_barometer.pdf
Open in Overleaf: fluid_dynamics_barometer.tex


Hello,
I am trying to modify the Torricelli’s experiment part to make a measuring cylinder. I have managed to do the following:
% TUBE
\draw[vertical water]
(-\rx,\h) |-++ (2*\rx,\ty) –++ (0,-\ty);
\draw[water]
(0,\h+\ty) ellipse ({\rx} and {\ry});
\draw[thick,line cap=round]
(-\rx,\h) –++ (0,\th+\rx);% coordinate (T) arc(180:90:\rx);% –++ (0,-\th);
\draw[thick,line cap=round]
(\rx,\h) –++ (0,\th) coordinate (T) arc(180:135:1.4*\rx);
\draw[mydarkblue,line cap=round]
(-1.09*\rx,\h-0.005) arc(180:360:{1.09*\rx} and 1.12*\ry);
\foreach \i [evaluate={\y=1.12*\H+0.84*\th*\i/\N}] in {0,…,\N}{
\draw[line cap=round] (\rx,\y) arc(0:-50:{\rx} and \ry);
}
Just a simple cylinder with a little spout. From here, I got stuck (to make the base of the measuring cylinder and connecting the top parts to look like the edges of the glass.
My aim is to make instructions on how to measure volume of irregular objects.
Any help would be greatly appreciated! Thank you!