")


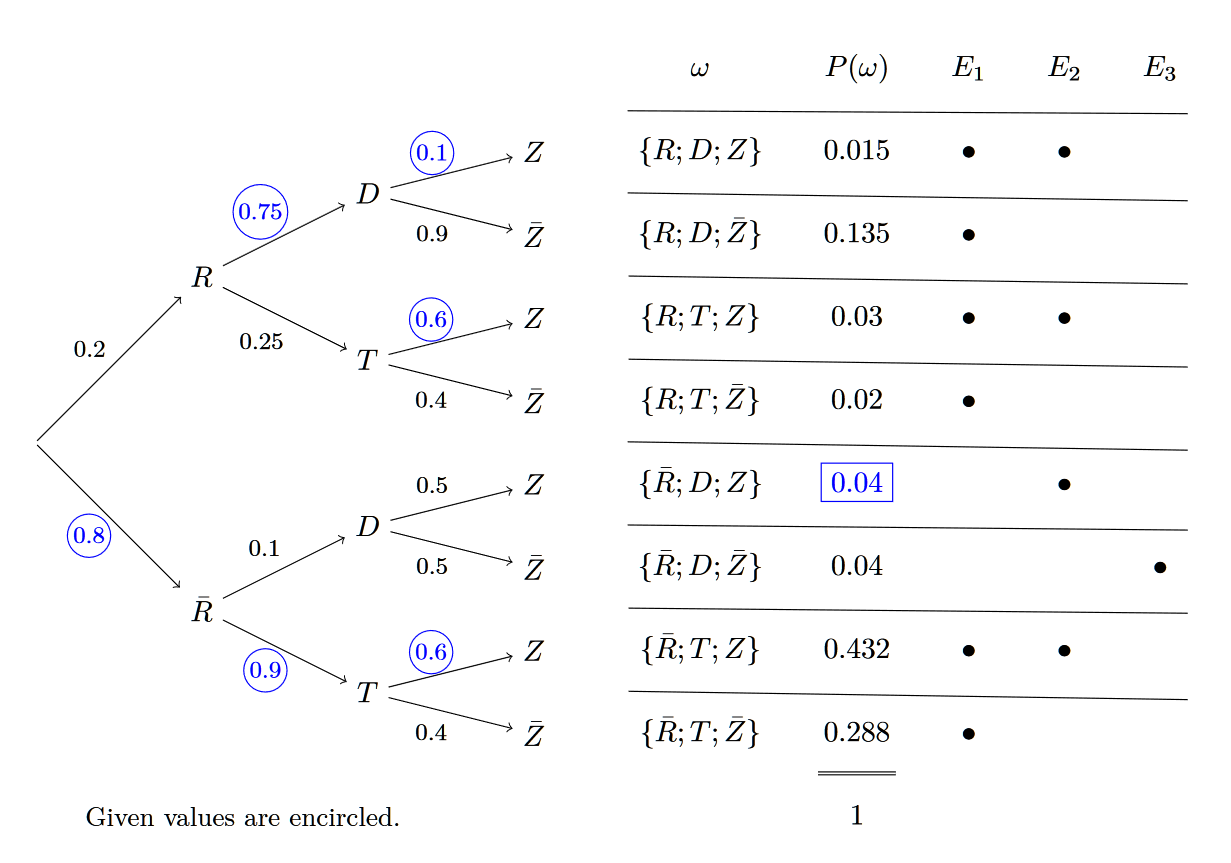
A probability tree with an aligned matrix listing the possible outcomes, their probabilities and three columns for events described in later tasks. It uses the graphdrawing library and requires LuaLaTeX.
% !TeX lualatex
\documentclass[tikz,border=0.5cm]{standalone}

\usetikzlibrary{graphs,graphdrawing,quotes,matrix,calc}
\usegdlibrary{trees}

\begin{document}
\begin{tikzpicture}

  \graph [tree layout,
          grow=right,
          level distance=20mm,
          sibling distance=10mm,
          edge quotes={auto,
                       node font=\footnotesize,
                       inner sep=1pt,
                       outer sep=2pt,
                       shape=circle}
          ]
    {
    root [as=,inner sep=0pt] -> {
      NR [> "0.8"{',blue,draw}, as=$\bar{R}$] -> {
        T2 [> "0.9"{',blue,draw}, as=$T$] -> {
          NRTNZ [>"0.4"', as=$\bar{Z}$],
          NRTZ [>"0.6" {blue,draw}, as=$Z$]
        },
        D2 [> "0.1", as=$D$] -> {
          NRDNZ [>"0.5"', as=$\bar{Z}$],
          NRDZ [>"0.5", as=$Z$]
        }
      },
      R [> "0.2", as=$R$] -> {
        T1 [> "0.25"', as=$T$] -> {
          RTNZ [>"0.4"', as=$\bar{Z}$],
          RTZ [>"0.6" {blue,draw}, as=$Z$]
        },
        D1 [> "0.75" {blue,draw}, as=$D$] -> {
          RDNZ [>"0.9"', as=$\bar{Z}$],
          RDZ [>"0.1" {blue,draw}, as=$Z$]
        }
      }
    }
  };

  \matrix [matrix of math nodes,
           nodes in empty cells, % Generate nodes mat-X-Y also for empty cells
           row sep={10mm,between origins}, % Adjust row sep according to
                                           % sibling distance from graph
           column sep=5mm,
           anchor=mat-2-1.center, % Align matrix
           ]
  (mat) at ($(RDZ)+(2,0)$) % Position matrix
  {
    \omega                & P(\omega)         & E_1     & E_2     & E_3     \\
    \{R;D;Z\}             & 0.015             & \bullet & \bullet &         \\
    \{R;D;\bar{Z}\}       & 0.135             & \bullet &         &         \\
    \{R;T;Z\}             & 0.03              & \bullet & \bullet &         \\
    \{R;T;\bar{Z}\}       & 0.02              & \bullet &         &         \\
    \{\bar{R};D;Z\}       & |[blue,draw]|0.04 &         & \bullet &         \\
    \{\bar{R};D;\bar{Z}\} & 0.04              &         &         & \bullet \\
    \{\bar{R};T;Z\}       & 0.432             & \bullet & \bullet &         \\
    \{\bar{R};T;\bar{Z}\} & 0.288             & \bullet &         &         \\
                          & 1                 &         &         &         \\
  };

  % Horizontal lines for the table
  \foreach \x/\y in {1/2, 2/3, 3/4, 4/5, 5/6, 6/7, 7/8, 8/9}
    {\draw [-] ($(mat-\x-1.west -| mat-2-1.west)!0.5!(mat-\y-1.west)$) --
      ($(mat-\x-5.east -| mat-1-5.east)!0.5!(mat-\y-5.east -| mat-1-5.east)$);}

  % Indicate summation by double rule
  \draw [double, shorten >=-1mm, shorten <=-1mm]
    ($(mat-9-2.west)!0.5!(mat-10-2.west)$) --
    ($(mat-9-2.east)!0.5!(mat-10-2.east)$);

  % Explanation
  \node at (2.5,-4.5) {\small Given values are encircled.};

\end{tikzpicture}
\end{document}