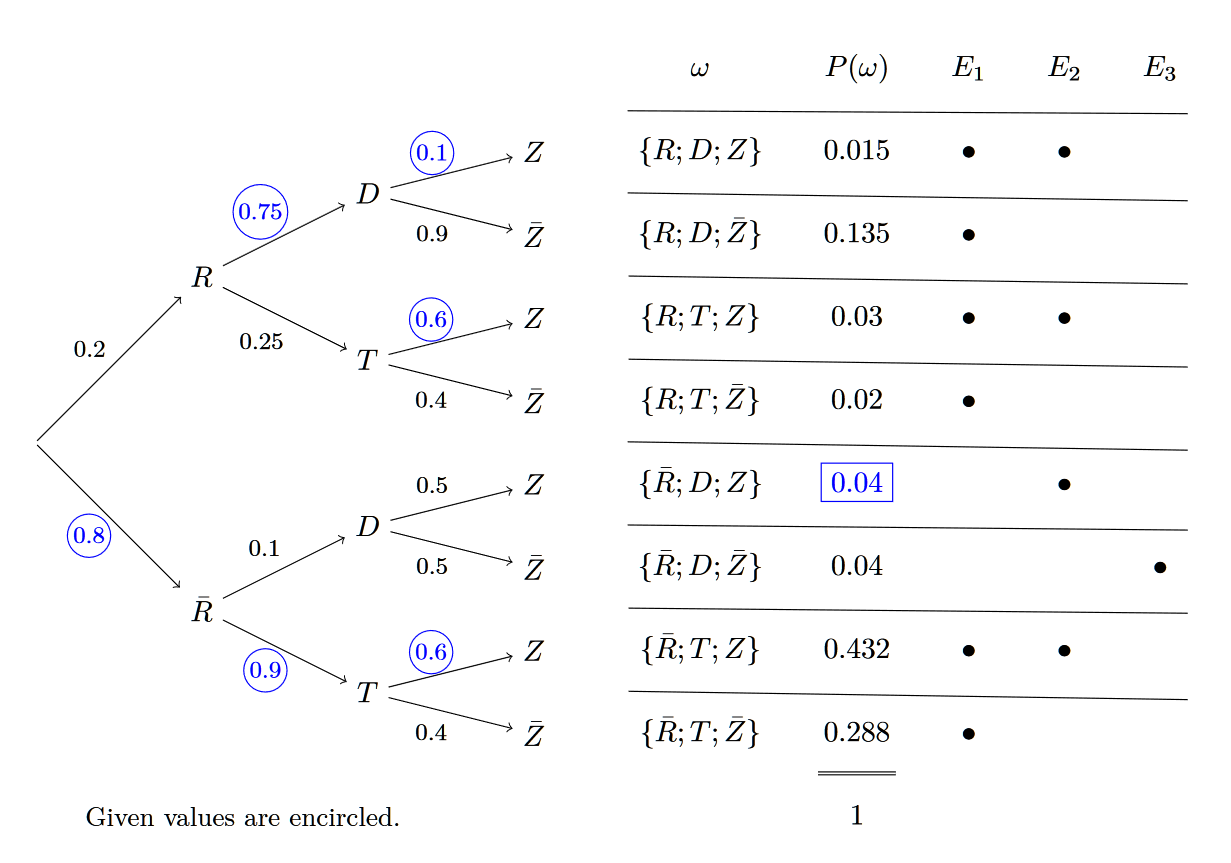
Tree with aligned matrix

A probability tree with an aligned matrix listing the possible outcomes, their probabilities and three columns for events described in later tasks. It uses the graphdrawing library and requires LuaLaTeX.

Tree with aligned matrix

% !TeX lualatex
\documentclass[tikz,border=0.5cm]{standalone}

\usetikzlibrary{graphs,graphdrawing,quotes,matrix,calc}
\usegdlibrary{trees}

\begin{document}
\begin{tikzpicture}

  \graph [tree layout,
          grow=right,
          level distance=20mm,
          sibling distance=10mm,
          edge quotes={auto,
                       node font=\footnotesize,
                       inner sep=1pt,
                       outer sep=2pt,
                       shape=circle}
          ]
    {
    root [as=,inner sep=0pt] -> {
      NR [> "0.8"{',blue,draw}, as=$\bar{R}$] -> {
        T2 [> "0.9"{',blue,draw}, as=$T$] -> {
          NRTNZ [>"0.4"', as=$\bar{Z}$],
          NRTZ [>"0.6" {blue,draw}, as=$Z$]
        },
        D2 [> "0.1", as=$D$] -> {
          NRDNZ [>"0.5"', as=$\bar{Z}$],
          NRDZ [>"0.5", as=$Z$]
        }
      },
      R [> "0.2", as=$R$] -> {
        T1 [> "0.25"', as=$T$] -> {
          RTNZ [>"0.4"', as=$\bar{Z}$],
          RTZ [>"0.6" {blue,draw}, as=$Z$]
        },
        D1 [> "0.75" {blue,draw}, as=$D$] -> {
          RDNZ [>"0.9"', as=$\bar{Z}$],
          RDZ [>"0.1" {blue,draw}, as=$Z$]
        }
      }
    }
  };

  \matrix [matrix of math nodes,
           nodes in empty cells, % Generate nodes mat-X-Y also for empty cells
           row sep={10mm,between origins}, % Adjust row sep according to
                                           % sibling distance from graph
           column sep=5mm,
           anchor=mat-2-1.center, % Align matrix
           ]
  (mat) at ($(RDZ)+(2,0)$) % Position matrix
  {
    \omega                & P(\omega)         & E_1     & E_2     & E_3     \\
    \{R;D;Z\}             & 0.015             & \bullet & \bullet &         \\
    \{R;D;\bar{Z}\}       & 0.135             & \bullet &         &         \\
    \{R;T;Z\}             & 0.03              & \bullet & \bullet &         \\
    \{R;T;\bar{Z}\}       & 0.02              & \bullet &         &         \\
    \{\bar{R};D;Z\}       & |[blue,draw]|0.04 &         & \bullet &         \\
    \{\bar{R};D;\bar{Z}\} & 0.04              &         &         & \bullet \\
    \{\bar{R};T;Z\}       & 0.432             & \bullet & \bullet &         \\
    \{\bar{R};T;\bar{Z}\} & 0.288             & \bullet &         &         \\
                          & 1                 &         &         &         \\
  };

  % Horizontal lines for the table
  \foreach \x/\y in {1/2, 2/3, 3/4, 4/5, 5/6, 6/7, 7/8, 8/9}
    {\draw [-] ($(mat-\x-1.west -| mat-2-1.west)!0.5!(mat-\y-1.west)$) --
      ($(mat-\x-5.east -| mat-1-5.east)!0.5!(mat-\y-5.east -| mat-1-5.east)$);}

  % Indicate summation by double rule
  \draw [double, shorten >=-1mm, shorten <=-1mm]
    ($(mat-9-2.west)!0.5!(mat-10-2.west)$) --
    ($(mat-9-2.east)!0.5!(mat-10-2.east)$);

  % Explanation
  \node at (2.5,-4.5) {\small Given values are encircled.};

\end{tikzpicture}
\end{document}

Leave a Reply

Your email address will not be published.