")


Edit and compile if you like:
\documentclass[tikz]{standalone}
\usepackage{mathtools}
\let\Im\relax
\DeclareMathOperator{\Im}{Im}
\let\Re\relax
\DeclareMathOperator{\Re}{Re}
\usetikzlibrary{decorations.markings,positioning}
\providecommand{\poles}{
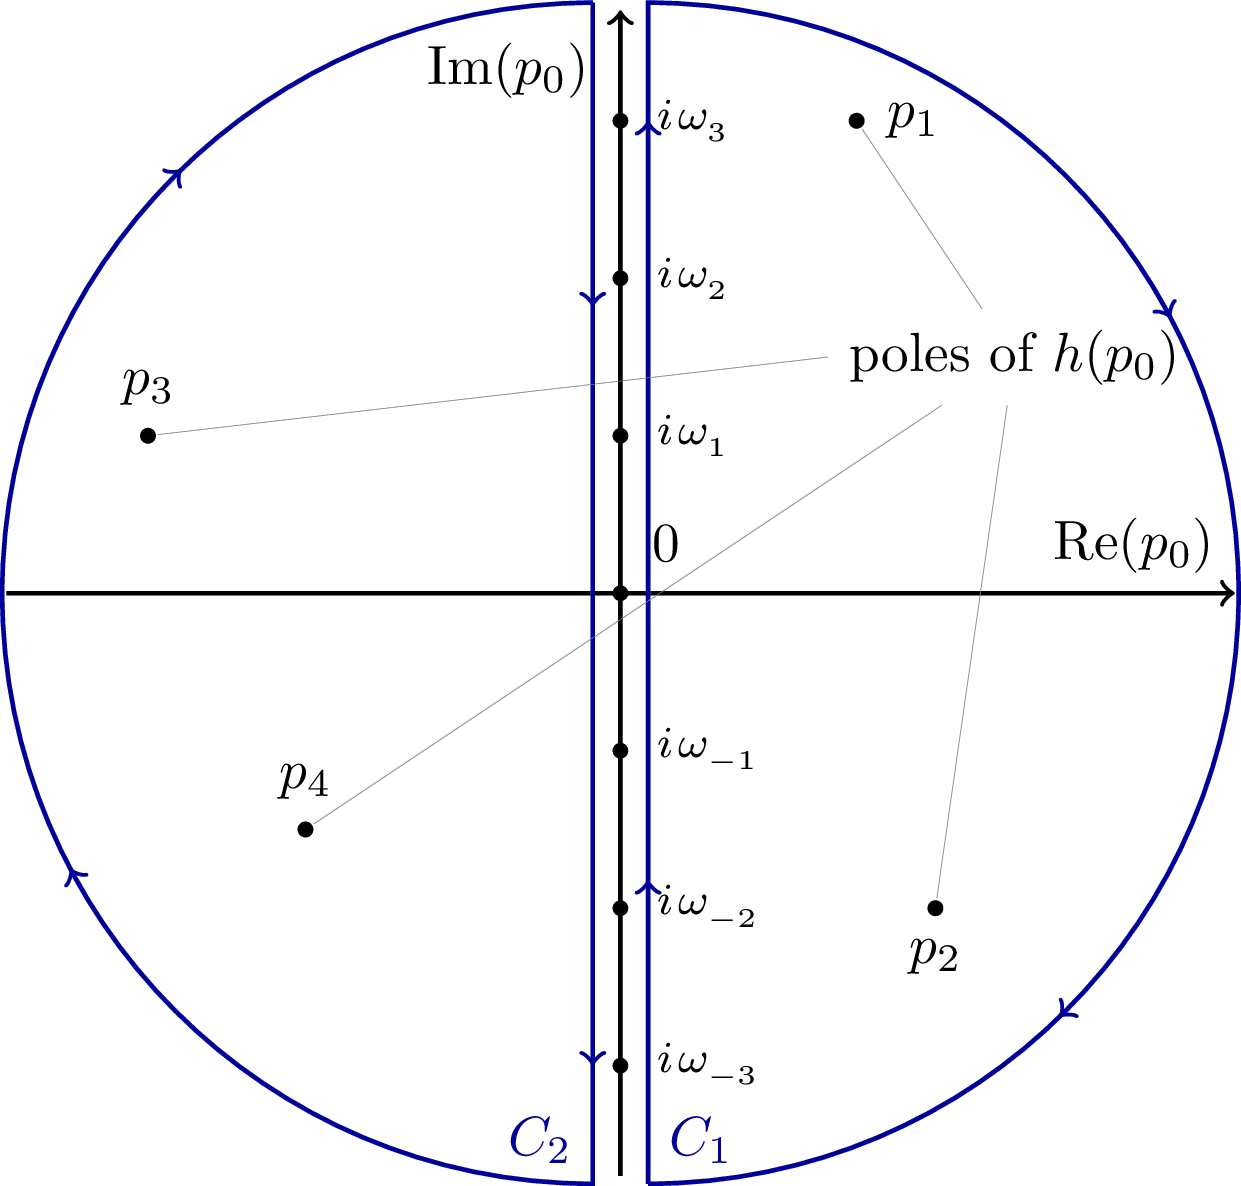
\node (poles) at (2.5,1.5) {poles of $h(p_0)$};
\draw[fill]
(1.5,3) coordinate [circle,fill,inner sep=1pt,label=right:$p_1$] (p1)
(2,-2) coordinate [circle,fill,inner sep=1pt,label=below:$p_2$] (p2)
(-3,1) coordinate [circle,fill,inner sep=1pt,label=above:$p_3$] (p3)
(-2,-1.5) coordinate [circle,fill,inner sep=1pt,label=above:$p_4$] (p4);
\draw[ultra thin,gray] (poles) -- (p1) (poles) -- (p2) (poles.west) -- (p3) (poles) -- (p4);
}
\def\xr{3.5}
\def\yr{3}
\begin{document}
\begin{tikzpicture}[thick]
% Axes
\draw[->] (-\xr-0.4,0) -- (\xr+0.4,0) node [above left] {$\Re(p_0)$};
\draw[->] (0,-\yr-0.7) -- (0,\yr+0.7) node[below left=0.1] {$\Im(p_0)$};
% Matsubara frequencies
\foreach \n in {-\yr,...,-1,1,2,...,\yr}{%
\draw[fill] (0,\n) circle (1pt) node [right=0.1,font=\footnotesize] {$i \mkern2mu \omega_{_{\n}}$};}
\draw[fill] (0,0) circle (1pt) node [above right=0.1] {0};
% Right contour line
\draw[xshift=5,blue!60!black,decoration={markings,mark=between positions 0.1 and 1 step 0.25 with \arrow{>}},postaction={decorate}] (0,-\yr-0.75) node [above right] {$C_1$} -- (0,\yr+0.75) arc (90:-90:\yr+0.75);
% Left contour line
\draw[xshift=-5,blue!60!black,decoration={markings,mark=between positions 0.1 and 1 step 0.25 with \arrow{>}},postaction={decorate}] (0,\yr+0.75) -- (0,-\yr-0.75) node [above left] {$C_2$} arc (270:90:\yr+0.75);
% Poles
\poles
\end{tikzpicture}
\end{document}
Click to download: contour-3.tex
Open in Overleaf: contour-3.tex
This file is available on tikz.netlify.app and on GitHub and is MIT licensed.
See more on the author page of Janosh Riebesell..


