")


Edit and compile if you like:
\documentclass[tikz]{standalone}
\usepackage{pgfplots}
\pgfplotsset{compat=newest}
\begin{document}
\begin{tikzpicture}
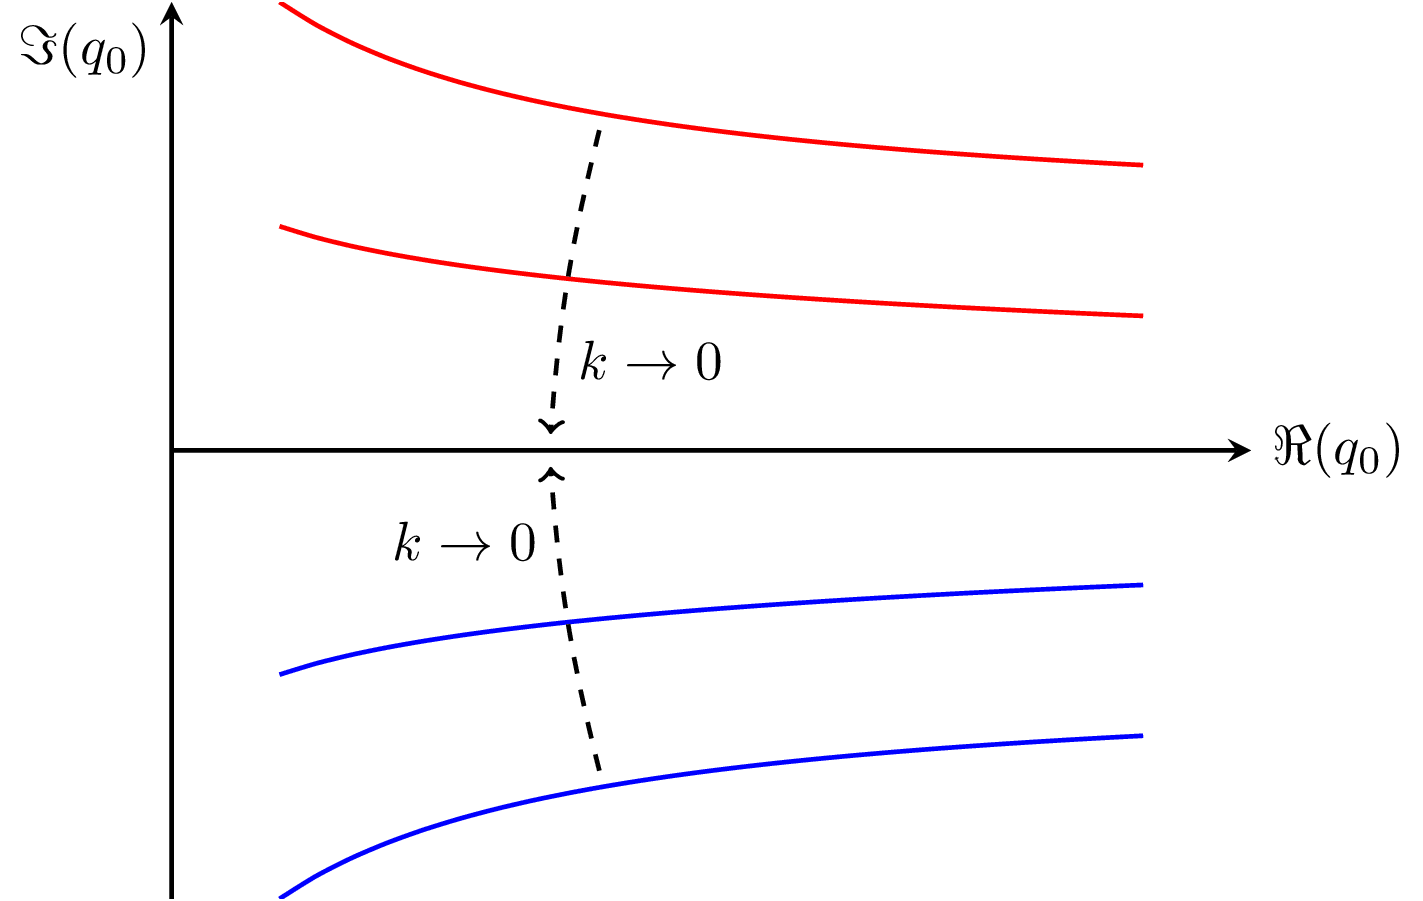
\begin{axis}[
xmin=0,xmax=10,
xlabel = $\Re(q_0)$,
ylabel = $\Im(q_0)$,
smooth,axis lines=middle,thick,
every tick/.style = {thick},
xlabel style = right,
ylabel style = below left,
ticks=none]
\addplot[color=red,domain = 1:9]{1/(sqrt(x)+2)};
\addplot[color=red,domain = 1:9]{1/(x+2) + 1/3};
\addplot[color=blue,domain = 1:9]{-1/(sqrt(x)+2)};
\addplot[color=blue,domain = 1:9]{-1/(x+2) - 1/3};
\draw[dashed,shorten >=3,shorten <=3] (4,0.5) edge [->,bend right=5] node[near end,right] {$k \to 0$} (3.5,0);
\draw[dashed,shorten >=3,shorten <=3] (4,-0.5) edge [->,bend left=5] node[near end,left] {$k \to 0$} (3.5,0);
\end{axis}
\end{tikzpicture}
\end{document}
Click to download: cuts.tex
Open in Overleaf: cuts.tex
This file is available on tikz.netlify.app and on GitHub and is MIT licensed.
See more on the author page of Janosh Riebesell..