")


You can use the \draw plot [smooth] coordinates {<coordinate1> <coordinate2> <coordinate3> ...}; syntax, which uses an algorithm similar to the one you described.
The looseness is controlled by the tension parameter. If you want to close the line, you can use [smooth cycle] instead of smooth:

\documentclass[tikz,border=10pt]{standalone}
\begin{document}
\begin{tikzpicture}
\draw [gray!50]  (0,0) -- (1,1) -- (3,1) -- (1,0)  -- (2,-1) -- cycle;
\draw [red] plot [smooth cycle] coordinates {(0,0) (1,1) (3,1) (1,0) (2,-1)};

\draw [gray!50, xshift=4cm]  (0,0) -- (1,1) -- (2,-2) -- (3,0);
\draw [cyan, xshift=4cm] plot [smooth, tension=2] coordinates { (0,0) (1,1) (2,-2) (3,0)};
\end{tikzpicture}
\end{document}
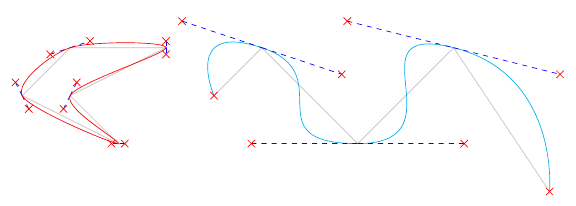
The smooth algorithm is quite simple: it sets the support points so that the tangent at each corner is parallel to the line from the previous to the next corner. The distance of the support points to the corner is the same in either direction, and proportional to the distance from the previous corner to the next corner. The tension is used as a multiplier for the support point distance. It can not be changed along the curve, and neither can the starting and finishing angles of the line be specified. The algorithm can be found in pgflibraryplothandlers.code.tex as \pgfplothandlercurveto.
\documentclass[tikz,border=10pt]{standalone}
\usetikzlibrary{decorations.pathreplacing,shapes.misc}

\begin{document}
\begin{tikzpicture}
\tikzset{
    show curve controls/.style={
        decoration={
            show path construction,
            curveto code={
                \draw [blue, dashed]
                    (\tikzinputsegmentfirst) -- (\tikzinputsegmentsupporta)
                    node [at end, cross out, draw, solid, red, inner sep=2pt]{};
                \draw [blue, dashed]
                    (\tikzinputsegmentsupportb) -- (\tikzinputsegmentlast)
                    node [at start, cross out, draw, solid, red, inner sep=2pt]{};
            }
        }, decorate
    }
}

\draw [gray!50]  (0,0) -- (1,1) -- (3,1) -- (1,0)  -- (2,-1) -- cycle;
\draw [show curve controls] plot [smooth cycle] coordinates {(0,0) (1,1) (3,1) (1,0) (2,-1)};
\draw [red] plot [smooth cycle] coordinates {(0,0) (1,1) (3,1) (1,0) (2,-1)};

\draw [gray!50, xshift=4cm]  (0,0) -- (1,1) -- (3,-1) -- (5,1) -- (7,-2);
\draw [cyan, xshift=4cm] plot [smooth, tension=2] coordinates { (0,0) (1,1) (3,-1) (5,1) (7,-2)};
\draw [show curve controls,cyan, xshift=4cm] plot [smooth, tension=2] coordinates { (0,0) (1,1) (3,-1) (5,1) (7,-2)};
\end{tikzpicture}
\end{document}
Here is a slightly modified version of the plothandler, which allows you to specify the first and last support point using the TikZ key first support={<point>} and last support={<point>}, where <point> can be any TikZ coordinate expression, such as(1,2), (1cm,2pt), (A.south west), ([xshift=1cm] A.south west) (thanks to Andrew Stacey’s wonderful answer to https://tex.stackexchange.com/questions/33703/extract-x-y-coordinate-of-an-arbitrary-point-in-tikz/33765#33765).
By default, the points are assumed to refer to coordinates relative to the first/last point of the path. You can specify that the support points are given as absolute coordinates by using the keys absolute first support, absolute last support, or absolute supports.

\documentclass[tikz,border=10pt]{standalone}
\usetikzlibrary{decorations.pathreplacing,shapes.misc}

\begin{document}
\begin{tikzpicture}
\tikzset{
    show curve controls/.style={
        decoration={
            show path construction,
            curveto code={
                \draw [blue, dashed]
                    (\tikzinputsegmentfirst) -- (\tikzinputsegmentsupporta)
                    node [at end, cross out, draw, solid, red, inner sep=2pt]{};
                \draw [blue, dashed]
                    (\tikzinputsegmentsupportb) -- (\tikzinputsegmentlast)
                    node [at start, cross out, draw, solid, red, inner sep=2pt]{};
            }
        }, decorate
    }
}

\makeatletter
\newcommand{\gettikzxy}[3]{%
  \tikz@scan@one@point\pgfutil@firstofone#1\relax
  \edef#2{\the\pgf@x}%
  \edef#3{\the\pgf@y}%
}

\newif\iffirstsupportabsolute
\newif\iflastsupportabsolute

\tikzset{
    absolute first support/.is if=firstsupportabsolute,
    absolute first support=false,
    absolute last support/.is if=lastsupportabsolute,
    absolute last support=false,
    absolute supports/.style={
        absolute first support=#1,
        absolute last support=#1
    },
    first support/.code={
        \gettikzxy{#1}{\pgf@plot@firstsupportrelx}{\pgf@plot@firstsupportrely}
    },
    first support={(0pt,0pt)},
    last support/.code={
        \gettikzxy{#1}{\pgf@plot@lastsupportrelx}{\pgf@plot@lastsupportrely}
    },
    last support={(0pt,0pt)}
}

\def\pgf@plot@curveto@handler@initial#1{%
  \pgf@process{#1}%
  \pgf@xa=\pgf@x%
  \pgf@ya=\pgf@y%
  \pgf@plot@first@action{\pgfqpoint{\pgf@xa}{\pgf@ya}}%
  \xdef\pgf@plot@curveto@first{\noexpand\pgfqpoint{\the\pgf@xa}{\the\pgf@ya}}%
  \iffirstsupportabsolute
    \pgf@xa=\pgf@plot@firstsupportrelx%
    \pgf@ya=\pgf@plot@firstsupportrely%
  \else
    \advance\pgf@xa by\pgf@plot@firstsupportrelx%
    \advance\pgf@ya by\pgf@plot@firstsupportrely%
  \fi
  \xdef\pgf@plot@curveto@firstsupport{\noexpand\pgfqpoint{\the\pgf@xa}{\the\pgf@ya}}%
  \global\let\pgf@plot@curveto@first@support=\pgf@plot@curveto@firstsupport%
  \global\let\pgf@plotstreampoint=\pgf@plot@curveto@handler@second%
}

\def\pgf@plot@curveto@handler@finish{%
  \ifpgf@plot@started%
    \pgf@process{\pgf@plot@curveto@second}
    \pgf@xa=\pgf@x%
    \pgf@ya=\pgf@y%
    \iflastsupportabsolute
      \pgf@xa=\pgf@plot@lastsupportrelx%
      \pgf@ya=\pgf@plot@lastsupportrely%
    \else
      \advance\pgf@xa by\pgf@plot@lastsupportrelx%
      \advance\pgf@ya by\pgf@plot@lastsupportrely%
    \fi
    \pgfpathcurveto{\pgf@plot@curveto@first@support}{\pgfqpoint{\the\pgf@xa}{\the\pgf@ya}}{\pgf@plot@curveto@second}%
  \fi%
}
\makeatother

\coordinate (A) at (2,-1);

\draw [gray!50]  (-1,-0.5) -- (1.5,1) -- (3,0);
\draw [
    cyan,
    postaction=show curve controls
] plot [
    smooth, tension=2,
    absolute supports,
    first support={(A)},
    last support={(A)}] coordinates { (-1,-0.5) (1.5,1) (3,0)};

\draw [
    yshift=-3cm,
    magenta,
    postaction=show curve controls
] plot [
    smooth, tension=2,
    first support={(-0.5cm,1cm)},
    last support={(0.5cm,1cm)}] coordinates { (-1,-0.5) (1.5,1) (3,0)};

\end{tikzpicture}
\end{document}