")


Edit and compile if you like:
\documentclass{standalone}
\usepackage{pgfplots,mathtools}
\pgfplotsset{compat=newest}
\def\xmax{2.3}\def\ymax{1.2}
\begin{document}
\begin{tikzpicture}
\begin{axis}[
xlabel=$\epsilon/\mu$,
ylabel=$n(\epsilon)$,
domain=0:\xmax,ymax=\ymax,
ytick={0.5,1},
smooth,thick,
axis lines=center,
every tick/.style={thick},
legend cell align=left]
% Graphs
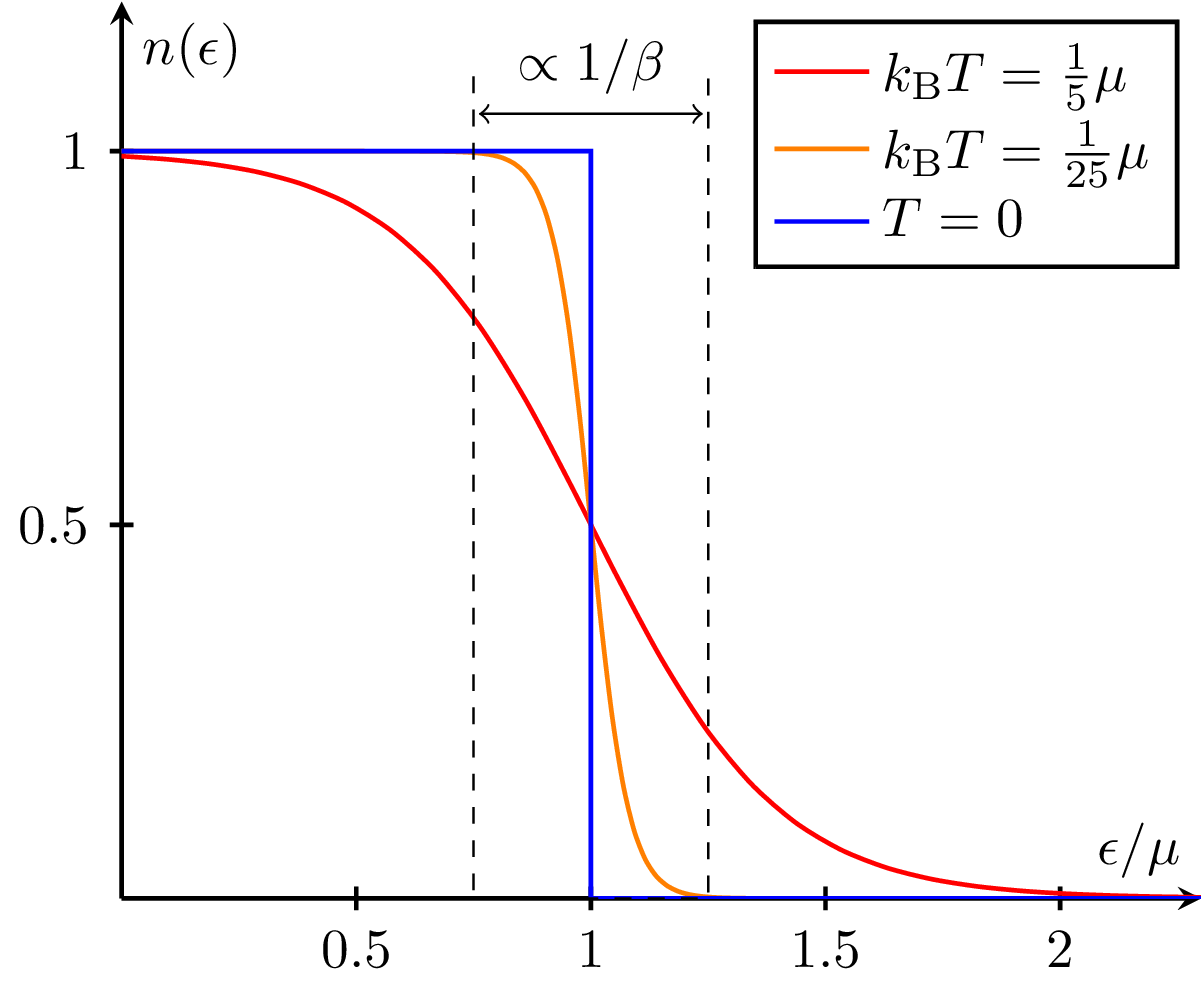
\def\chempot{1}
\def\n#1{1/(e^(#1*(x - \chempot)) + 1)}
\addplot[color=red]{\n{5}};
\addplot[color=orange,samples=100]{\n{25}};
\addplot[const plot,color=blue] coordinates {(0,1) (\chempot,0) (\xmax,0)};
\legend{$k_\text{B} T = \frac{1}{5} \mu$,$k_\text{B} T = \frac{1}{25} \mu$,$T = 0$}
% Thermal fluctuations
\draw [thin,dashed] (\chempot-0.25,1.1) -- (\chempot-0.25,0) -| (\chempot+0.25,1.1);
\draw [thin,<->,shorten >=1,shorten <=1] (\chempot-0.25,1.05) -- (\chempot+0.25,1.05) node[midway,above] {$\propto 1/\beta$};
\end{axis}
\end{tikzpicture}
\end{document}
Click to download: fermi.tex
Open in Overleaf: fermi.tex
This file is available on tikz.netlify.app and on GitHub and is MIT licensed.
See more on the author page of Janosh Riebesell..


