\documentclass[tikz,border=10pt]{standalone}
\usepackage{pgfplots}
\pgfplotsset{compat=1.18}
\begin{document}
\begin{tikzpicture}
\pgfplotsset{
every axis legend/.append style={
at={(0.5,0)},
anchor=south,legend columns=2
}}
\begin{axis}[unit vector ratio=1 1 1, axis lines=none, view={120}{30}]
% Parte inferior del cilindro
% Min utiliza el menor valor entre el eje z sin parametrizar y la z parametrizada
\addplot3[surf,z buffer=sort,samples=30,colormap/viridis,
variable=\u, variable y=\v,
domain=0:360, y domain=0:3]
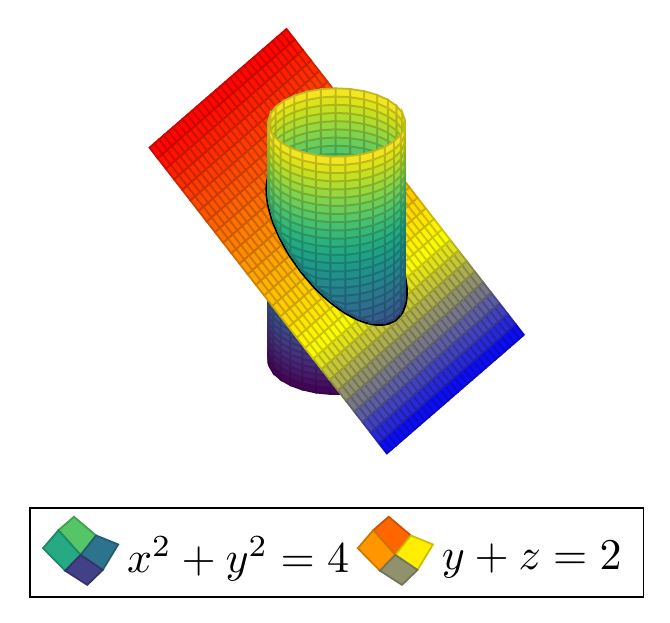
({cos(u)}, {sin(u)},{min(2-y,v)});
% Plano parametrizado y+z=2
\addplot3[surf, z buffer=sort, samples=30,
variable=\u, variable y=\v,domain=-2:2, y domain=-2:2]({u}, {v},{2-v});
% Interseccion parametrizada
\addplot3[color=black,smooth,samples=30,
variable=\u,domain=0:360,line width=1.25pt]
({cos(u)}, {sin(u)},{2-sin(u)});
% Parte superior del cilindro. Utiliza max tal en la parte inferior
\addplot3[colormap/viridis,surf,z buffer=sort,samples=30,variable=\u, variable y=\v,
domain=0:360, y domain=0:4]({cos(u)}, {sin(u)},{max(2-y,v)});
% NOTA: el orden de dibujo de las superficies cambia si se aplica una vista diferente a la 120 30
\legend{$x^2+y^2=4$,$y+z=2$}
\end{axis}
\end{tikzpicture}
\end{document}
")