")


Edit and compile if you like:
% Author: Izaak Neutelings (June 2020)
% Inspiration: https://tex.stackexchange.com/questions/285578/how-to-draw-parallelepiped-and-cube-with-latex/288101#288101
\documentclass[border=3pt,tikz]{standalone}
\usepackage{amsmath}
\usepackage{siunitx}
\usepackage{physics}
\tikzset{>=latex} % for LaTeX arrow head
\colorlet{myblue}{blue!70!black}
\colorlet{mydarkblue}{blue!40!black}
\colorlet{mygreen}{green!60!black}
\colorlet{myred}{red!65!black}
\colorlet{mypurple}{red!50!blue!95!black!75}
\tikzstyle{wave}=[myblue,thick]
\tikzstyle{xline}=[very thick,myblue]
\tikzstyle{vline}=[very thick,mygreen]
\tikzstyle{aline}=[very thick,mypurple]
\tikzstyle{mydashed}=[mydarkblue,dashed]
%\def\axis#1{
% \draw[->,thick]
% (-0.1*\xmax,0) -- (1.06*\xmax,0) node[below] {$t$\,[s]};
% \draw[->,thick]
% (0,-0.15*\ymax) -- (0,1.06*\ymax) node[above=4,below left] {#1};
%}
%\def\longaxis#1{
% \draw[->,thick]
% (-0.1*\xmax,0) -- (1.06*\xmax,0) node[below] {$t$\,[s]};
% \draw[->,thick]
% (0,-\ymax) -- (0,1.06*\ymax) node[above=4,below left] {#1};
%}
\def\tick#1#2{\draw[thick] (#1) ++ (#2:0.05*\ymax) --++ (#2-180:0.1*\ymax)}
\def\vlabel{$v\left[\si{\frac{m}{s}}\right]$}
\def\alabel{$a\left[\si{\frac{m}{s^2}}\right]$}
\begin{document}
% POSITION - CONSTANT SPEED
\def\xmax{3.2}
\def\ymax{2.4}
\def\slope{0.65}
\def\ta{0.22*\xmax}
\def\tb{0.75*\xmax}
\begin{tikzpicture}
\draw[->,thick]
(-0.1*\xmax,0) -- (1.06*\xmax,0) node[below] {$t$\,[s]};
\draw[->,thick]
(0,-0.1*\ymax) -- (0,\ymax) node[below=6,left=0] {$x$\,[m]};
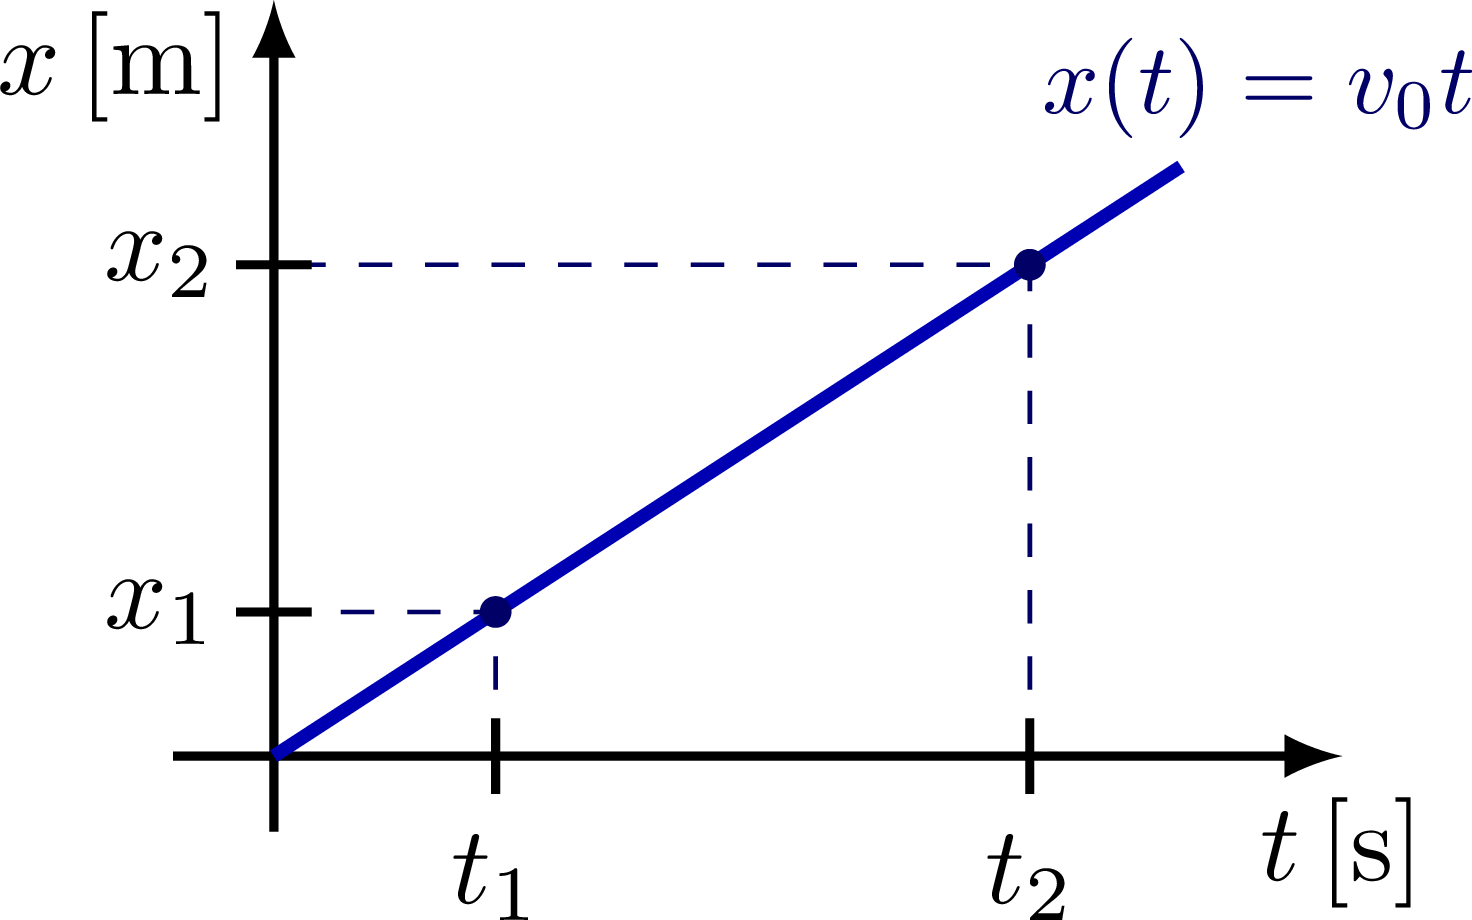
\draw[xline]
(0,0) -- (0.9*\xmax,0.9*\slope*\xmax)
node[mydarkblue,right=7,above=-1,scale=0.9] {$x(t) = v_0t$};
\draw[mydashed]
(\ta,0) |- (0,\slope*\ta)
(\tb,0) |- (0,\slope*\tb);
\fill[mydarkblue]
(\ta,\slope*\ta) circle (0.05)
(\tb,\slope*\tb) circle (0.05);
\tick{\ta,0}{90} node[below] {$t_1$};
\tick{0,\slope*\ta}{0} node[left=-2] {$x_1$};
\tick{\tb,0}{90} node[below] {$t_2$};
\tick{0,\slope*\tb}{0} node[left=-2] {$x_2$};
\end{tikzpicture}
% POSITION - CONSTANT SPEED + offset
\begin{tikzpicture}
\def\xmax{3.6}
\def\ta{0.22*\xmax}
\def\tb{0.75*\xmax}
\def\slope{0.65}
\def\ya{-\slope*\ta}
\def\yb{\slope*(\tb-\ta)}
\draw[->,thick]
(-0.1*\xmax,0) -- (1.06*\xmax,0) node[below] {$t$\,[s]};
\draw[->,thick]
(0,-0.05*\ymax-\slope*\ta) -- (0,\ymax) node[below=6,left=0] {$x$\,[m]};
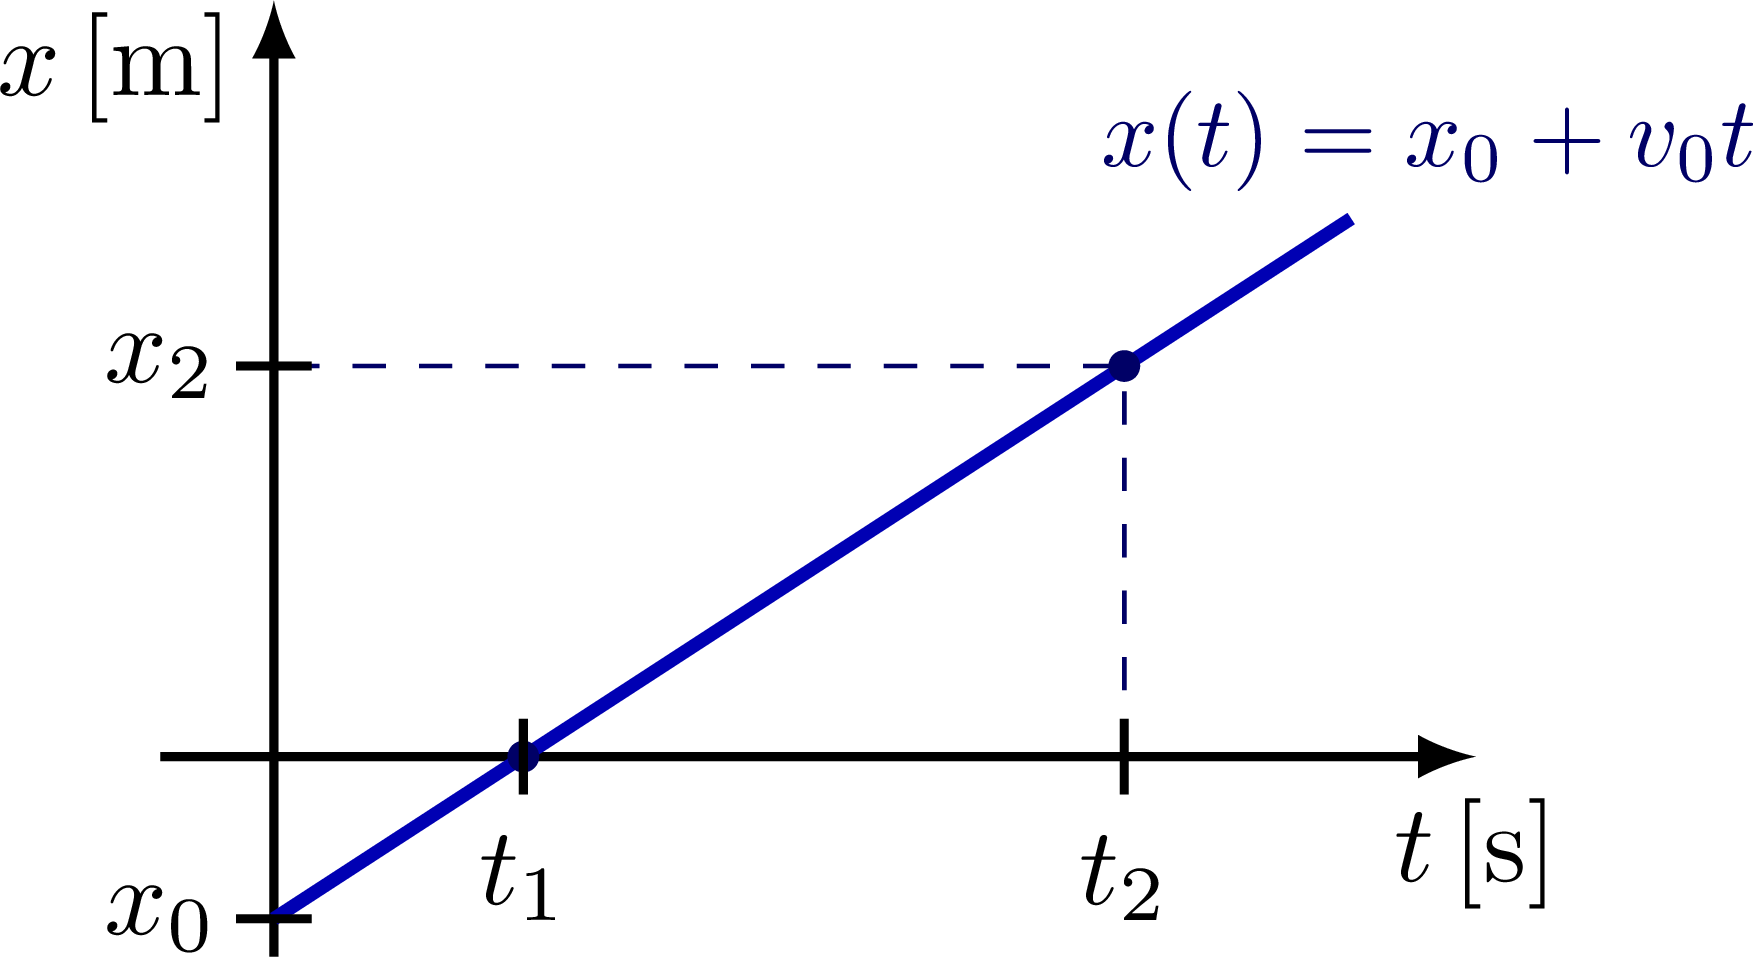
\draw[xline]
(0,-\slope*\ta) -- (0.95*\xmax,{\slope*(0.95*\xmax-\ta)})
node[mydarkblue,right=7,above=-1,scale=0.9] {$x(t) = x_0 + v_0t$};
\draw[mydashed]
(\tb,0) |- (0,{\yb});
\fill[mydarkblue]
(\ta,0) circle (0.05)
(\tb,{\yb}) circle (0.05);
\tick{\ta,0}{90} node[below] {$t_1$};
\tick{\tb,0}{90} node[below] {$t_2$};
\tick{0,{\ya}}{0} node[left=-2] {$x_0$};
\tick{0,{\yb}}{0} node[left=-2] {$x_2$};
\end{tikzpicture}
% POSITION - PARABOLA - positive acceleration + average velocity
\def\xmax{3.8}
\def\ymax{2.4}
\def\nsamples{100}
\begin{tikzpicture}
\def\A{0.2}
\def\ta{0.3*\xmax}
\def\tb{0.76*\xmax}
\def\ya{\A*\ta*\ta}
\def\yb{\A*\tb*\tb}
\draw[dashed] (\ta,0) |- (0,{\ya});
\draw[dashed] (\tb,0) |- (0,{\yb});
\tick{\ta,0}{90} node[below] {$t_1$};
\tick{\tb,0}{90} node[below] {$t_2$};
\tick{0,\ya}{0} node[left] {$x_1$};
\tick{0,\yb}{0} node[left] {$x_2$};
\draw[->,thick]
(-0.1*\xmax,0) -- (1.06*\xmax,0) node[below] {$t$\,[s]};
\draw[->,thick]
(0,-0.1*\ymax) -- (0,\ymax) node[below=4,left=0] {$x$\,[m]};
\draw[xline,variable=\t,samples=\nsamples,smooth,domain=0:0.9*\xmax]
plot(\t,\A*\t*\t)
node[mydarkblue,below=4,left=5,scale=0.9] {$x(t) = +\dfrac{at^2}{2}$};
\draw[mygreen,thick]
(\ta,\ya) -- (\tb,\yb)
node[midway,above=5,left=0,scale=1.2] {$\frac{\Delta x}{\Delta t}$};
\fill[mydarkblue]
(\ta,\ya) circle (0.05)
(\tb,\yb) circle (0.05);
\end{tikzpicture}
% POSITION - PARABOLA - positive acceleration + slope
\def\xmax{3.8}
\def\ymax{2.4}
\def\nsamples{100}
\begin{tikzpicture}
\def\A{0.2}
\def\ta{0.34*\xmax}
\def\tb{0.68*\xmax}
\def\ya{\A*\ta*\ta}
\def\yb{\A*\tb*\tb}
\def\da{0.55}
\def\db{0.55}
\draw[->,thick]
(-0.1*\xmax,0) -- (1.06*\xmax,0) node[below] {$t$\,[s]};
\draw[->,thick]
(0,-0.1*\ymax) -- (0,\ymax) node[below=4,left=0] {$x$\,[m]};
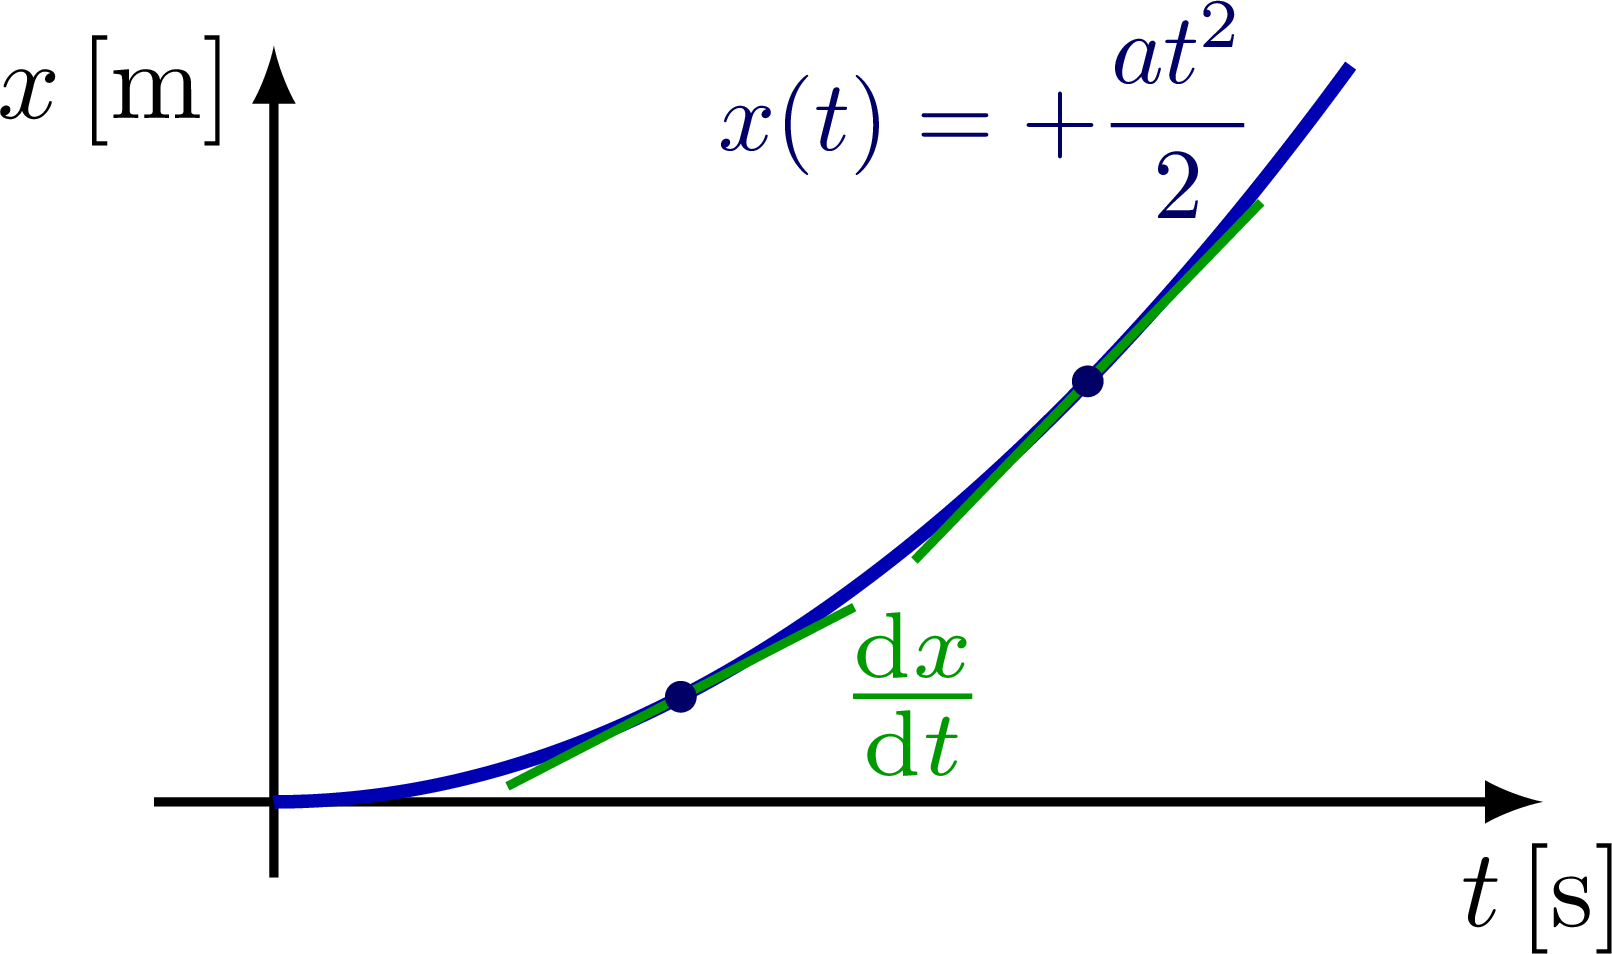
\draw[xline,variable=\t,samples=\nsamples,smooth,domain=0:0.9*\xmax]
plot(\t,\A*\t*\t)
node[mydarkblue,below=4,left=5,scale=0.9] {$x(t) = +\dfrac{at^2}{2}$};
\draw[mygreen,thick]
(\ta,\ya)++(-\da,{-2*\A*\ta*\da}) --++ (2*\da,{4*\A*\ta*\da})
node[left=2,below right=-4,scale=1.2] {$\dv{x}{t}$}
(\tb,\yb)++(-\db,{-2*\A*\tb*\db}) --++ (2*\db,{4*\A*\tb*\db});
\fill[mydarkblue]
(\ta,\ya) circle (0.05)
(\tb,\yb) circle (0.05);
\end{tikzpicture}
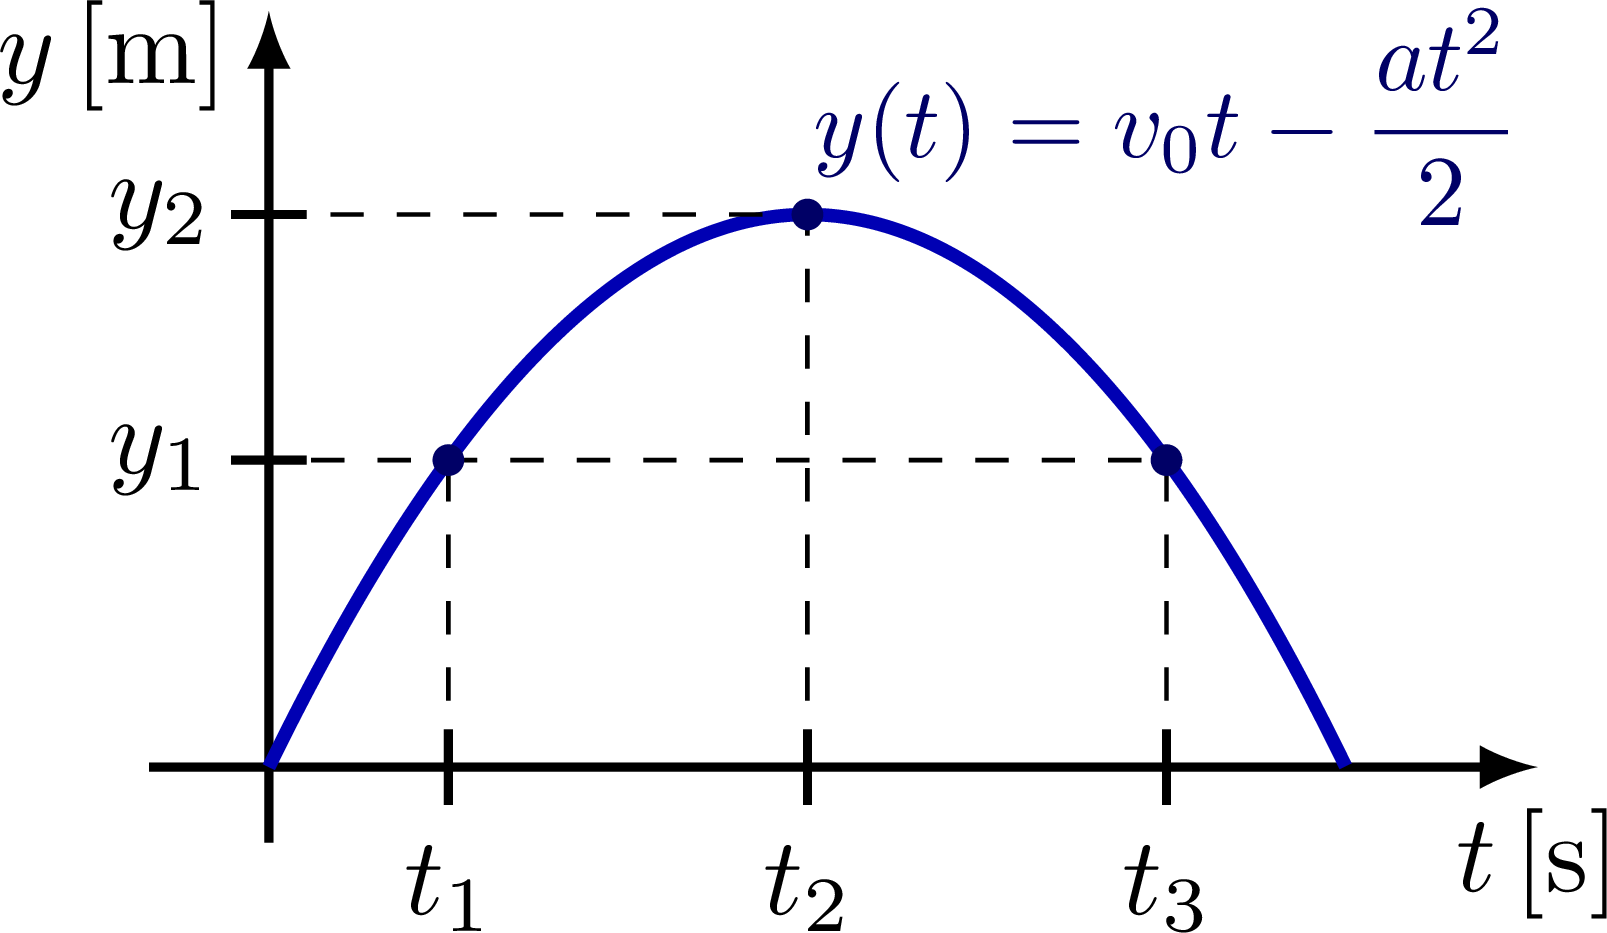
% POSITION - PARABOLA + average velocity
\begin{tikzpicture}
\def\A{0.6}
\def\ta{0.12*\xmax}
\def\tm{0.45*\xmax}
\def\tb{0.70*\xmax}
\def\ya{\A*(\root-\ta)*\ta}
\def\ym{\A*(\root-\tm)*\tm}
\def\yb{\A*(\root-\tb)*\tb}
\def\root{0.9*\xmax}
\draw[->,thick]
(-0.1*\xmax,0) -- (1.06*\xmax,0) node[below] {$t$\,[s]};
\draw[->,thick]
(0,-0.1*\ymax) -- (0,\ymax) node[below=4,left=0] {$y$\,[m]};
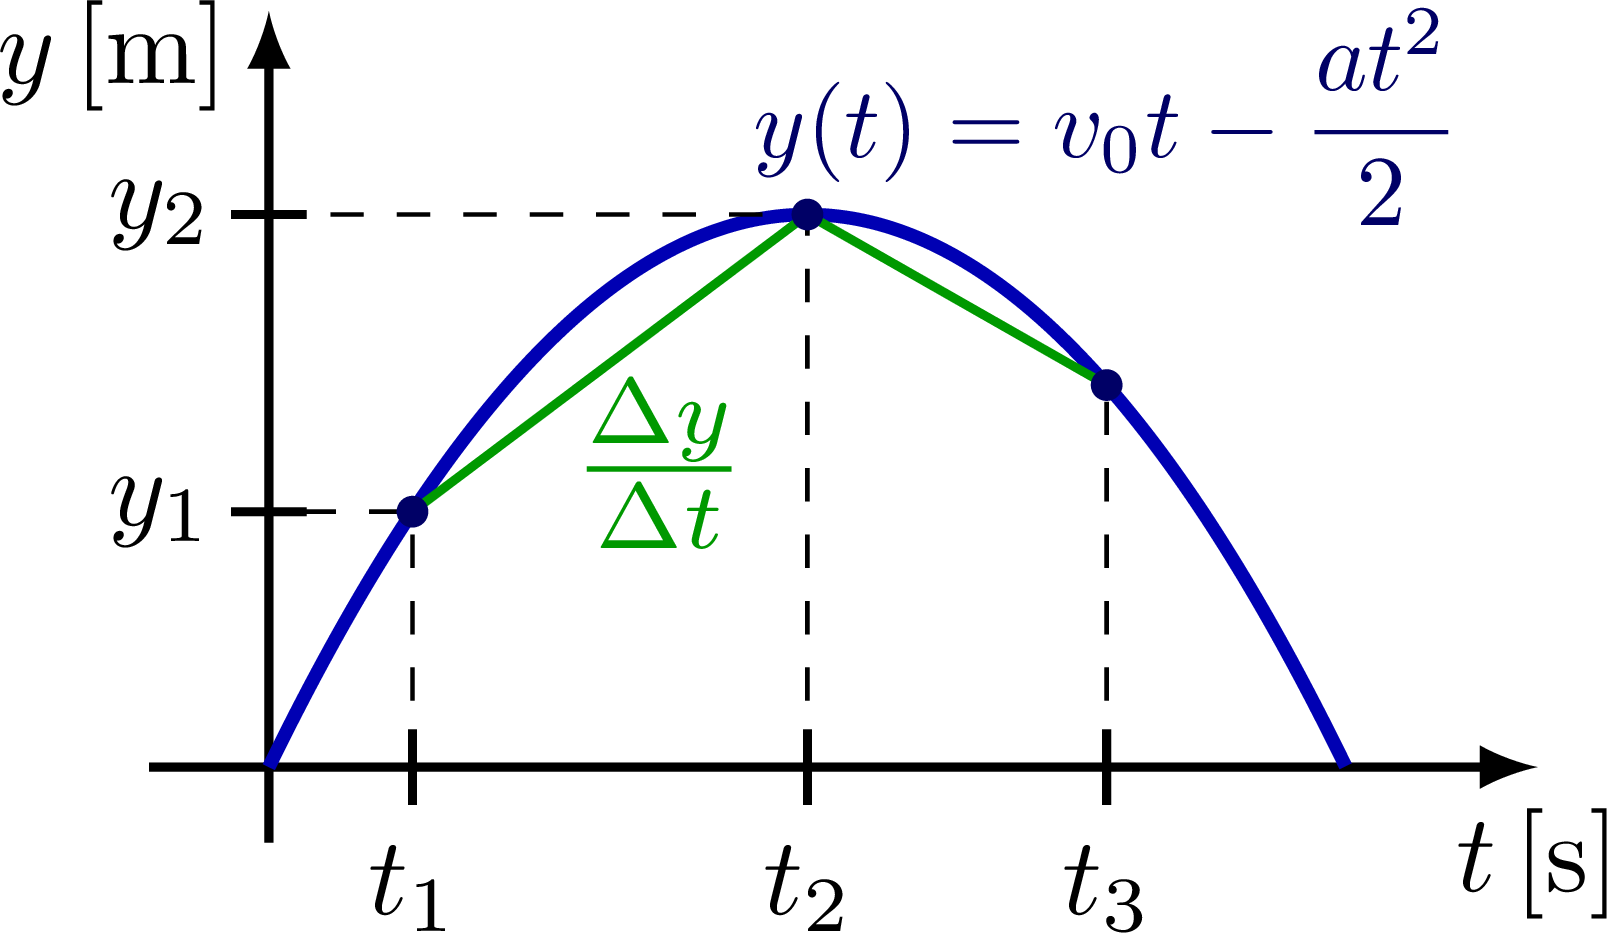
\draw[xline,variable=\t,samples=\nsamples,smooth,domain=0:\root]
plot(\t,{\A*(\root-\t)*\t}); %node[right=7,above=-2] {$x=x(t)$};
\draw[dashed] (\ta,0) |- (0,{\ya});
\draw[dashed] (\tm,0) |- (0,{\ym});
\draw[dashed] (\tb,0) -- (\tb,{\yb}); % |- (0,{\yb});
\draw[mygreen,thick]
(\ta,{\ya}) -- (\tm,{\ym}) node[midway,left=5,below right=-3,scale=1.2] {$\frac{\Delta y}{\Delta t}$}
(\tm,{\ym}) -- (\tb,{\yb});
\fill[mydarkblue]
(\ta,{\ya}) circle (0.05)
(\tm,{\ym}) circle (0.05)
(\tb,{\yb}) circle (0.05);
\tick{\ta,0}{90} node[below] {$t_1$};
\tick{\tm,0}{90} node[below] {$t_2$};
\tick{\tb,0}{90} node[below] {$t_3$};
%\tick{0,\b}{0} node[left=-2] {$x_2$};
\tick{0,{\ya}}{0} node[left=-2] {$y_1$};
\tick{0,{\ym}}{0} node[left=-2] {$y_2$};
\node[mydarkblue,scale=0.9] at (\tb,0.86*\ymax) {$y(t) = v_0t - \dfrac{at^2}{2}$};
\end{tikzpicture}
% POSITION - PARABOLA - negative acceleration
\def\A{0.6}
\def\ta{0.15*\xmax}
\def\tm{0.45*\xmax}
\def\tb{0.75*\xmax}
\def\ya{\A*(\root-\ta)*\ta}
\def\ym{\A*(\root-\tm)*\tm}
%\def\ym{\A*\root^2/4}
\def\root{0.9*\xmax}
\begin{tikzpicture}
\draw[->,thick]
(-0.1*\xmax,0) -- (1.06*\xmax,0) node[below] {$t$\,[s]};
\draw[->,thick]
(0,-0.1*\ymax) -- (0,\ymax) node[below=4,left=0] {$y$\,[m]};
\draw[xline,variable=\t,samples=\nsamples,smooth,domain=0:\root]
plot(\t,{\A*(\root-\t)*\t}); %node[right=7,above=-2] {$x=x(t)$};
\draw[dashed] (\tm,0) |- (0,{\ym});
\draw[dashed] (\ta,0) -- (\ta,{\ya});
\draw[dashed] (\tb,0) |- (0,{\ya});
\fill[mydarkblue]
(\ta,{\ya}) circle (0.05)
(\tm,{\ym}) circle (0.05)
(\tb,{\ya}) circle (0.05);
\tick{\ta,0}{90} node[below] {$t_1$};
\tick{\tm,0}{90} node[below] {$t_2$};
\tick{\tb,0}{90} node[below] {$t_3$};
%\tick{0,\b}{0} node[left=-2] {$x_2$};
\tick{0,{\ya}}{0} node[left=-2] {$y_1$};
\tick{0,{\ym}}{0} node[left=-2] {$y_2$};
\node[mydarkblue,scale=0.9] at (\tb,0.86*\ymax) {$y(t) = v_0t - \dfrac{at^2}{2}$};
\end{tikzpicture}
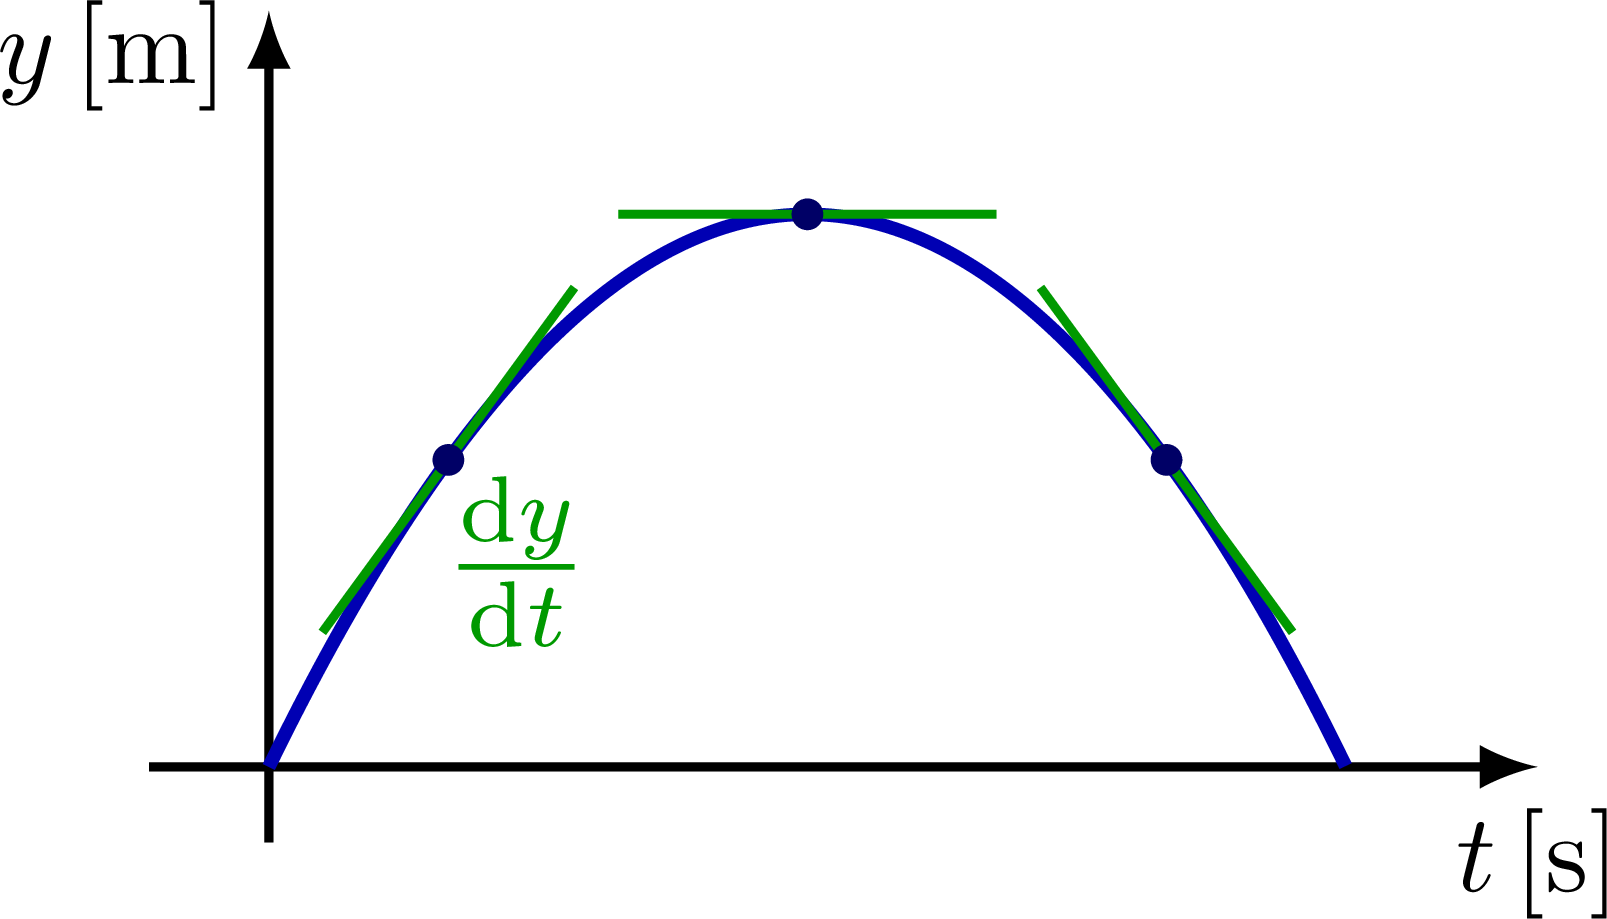
% POSITION - PARABOLA + slopes
\begin{tikzpicture}
\draw[->,thick]
(-0.1*\xmax,0) -- (1.06*\xmax,0) node[below] {$t$\,[s]};
\draw[->,thick]
(0,-0.1*\ymax) -- (0,\ymax) node[below=4,left=0] {$y$\,[m]};
\draw[xline,variable=\t,samples=\nsamples,smooth,domain=0:\root]
plot(\t,{\A*(\root-\t)*\t}); %node[right=7,above=-2] {$x=x(t)$};
\draw[mygreen,thick]
(\ta,{\ya}) --++ (-0.4,{-\A*(\root-2*\ta)*0.4}) --++ (0.8,{\A*(\root-2*\ta)*0.8})
node[midway,left=2,below right=-3,scale=1.2] {$\dv{y}{t}$}
(\tm,{\ym}) --++ (-0.6,0) --++ (1.2,0)
(\tb,{\ya}) --++ (-0.4,{-\A*(\root-2*\tb)*0.4}) --++ (0.8,{\A*(\root-2*\tb)*0.8});
\fill[mydarkblue]
(\ta,{\ya}) circle (0.05)
(\tm,{\ym}) circle (0.05)
(\tb,{\ya}) circle (0.05);
\end{tikzpicture}
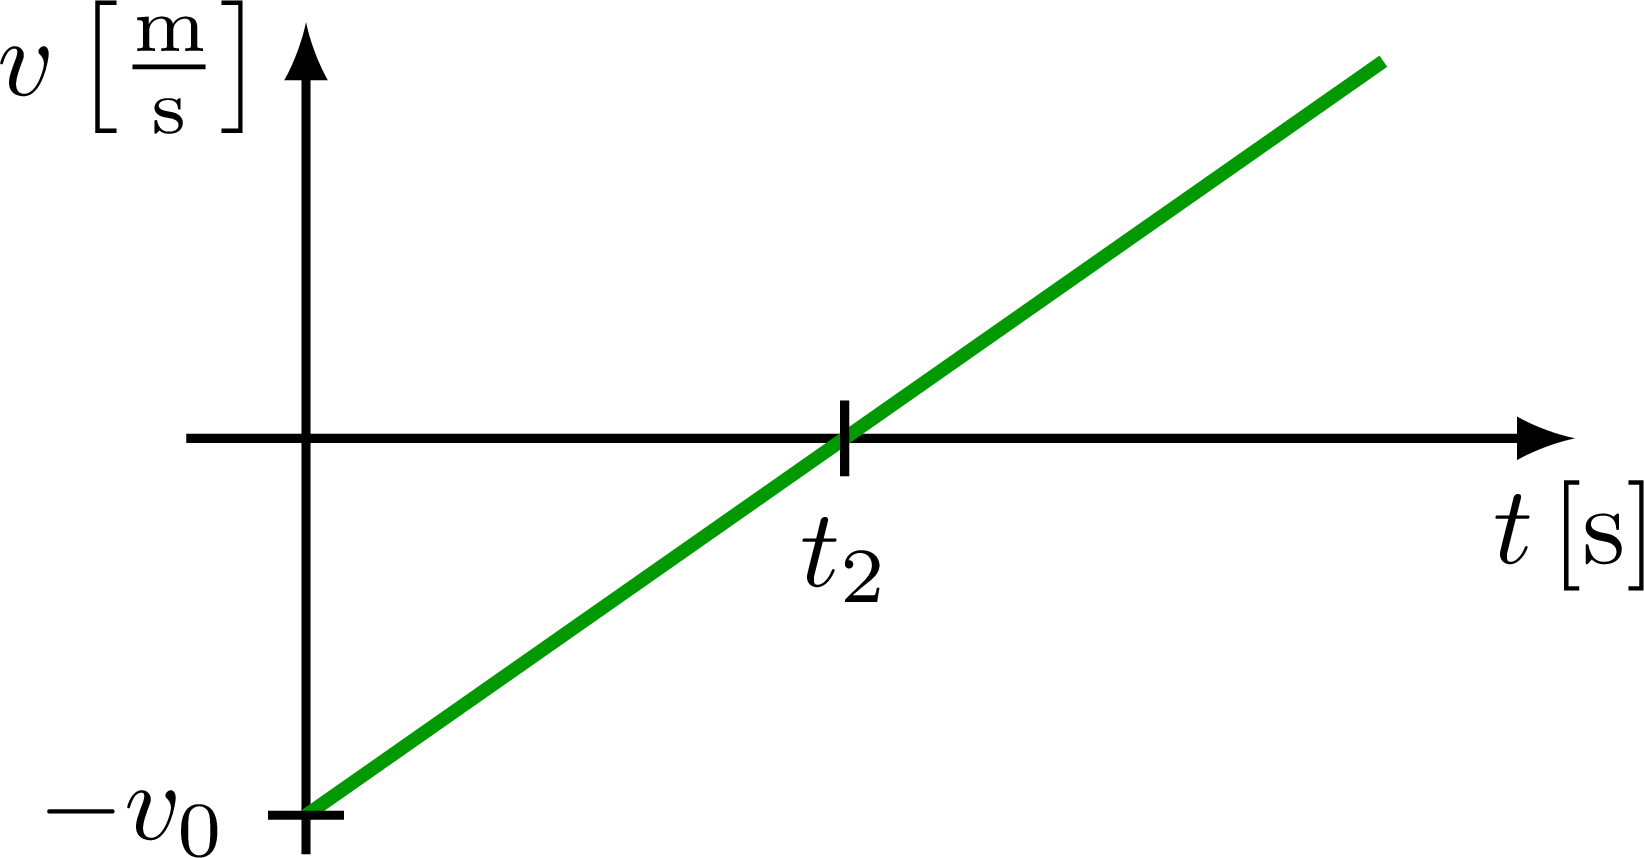
% VELOCITY - positive acceleration
\begin{tikzpicture}
\def\slope{0.7}
\draw[->,thick]
(-0.1*\xmax,0) -- (1.06*\xmax,0) node[below] {$t$\,[s]};
\draw[->,thick]
(0,-0.55*\ymax) -- (0,0.55*\ymax) node[below=4,left=0] {\vlabel};
\draw[vline,variable=\t,samples=\nsamples,smooth,domain=0:\root]
(0,-\slope*\tm) -- (0.9*\xmax,{\slope*(0.9*\xmax-\tm)});
\tick{\tm,0}{90} node[below] {$t_2$};
\tick{0,-\slope*\tm}{0} node[left] {$-v_0$};
\end{tikzpicture}
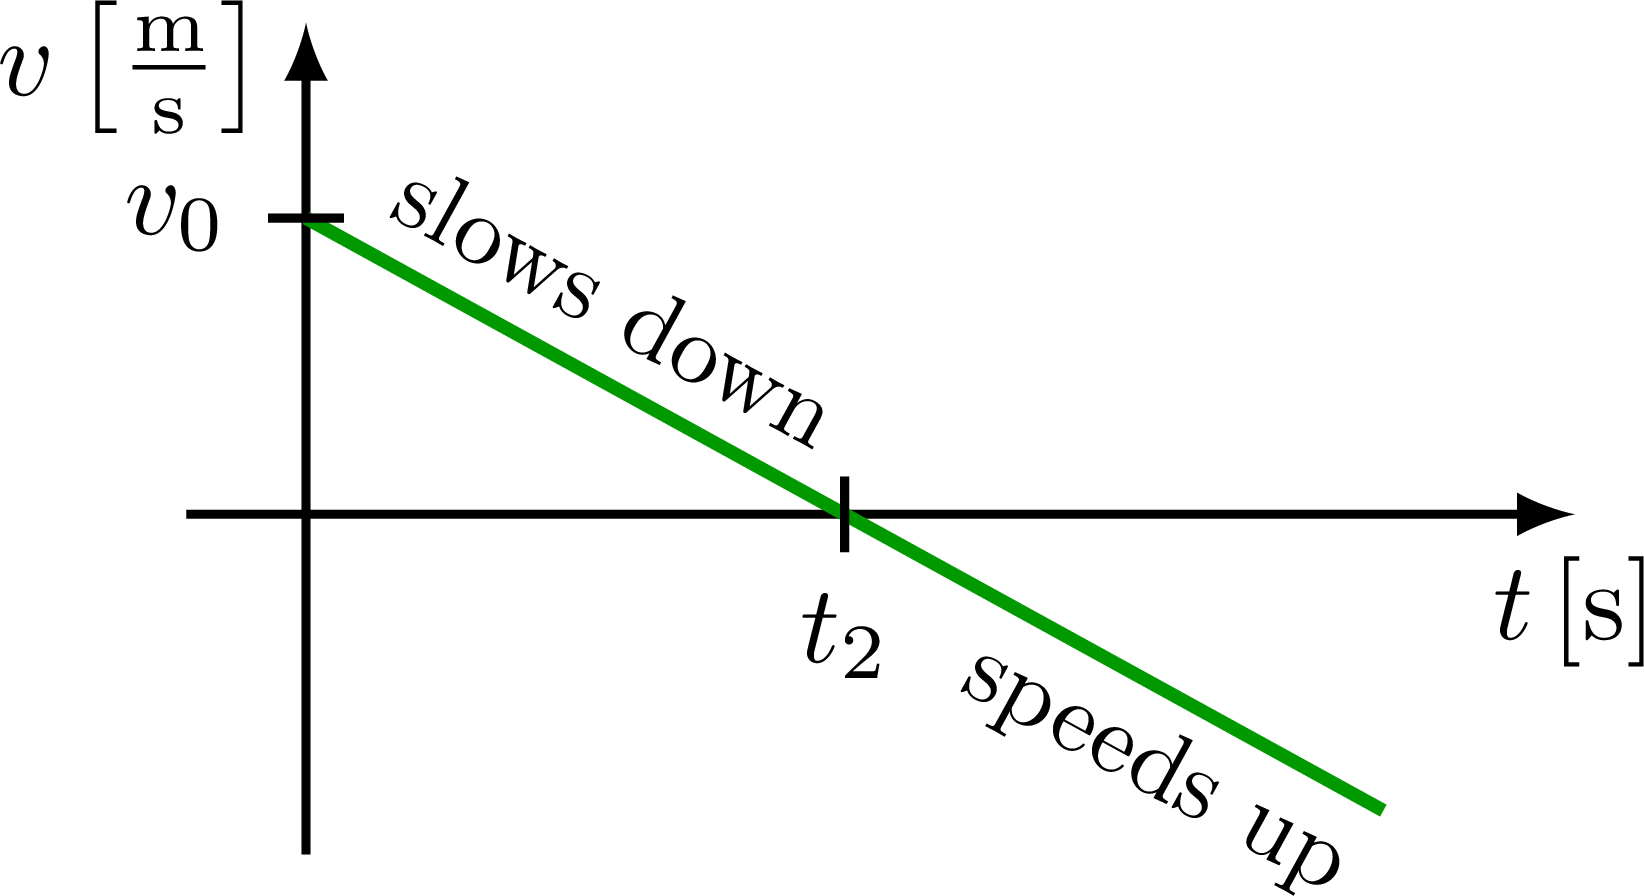
% VELOCITY - negative acceleration
\begin{tikzpicture}
\def\slope{0.55}
\def\ang{{atan(\slope)}}
\draw[->,thick]
(-0.1*\xmax,0) -- (1.06*\xmax,0) node[below] {$t$\,[s]};
\draw[->,thick]
(0,-0.45*\ymax) -- (0,0.65*\ymax) node[below=4,left=0] {\vlabel};
\draw[vline,variable=\t,samples=\nsamples,smooth,domain=0:\root]
(0,\slope*\tm) -- (0.9*\xmax,{-\slope*(0.9*\xmax-\tm)});
\tick{\tm,0}{90} node[below] {$t_2$};
\tick{0,\slope*\tm}{0} node[left] {$v_0$};
%\path (0,0) -- (\tm,0) node[midway,below,scale=1,align=center] {slows\\[-1mm]down};
%\path (\tm,0) -- (0.9*\xmax,0) node[midway,above,scale=1,align=center] {speeds\\[-1mm]up};
\node[right=4,above right=-1,scale=0.9,rotate=-\ang] at (0,\slope*\tm) {slows down};
\node[right=6,below right=6,scale=0.9,rotate=-\ang] at (\tm,0) {speeds up};
\end{tikzpicture}
\end{document}Click to download: kinematics_curves.tex • kinematics_curves.pdf
Open in Overleaf: kinematics_curves.tex