")


Edit and compile if you like:
% Author: Izaak Neutelings (June 2020)
% Inspiration: https://tex.stackexchange.com/questions/285578/how-to-draw-parallelepiped-and-cube-with-latex/288101#288101
\documentclass[border=3pt,tikz]{standalone}
\usepackage{amsmath}
\usepackage{siunitx}
\usepackage{physics}
\tikzset{>=latex} % for LaTeX arrow head
\colorlet{myblue}{blue!70!black}
\colorlet{mydarkblue}{blue!40!black}
\colorlet{mygreen}{green!60!black}
\colorlet{myred}{red!65!black}
\colorlet{mypurple}{red!50!blue!95!black!75}
\tikzstyle{wave}=[myblue,thick]
\tikzstyle{xline}=[very thick,myblue]
\tikzstyle{vline}=[very thick,mygreen]
\tikzstyle{aline}=[very thick,mypurple]
\tikzstyle{mydashed}=[mydarkblue,dashed]
\def\axis#1{
\draw[->,thick]
(-0.1*\xmax,0) -- (1.06*\xmax,0) node[below] {$t$\,[s]};
\draw[->,thick]
(0,-0.15*\ymax) -- (0,1.06*\ymax) node[above=4,below left] {#1};
}
\def\longaxis#1{
\draw[->,thick]
(-0.1*\xmax,0) -- (1.06*\xmax,0) node[below] {$t$\,[s]};
\draw[->,thick]
(0,-\ymax) -- (0,1.06*\ymax) node[above=4,below left] {#1};
}
\def\tick#1#2{\draw[thick] (#1) ++ (#2:0.05*\ymax) --++ (#2-180:0.1*\ymax)}
\def\vlabel{$v\left[\si{\frac{m}{s}}\right]$}
\def\alabel{$a\left[\si{\frac{m}{s^2}}\right]$}
\begin{document}
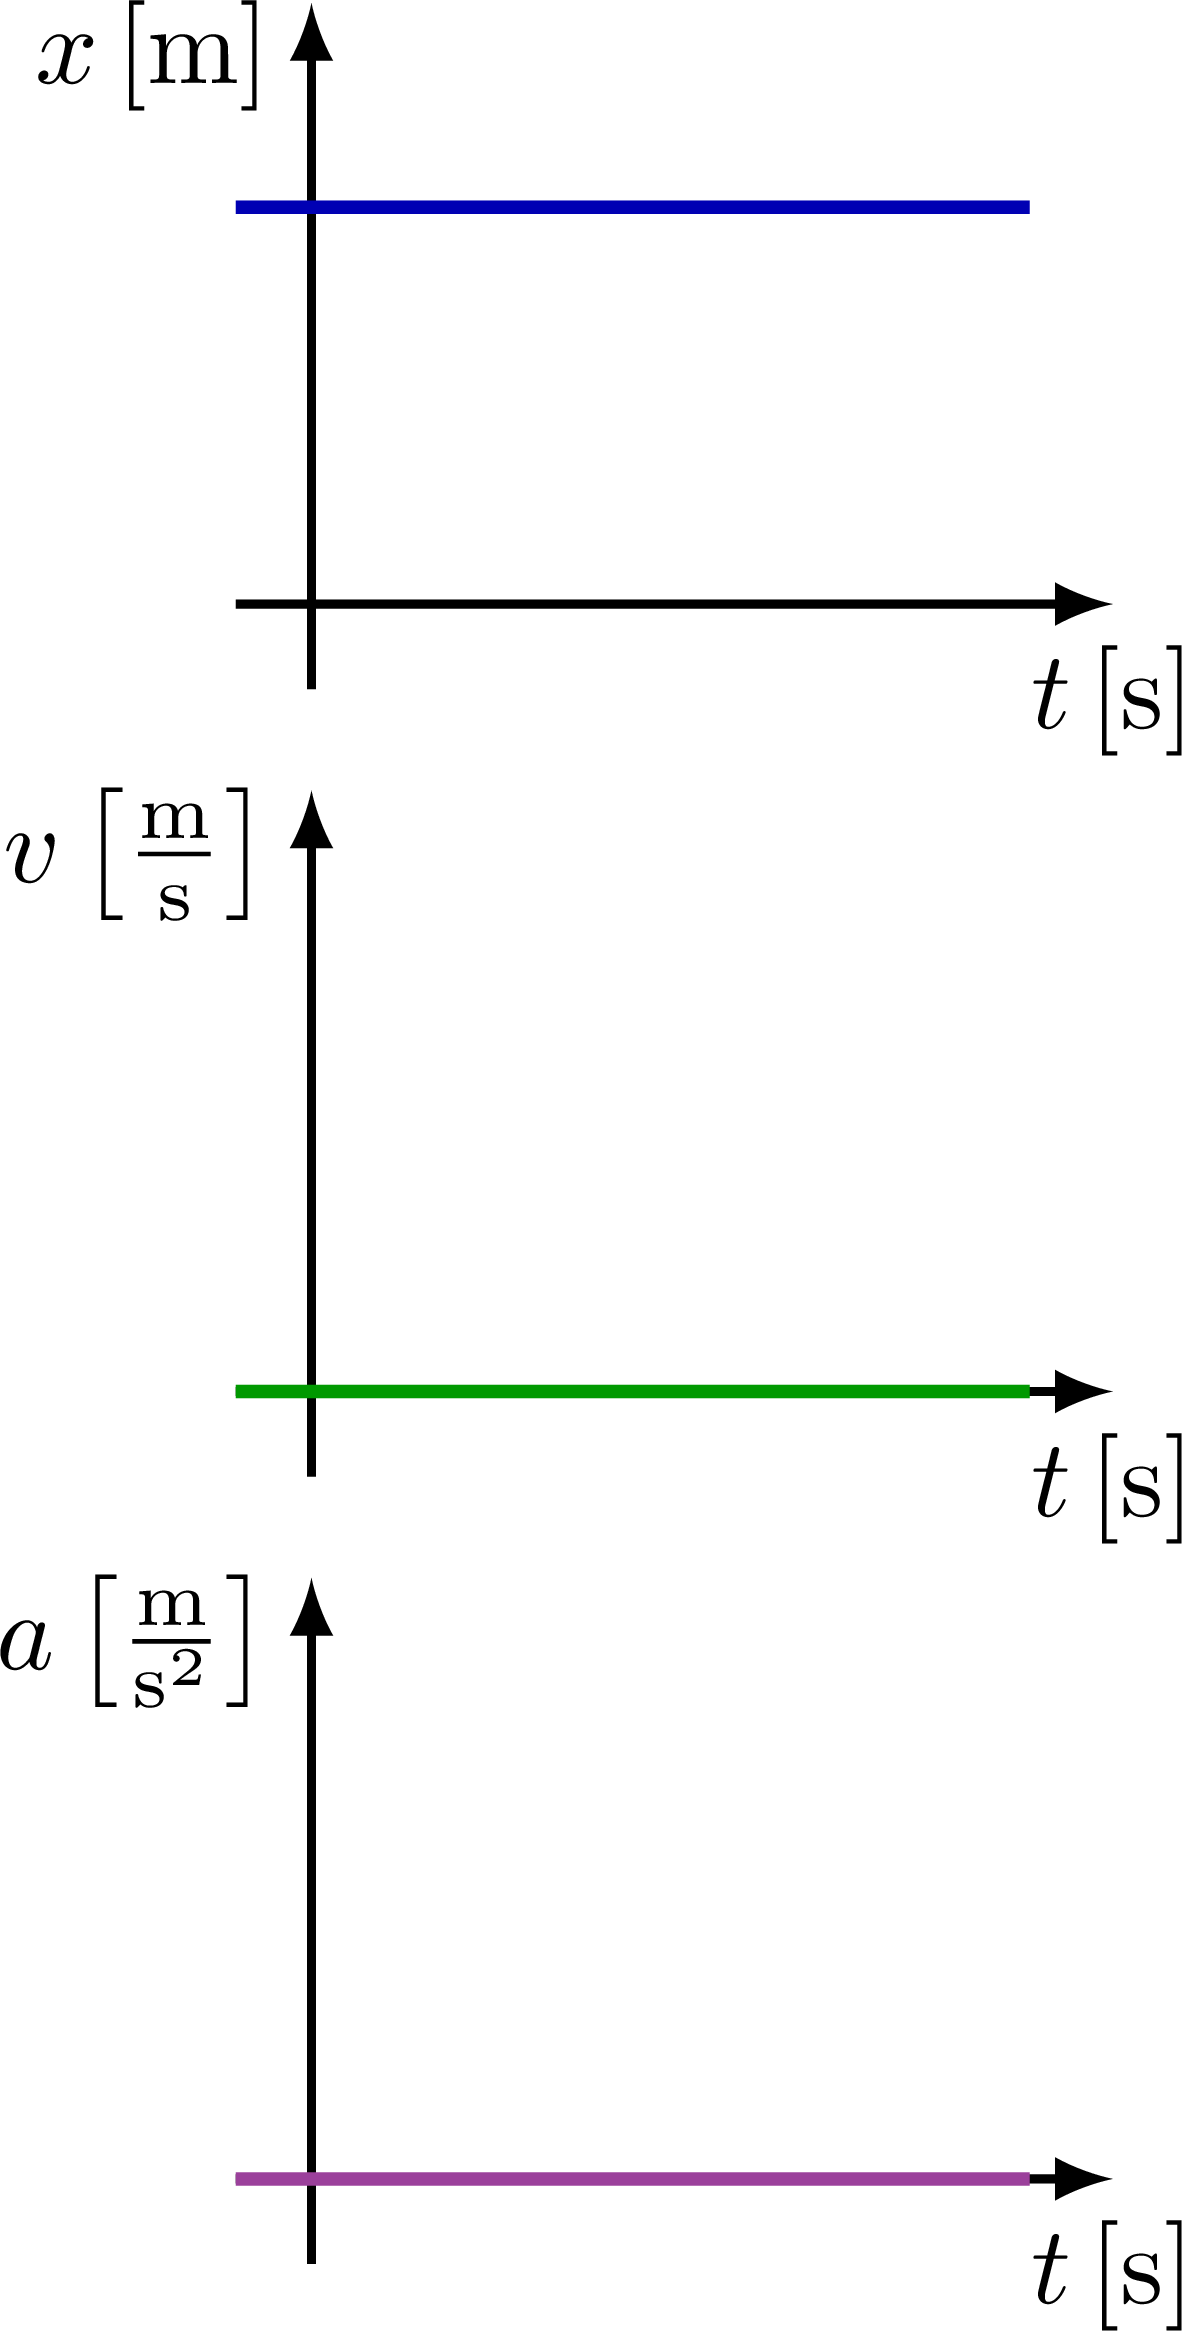
% CONSTANT POSITION
\def\xmax{2.4}
\def\ymax{1.8}
\def\h{2.5}
\def\nsamples{100}
\begin{tikzpicture}
% POSITION
\axis{$x$\,[m]}
\draw[xline] (-0.1*\xmax,0.7*\ymax) -- (0.95*\xmax,0.7*\ymax);
% VELOCITY
\begin{scope}[shift={(0,-\h)}]
\axis{\vlabel}
\draw[vline] (-0.1*\xmax,0) -- (0.95*\xmax,0);
\end{scope}
% ACCELERATION
\begin{scope}[shift={(0,-2*\h)}]
\axis{\alabel}
\draw[aline] (-0.1*\xmax,0) -- (0.95*\xmax,0);
\end{scope}
\end{tikzpicture}
% CONSTANT VELOCITY
\begin{tikzpicture}
% POSITION
\axis{$x$\,[m]}
\draw[xline] (0,0.2*\ymax) -- (0.95*\xmax,0.8*\ymax);
\tick{0,0.2*\ymax}{0} node[left=-2] {$x_0$};
% VELOCITY
\begin{scope}[shift={(0,-\h)}]
\axis{\vlabel}
\draw[vline] (0,0.6*\ymax) -- (0.95*\xmax,0.6*\ymax);
\tick{0,0.6*\ymax}{0} node[left=-2] {$v_0$};
\end{scope}
% ACCELERATION
\begin{scope}[shift={(0,-2*\h)}]
\axis{\alabel}
\draw[aline] (-0.1*\xmax,0) -- (0.95*\xmax,0);
\end{scope}
\end{tikzpicture}
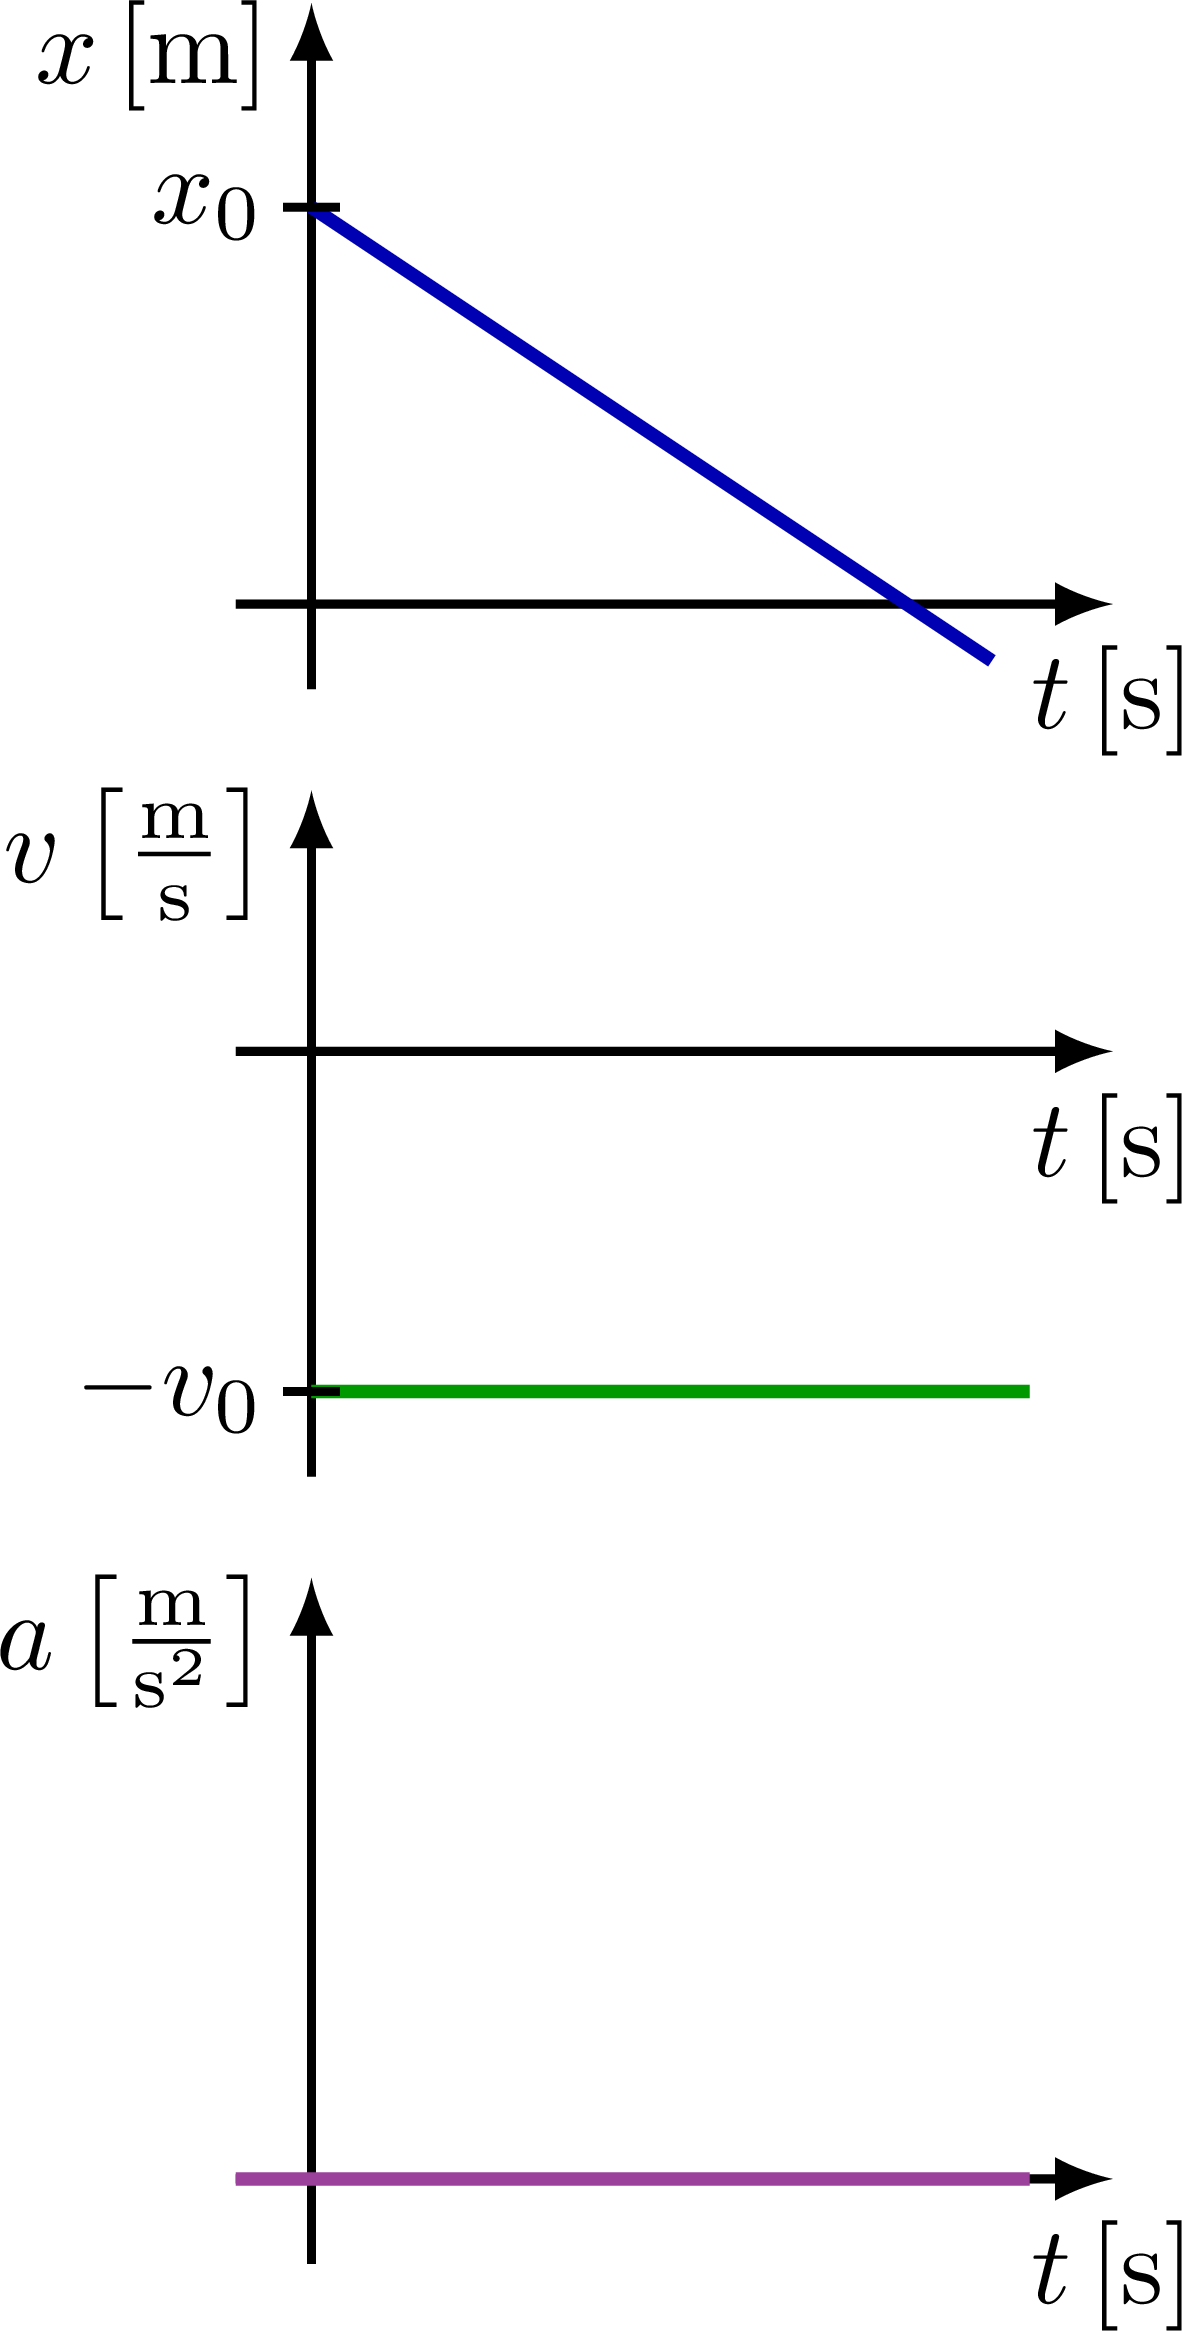
% CONSTANT VELOCITY - negative
\begin{tikzpicture}
% POSITION
\axis{$x$\,[m]}
\draw[xline] (0,0.7*\ymax) -- (0.90*\xmax,-0.1*\ymax);
\tick{0,0.7*\ymax}{0} node[left=-2] {$x_0$};
% VELOCITY
\begin{scope}[shift={(0,-\h+0.6*\ymax)}]
\draw[->,thick,black]
(-0.1*\xmax,0) -- (1.06*\xmax,0) node[below] {$t$\,[s]};
\draw[->,thick,black]
(0,-0.75*\ymax) -- (0,0.46*\ymax) node[above=4,below left] {\vlabel};
\draw[vline] (0,-0.6*\ymax) -- (0.95*\xmax,-0.6*\ymax);
\tick{0,-0.6*\ymax}{0} node[left=-2] {$-v_0$};
\end{scope}
% ACCELERATION
\begin{scope}[shift={(0,-2*\h)}]
\axis{\alabel}
\draw[aline] (-0.1*\xmax,0) -- (0.95*\xmax,0);
\end{scope}
\end{tikzpicture}
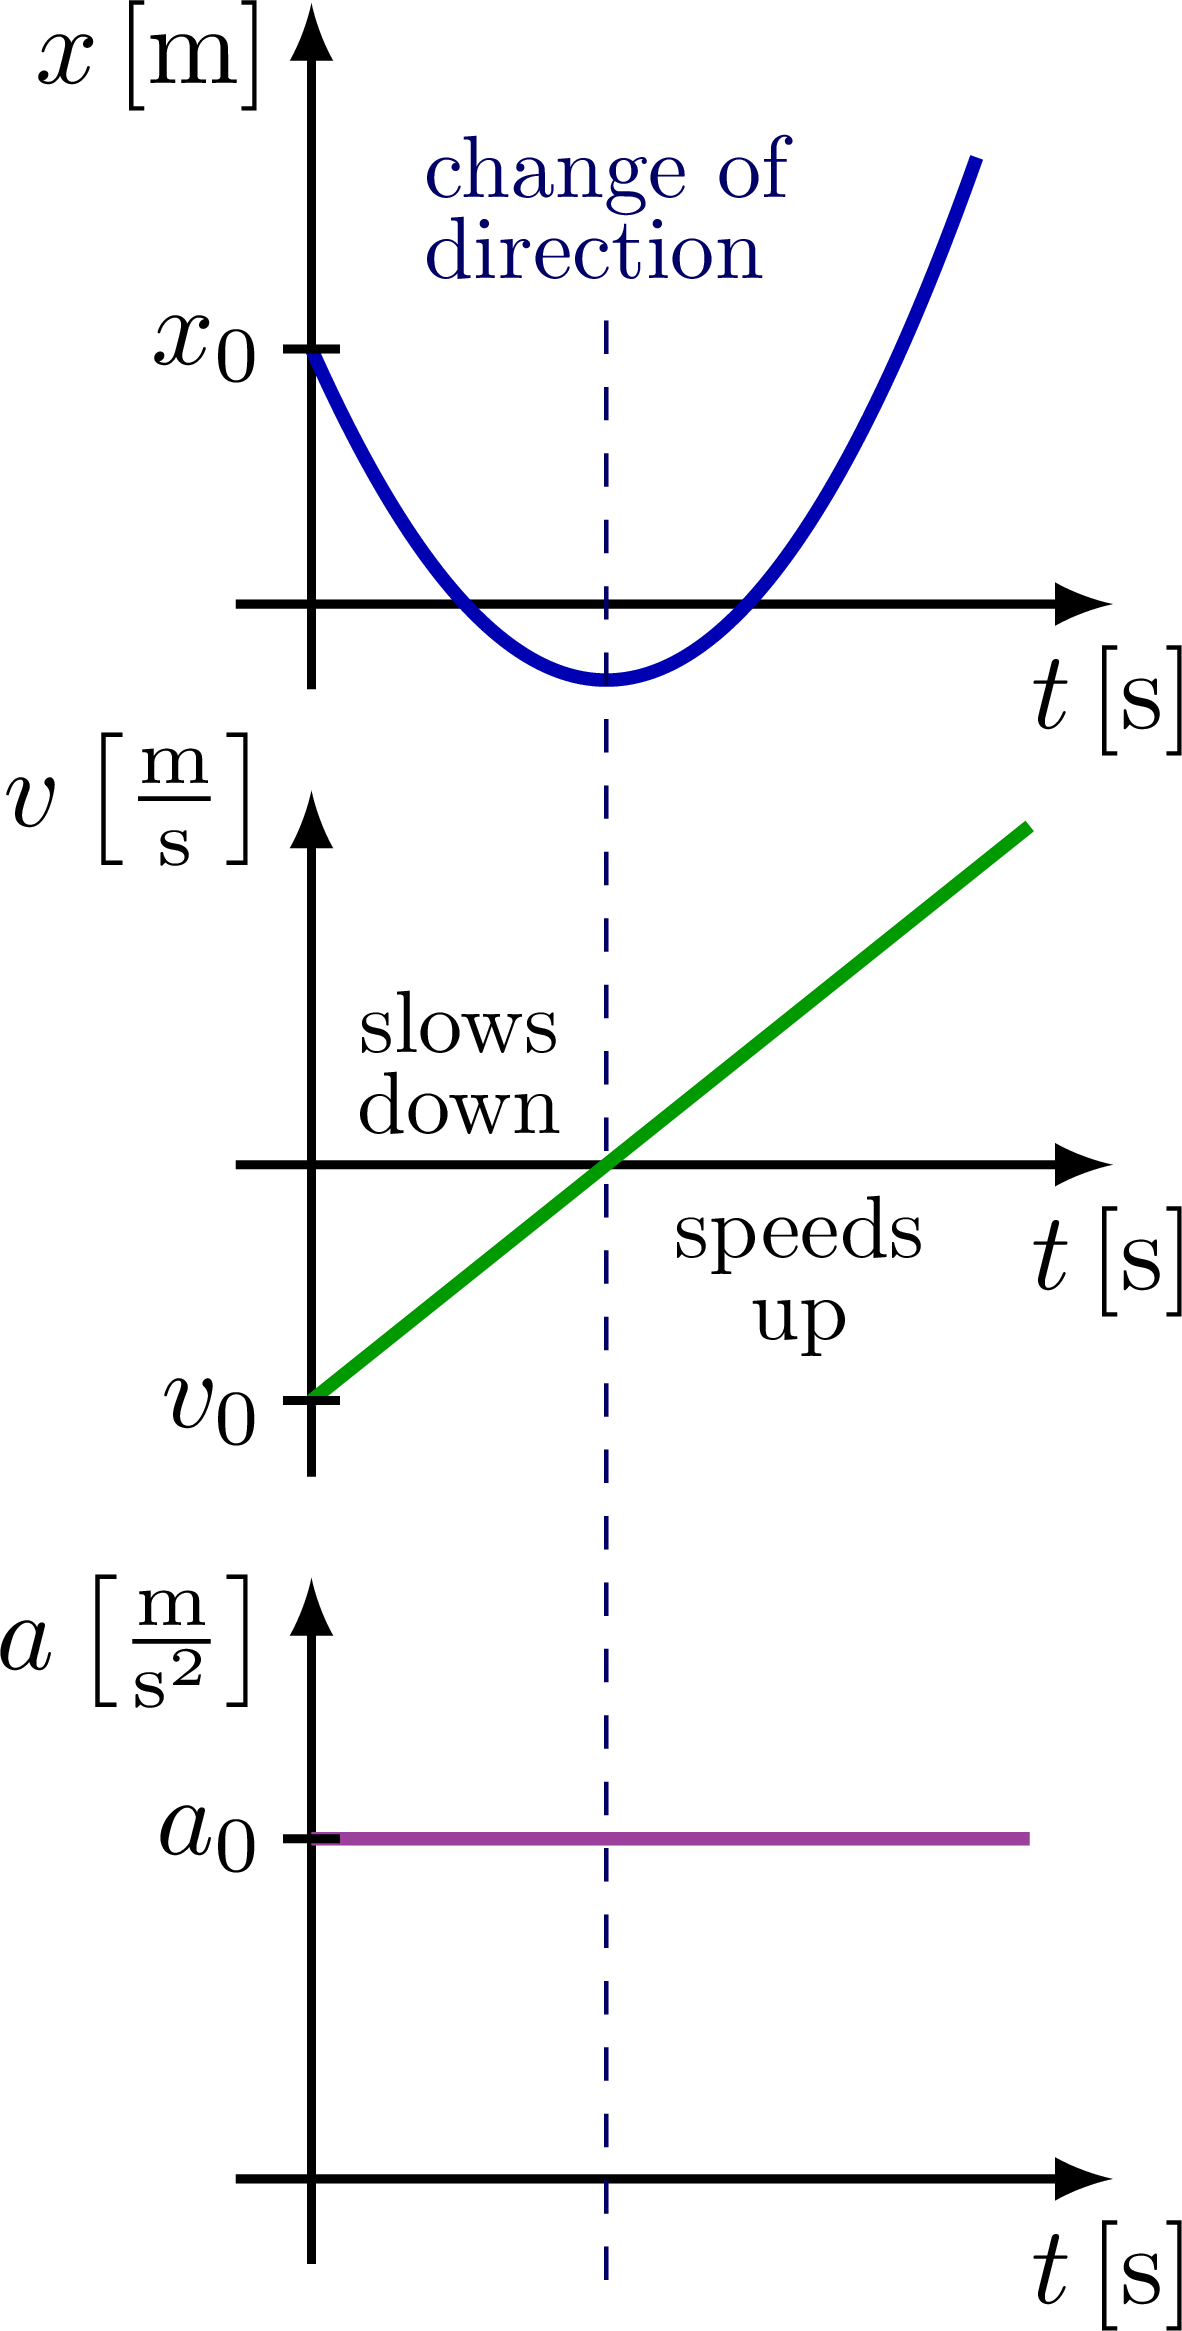
% CONSTANT ACCELERATION - positive
\begin{tikzpicture}
\def\A{1.2}
\def\slope{0.8}
\def\tm{0.39*\xmax}
\def\root{0.78*\xmax}
% POSITION
\axis{$x$\,[m]}
\draw[xline,variable=\t,samples=\nsamples,smooth,domain=0:0.88*\xmax]
plot(\t,{0.45*\ymax+\A*(-\root+\t)*\t});
\tick{0,0.45*\ymax}{0} node[left=-2] {$x_0$};
% VELOCITY
\begin{scope}[shift={(0,-\h+0.4*\ymax)}]
\draw[->,thick]
(-0.1*\xmax,0) -- (1.06*\xmax,0) node[below] {$t$\,[s]};
\draw[->,thick]
(0,-0.55*\ymax) -- (0,0.66*\ymax) node[above=9,below left] {\vlabel};
\draw[vline]
(0,-\slope*\tm) -- (0.95*\xmax,{-\slope*(\tm-0.95*\xmax)});
\tick{0,-\slope*\tm}{0} node[below=1,left=-2] {$v_0$};
\path (0,0) -- (\tm,0) node[midway,above,scale=0.8,align=center] {slows\\[-1mm]down};
\path (\tm,0) -- (0.9*\xmax,0) node[midway,below,scale=0.8,align=center] {speeds\\[-1mm]up};
\end{scope}
% ACCELERATION
\begin{scope}[shift={(0,-2*\h)}]
\axis{\alabel}
\draw[aline] (0,0.6*\ymax) --++ (0.95*\xmax,0);
\tick{0,0.6*\ymax}{0} node[left=-2] {$a_0$};
\end{scope}
% DASHED
\draw[mydashed]
(\tm,0.5*\ymax) node[above=1,scale=0.8,align=left] {change of\\[-1mm]direction}
-- (\tm,-2.15*\h);
\end{tikzpicture}
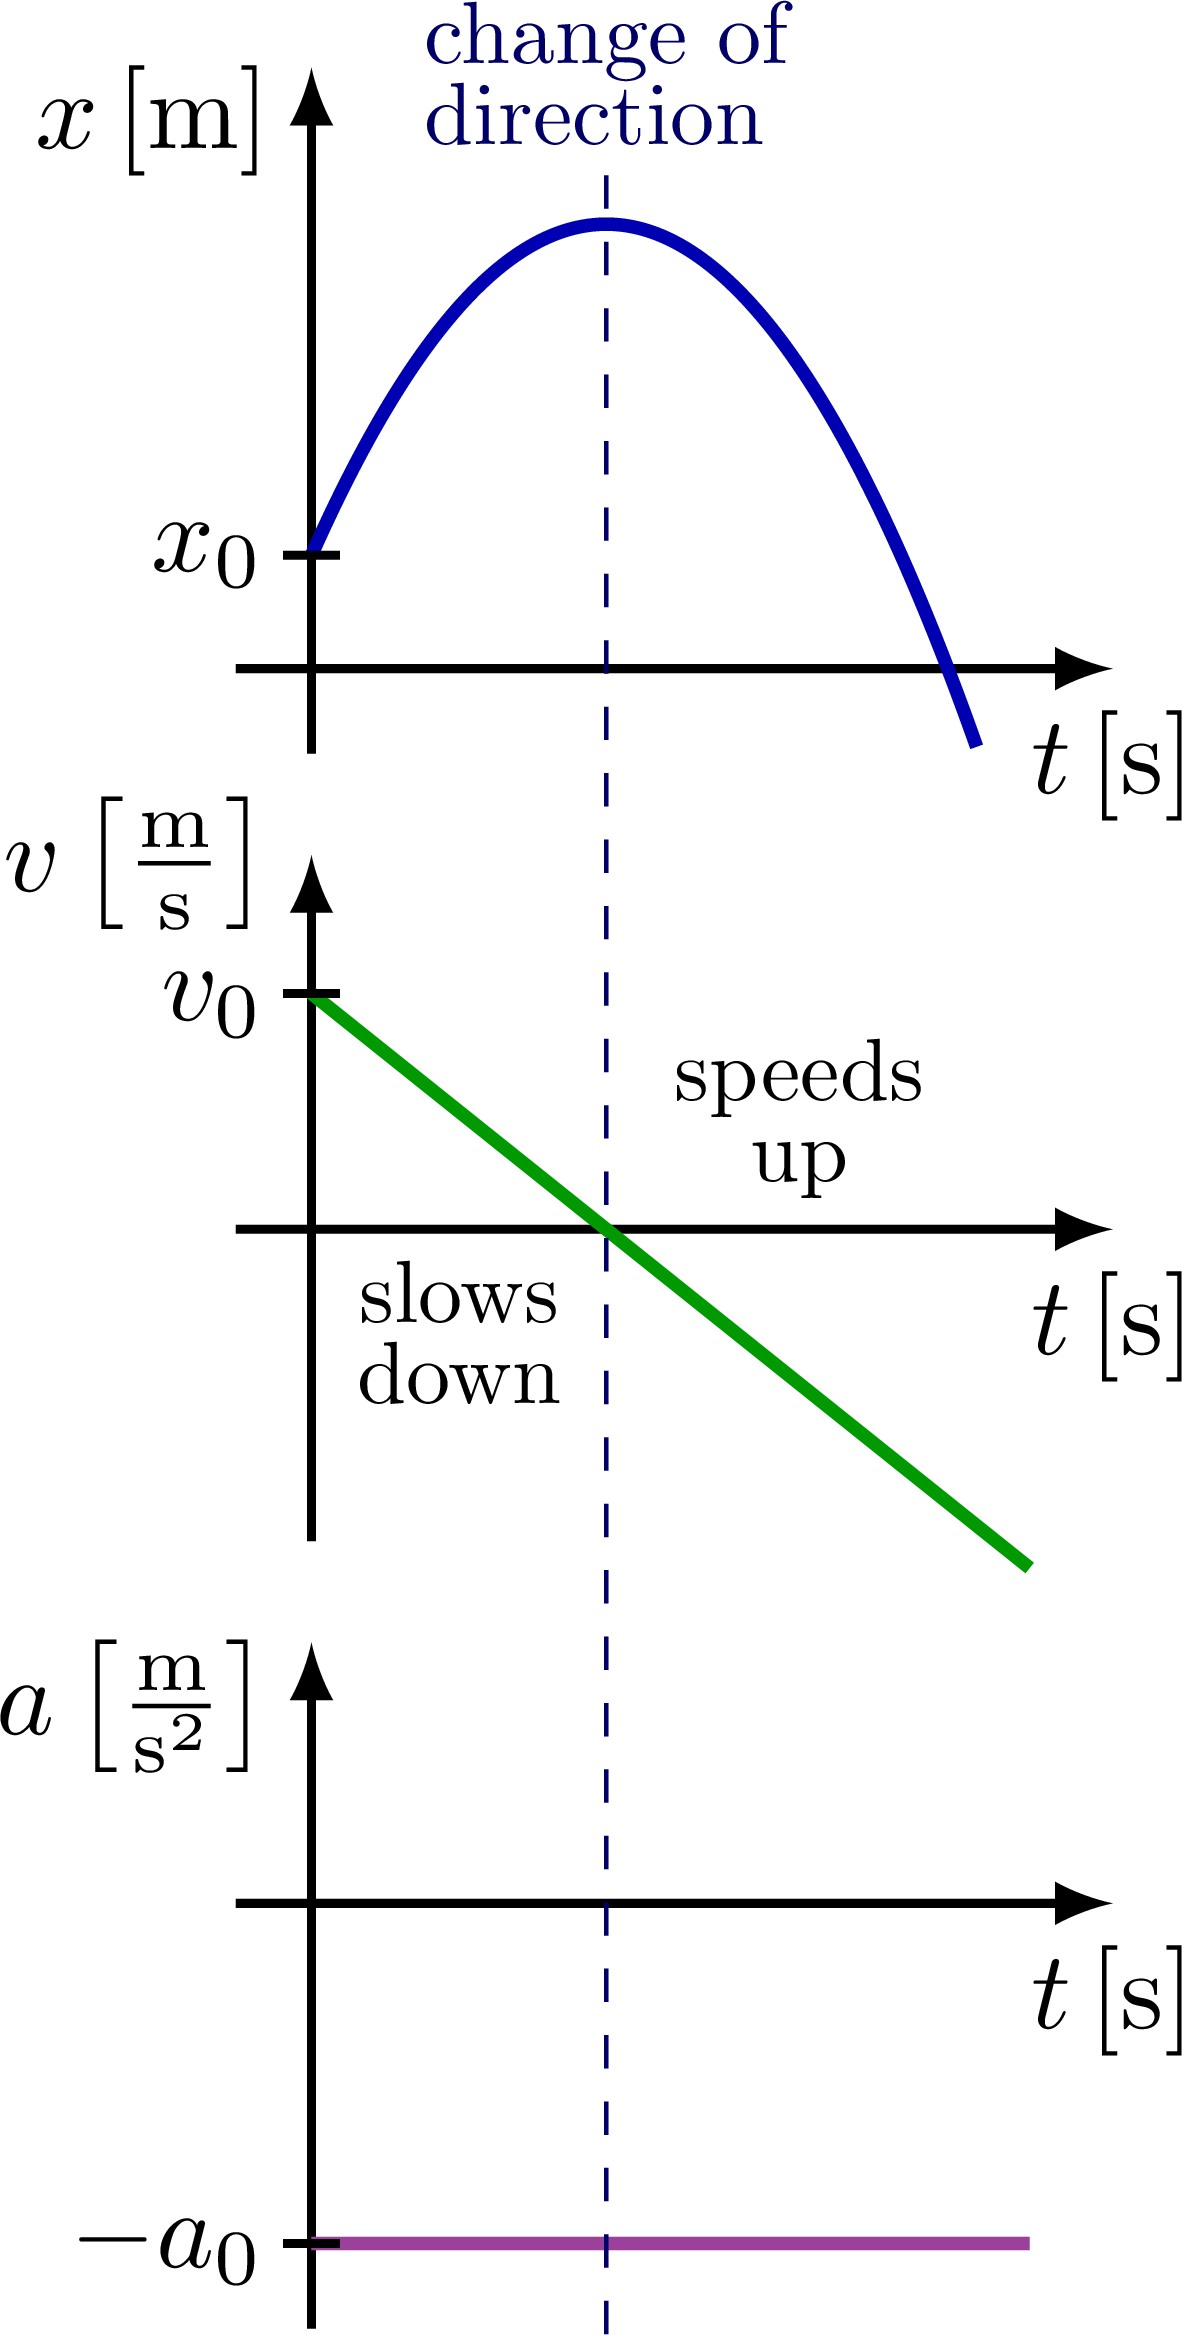
% CONSTANT ACCELERATION - negative
\begin{tikzpicture}
\def\A{1.2}
\def\slope{0.8}
\def\tm{0.39*\xmax}
\def\root{0.78*\xmax}
% POSITION
\axis{$x$\,[m]}
\draw[xline,variable=\t,samples=\nsamples,smooth,domain=0:0.88*\xmax]
plot(\t,{0.2*\ymax+\A*(\root-\t)*\t});
\tick{0,0.2*\ymax}{0} node[left=-2] {$x_0$};
% VELOCITY
\begin{scope}[shift={(0,-\h+0.4*\ymax)}]
\draw[->,thick]
(-0.1*\xmax,0) -- (1.06*\xmax,0) node[below] {$t$\,[s]};
\draw[->,thick]
(0,-0.55*\ymax) -- (0,0.66*\ymax) node[above=9,below left] {\vlabel};
\draw[vline]
(0,\slope*\tm) -- (0.95*\xmax,{\slope*(\tm-0.95*\xmax)});
\tick{0,\slope*\tm}{0} node[below=1,left=-2] {$v_0$};
\path (0,0) -- (\tm,0) node[midway,below,scale=0.8,align=center] {slows\\[-1mm]down};
\path (\tm,0) -- (0.9*\xmax,0) node[midway,above,scale=0.8,align=center] {speeds\\[-1mm]up};
\end{scope}
% ACCELERATION
\begin{scope}[shift={(0,-2*\h+0.6*\ymax)}]
\draw[->,thick]
(-0.1*\xmax,0) -- (1.06*\xmax,0) node[below] {$t$\,[s]};
\draw[->,thick]
(0,-0.75*\ymax) -- (0,0.46*\ymax) node[above=4,below left] {\alabel};
\draw[aline] (0,-0.6*\ymax) -- (0.95*\xmax,-0.6*\ymax);
\tick{0,-0.6*\ymax}{0} node[left=-2] {$-a_0$};
\end{scope}
% DASHED
\draw[mydashed]
(\tm,0.87*\ymax) node[above=0,scale=0.8,align=left] {change of\\[-1mm]direction}
-- (\tm,-2.15*\h);
%\draw[mydashed]
% (\tm,0.98*\ymax) -- (\tm,-2.15*\h);
%\node[right,scale=0.8,align=left] at (\tm,0.98*\ymax) {change of\\[-1mm]direction};
\end{tikzpicture}
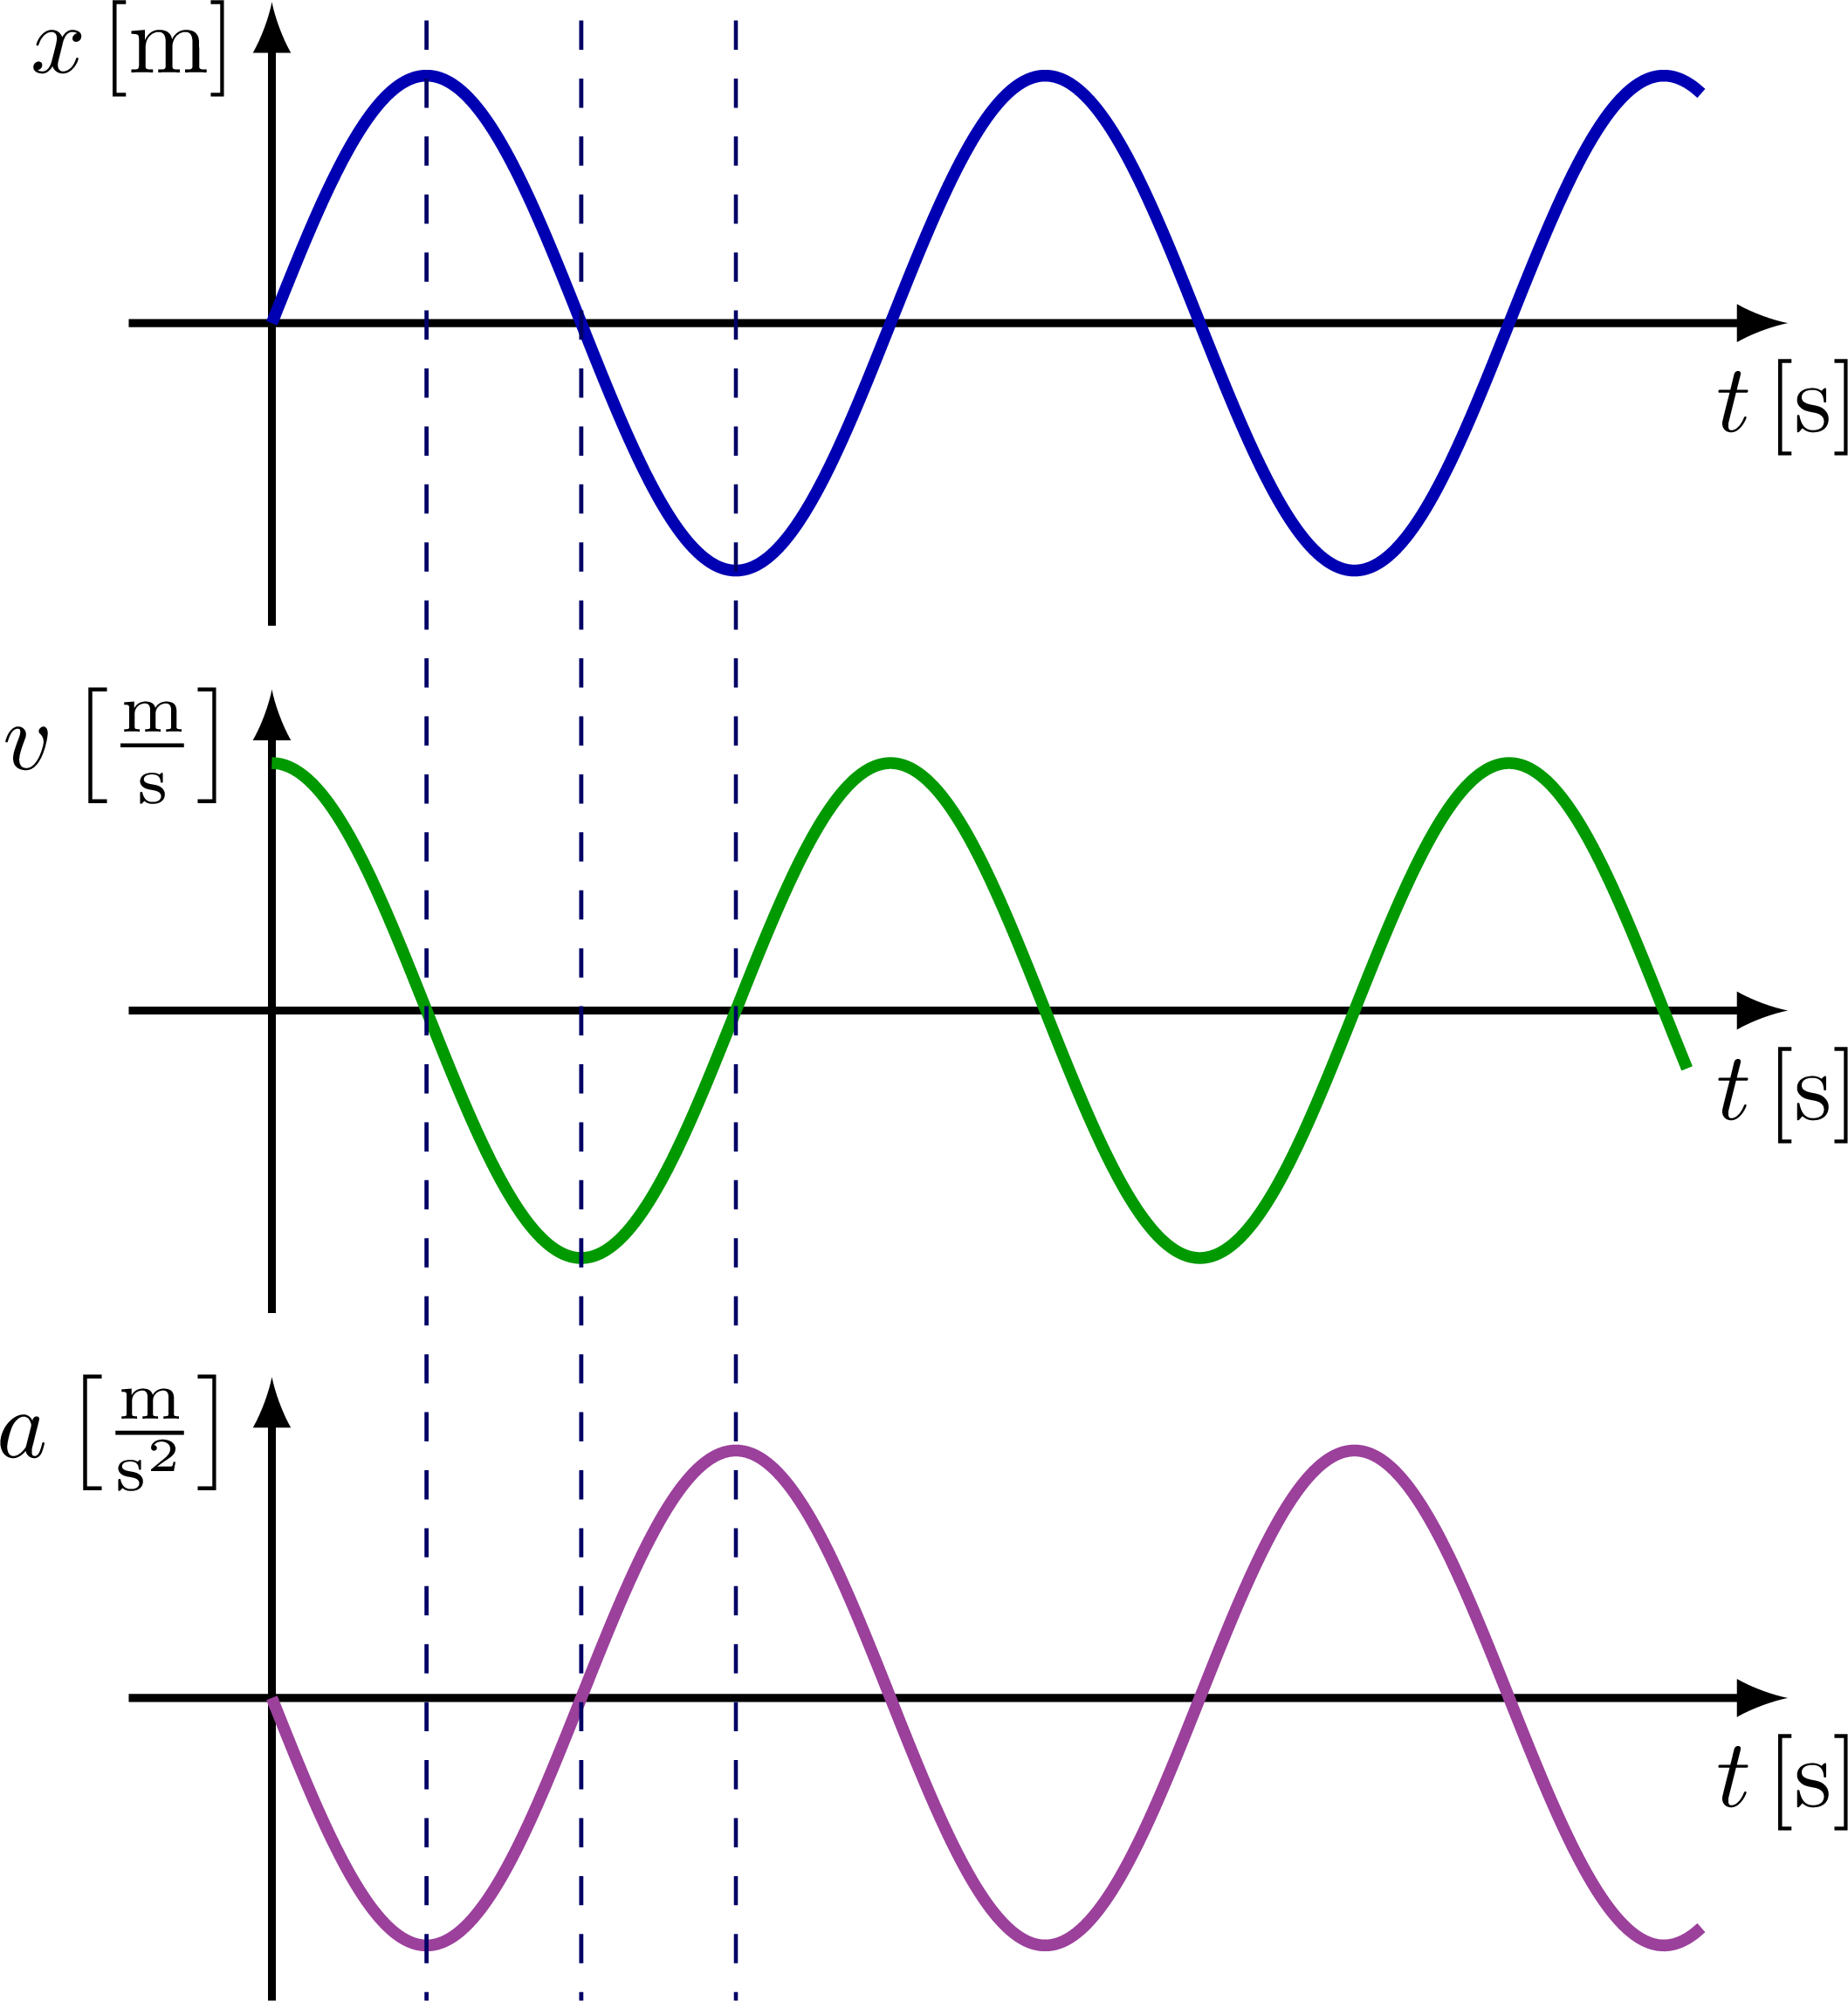
% SINES
\def\A{0.9}
\def\k{160}
\def\xmax{5.2}
\def\ymax{1.1}
\def\h{2.5}
\def\nsamples{200}
\begin{tikzpicture}
% POSITION
\longaxis{$x$\,[m]}
\draw[xline,variable=\x,samples=\nsamples,smooth,domain=0:\xmax]
plot(\x,{\A*sin(\k*\x)});
% VELOCITY
\begin{scope}[shift={(0,-\h)}]
\longaxis{\vlabel}
\draw[vline,variable=\x,samples=\nsamples,smooth,domain=0:0.99*\xmax]
plot(\x,{\A*cos(\k*\x)});
\end{scope}
% ACCELERATION
\begin{scope}[shift={(0,-2*\h)}]
\longaxis{\alabel}
\draw[aline,variable=\x,samples=\nsamples,smooth,domain=0:\xmax]
plot(\x,{-\A*sin(\k*\x)});
\end{scope}
% DASHED
\draw[mydashed]
(90/\k,\ymax) --++ (0,-2*\h-2*\ymax);
\draw[mydashed]
(180/\k,\ymax) --++ (0,-2*\h-2*\ymax);
\draw[mydashed]
(270/\k,\ymax) --++ (0,-2*\h-2*\ymax);
\end{tikzpicture}
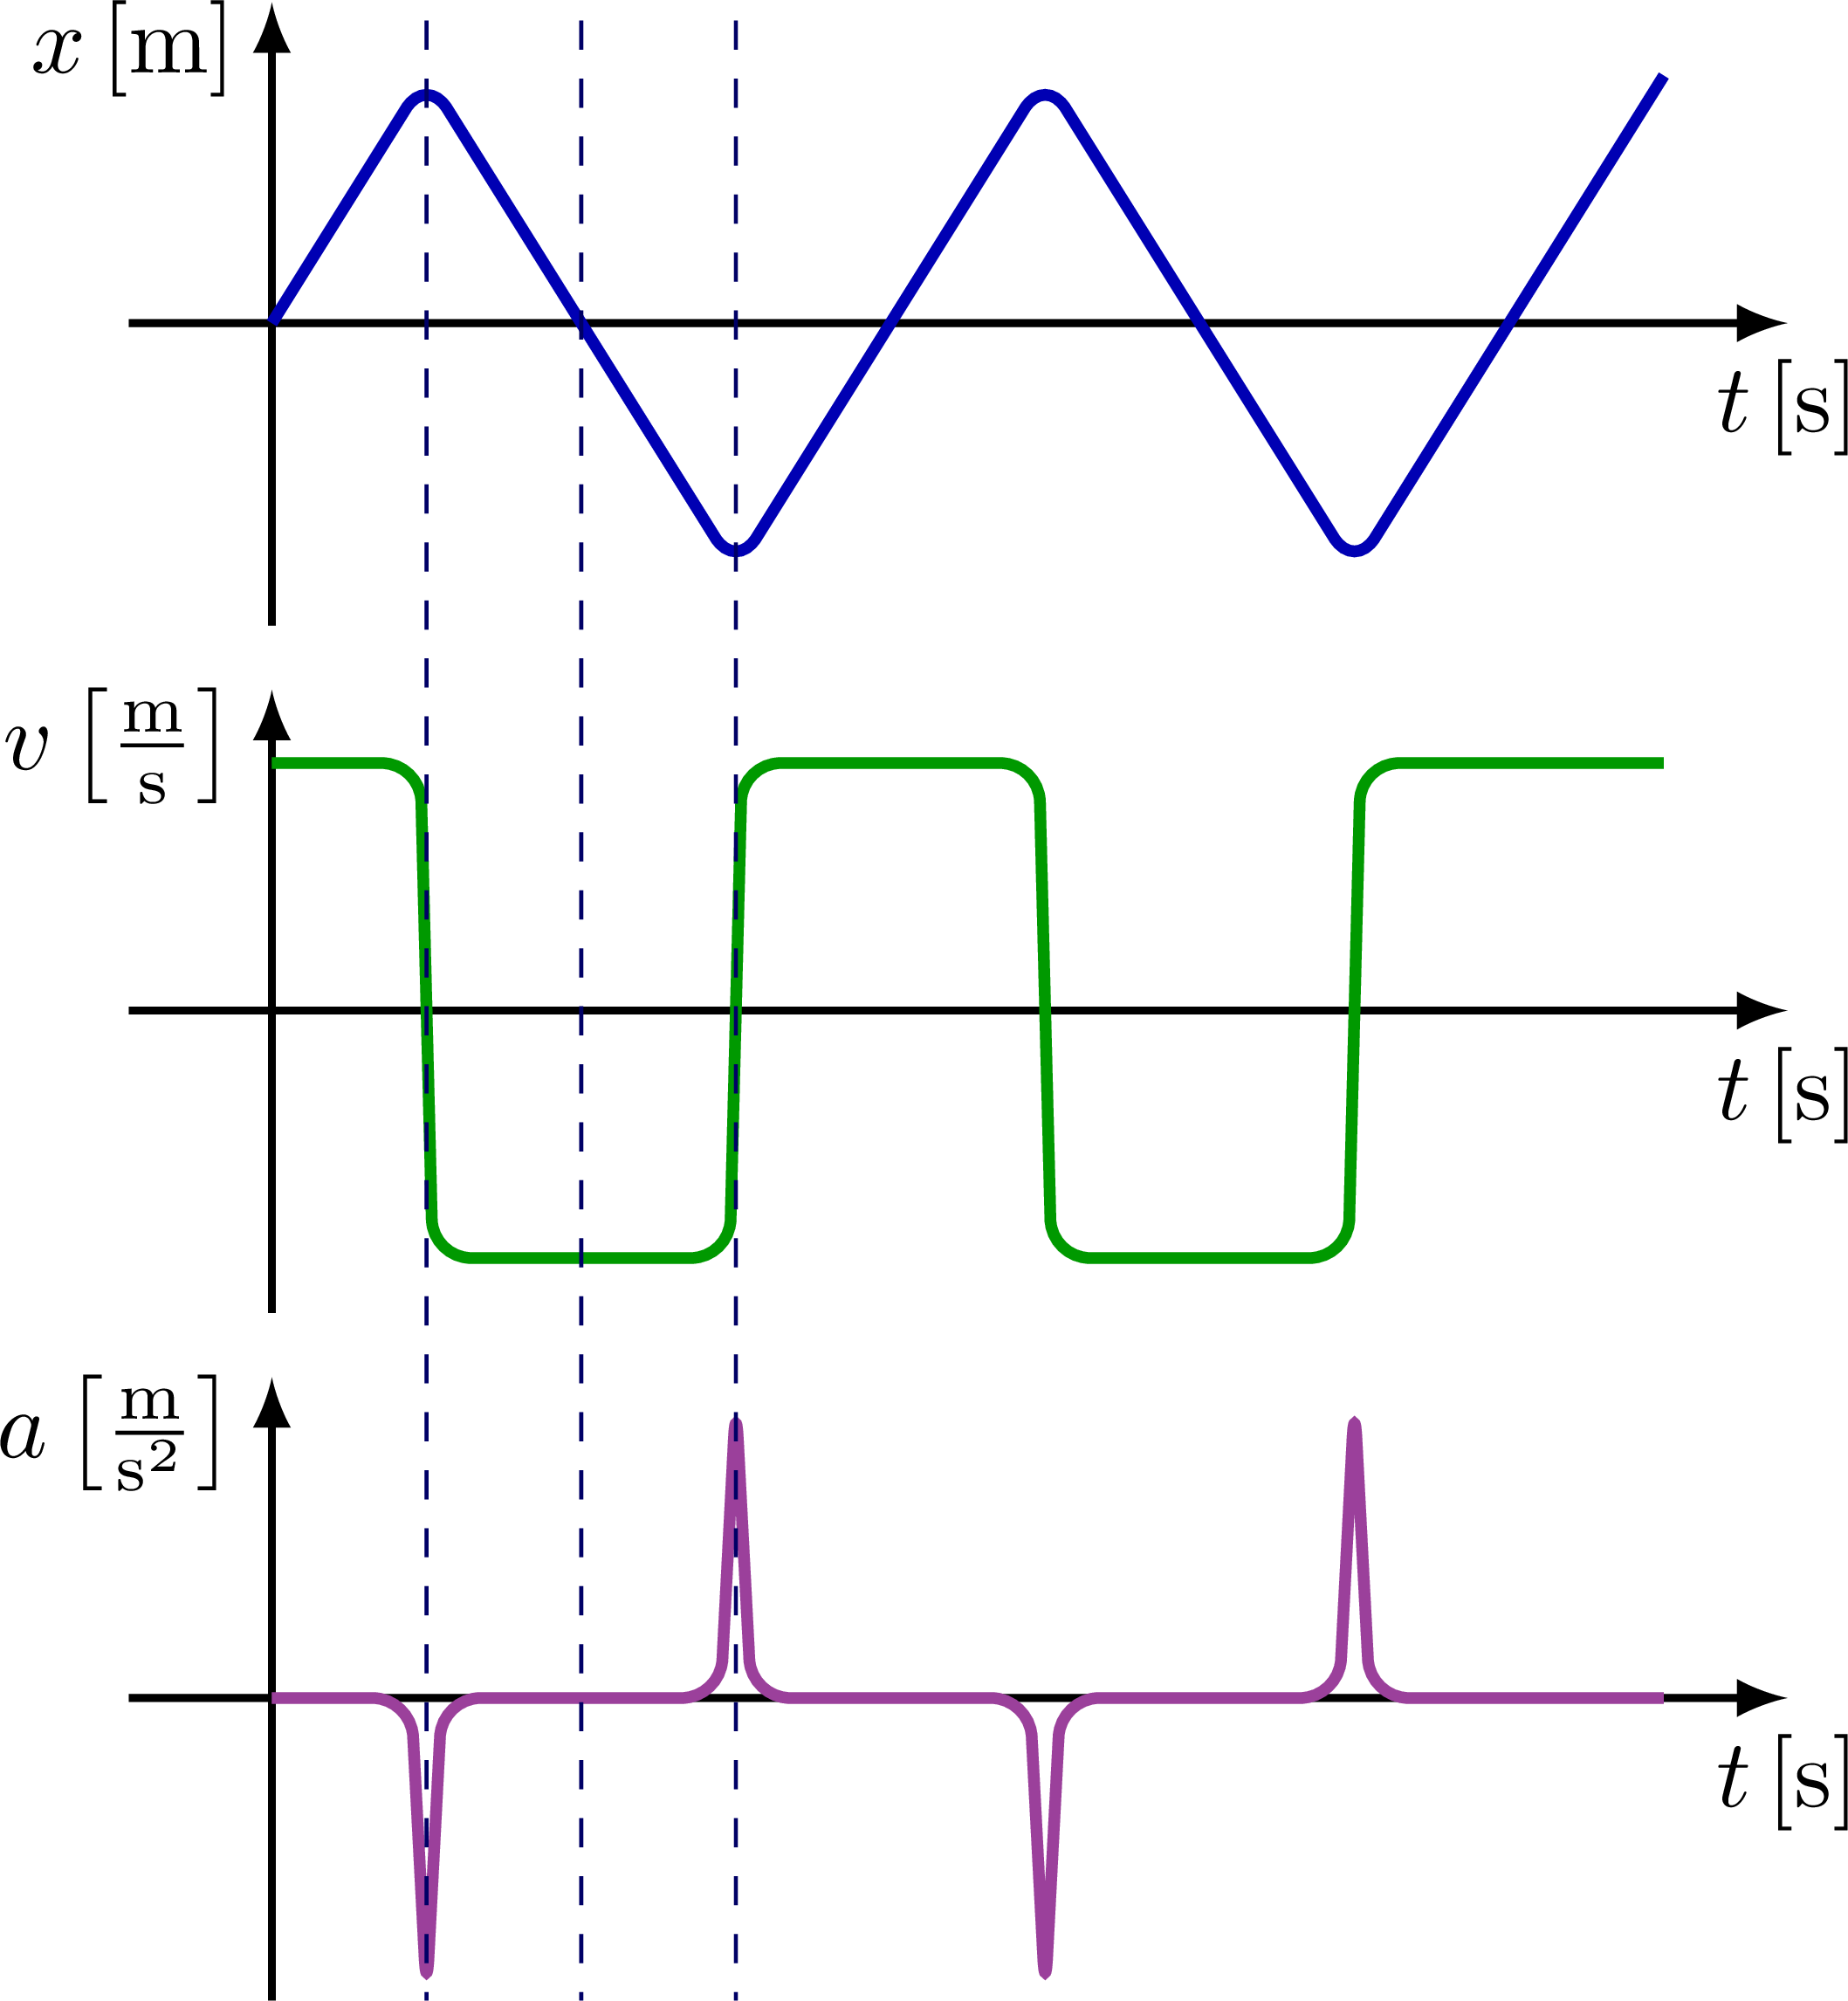
% TRIANGLE WAVE
\def\xscale{180/\k}
\begin{tikzpicture}
% POSITION
\longaxis{$x$\,[m]}
\draw[xline,rounded corners=4]
(0,0) \foreach \i in {1,2}{
-- ({(2*\i-1.5)*\xscale},\A) -- ({(2*\i-0.5)*\xscale},-\A)}
-- ({(4.5)*\xscale},\A);
% VELOCITY
\begin{scope}[shift={(0,-\h)}]
\longaxis{\vlabel}
\draw[vline,rounded corners=4]
(0,\A) \foreach \i in {1,2}{
-- ({(2*\i-1.52)*\xscale}, \A) -- ({(2*\i-1.48)*\xscale},-\A)
-- ({(2*\i-0.52)*\xscale},-\A) -- ({(2*\i-0.48)*\xscale}, \A)}
-- ({(4.5)*\xscale},\A);
\end{scope}
% ACCELERATION
\begin{scope}[shift={(0,-2*\h)}]
\longaxis{\alabel}
\draw[aline,rounded corners=4]
(0,0) \foreach \i in {1,2}{
-- ({(2*\i-1.55)*\xscale},0) -- ({(2*\i-1.5)*\xscale},-1.2*\A) -- ({(2*\i-1.45)*\xscale},0)
-- ({(2*\i-0.55)*\xscale},0) -- ({(2*\i-0.5)*\xscale}, 1.2*\A) -- ({(2*\i-0.45)*\xscale},0)}
-- ({(4.5)*\xscale},0);
\end{scope}
% DASHED
\draw[mydashed]
(90/\k,\ymax) --++ (0,-2*\h-2*\ymax);
\draw[mydashed]
(180/\k,\ymax) --++ (0,-2*\h-2*\ymax);
\draw[mydashed]
(270/\k,\ymax) --++ (0,-2*\h-2*\ymax);
\end{tikzpicture}
\end{document}Click to download: kinematics_curves_xva.tex • kinematics_curves_xva.pdf
Open in Overleaf: kinematics_curves_xva.tex