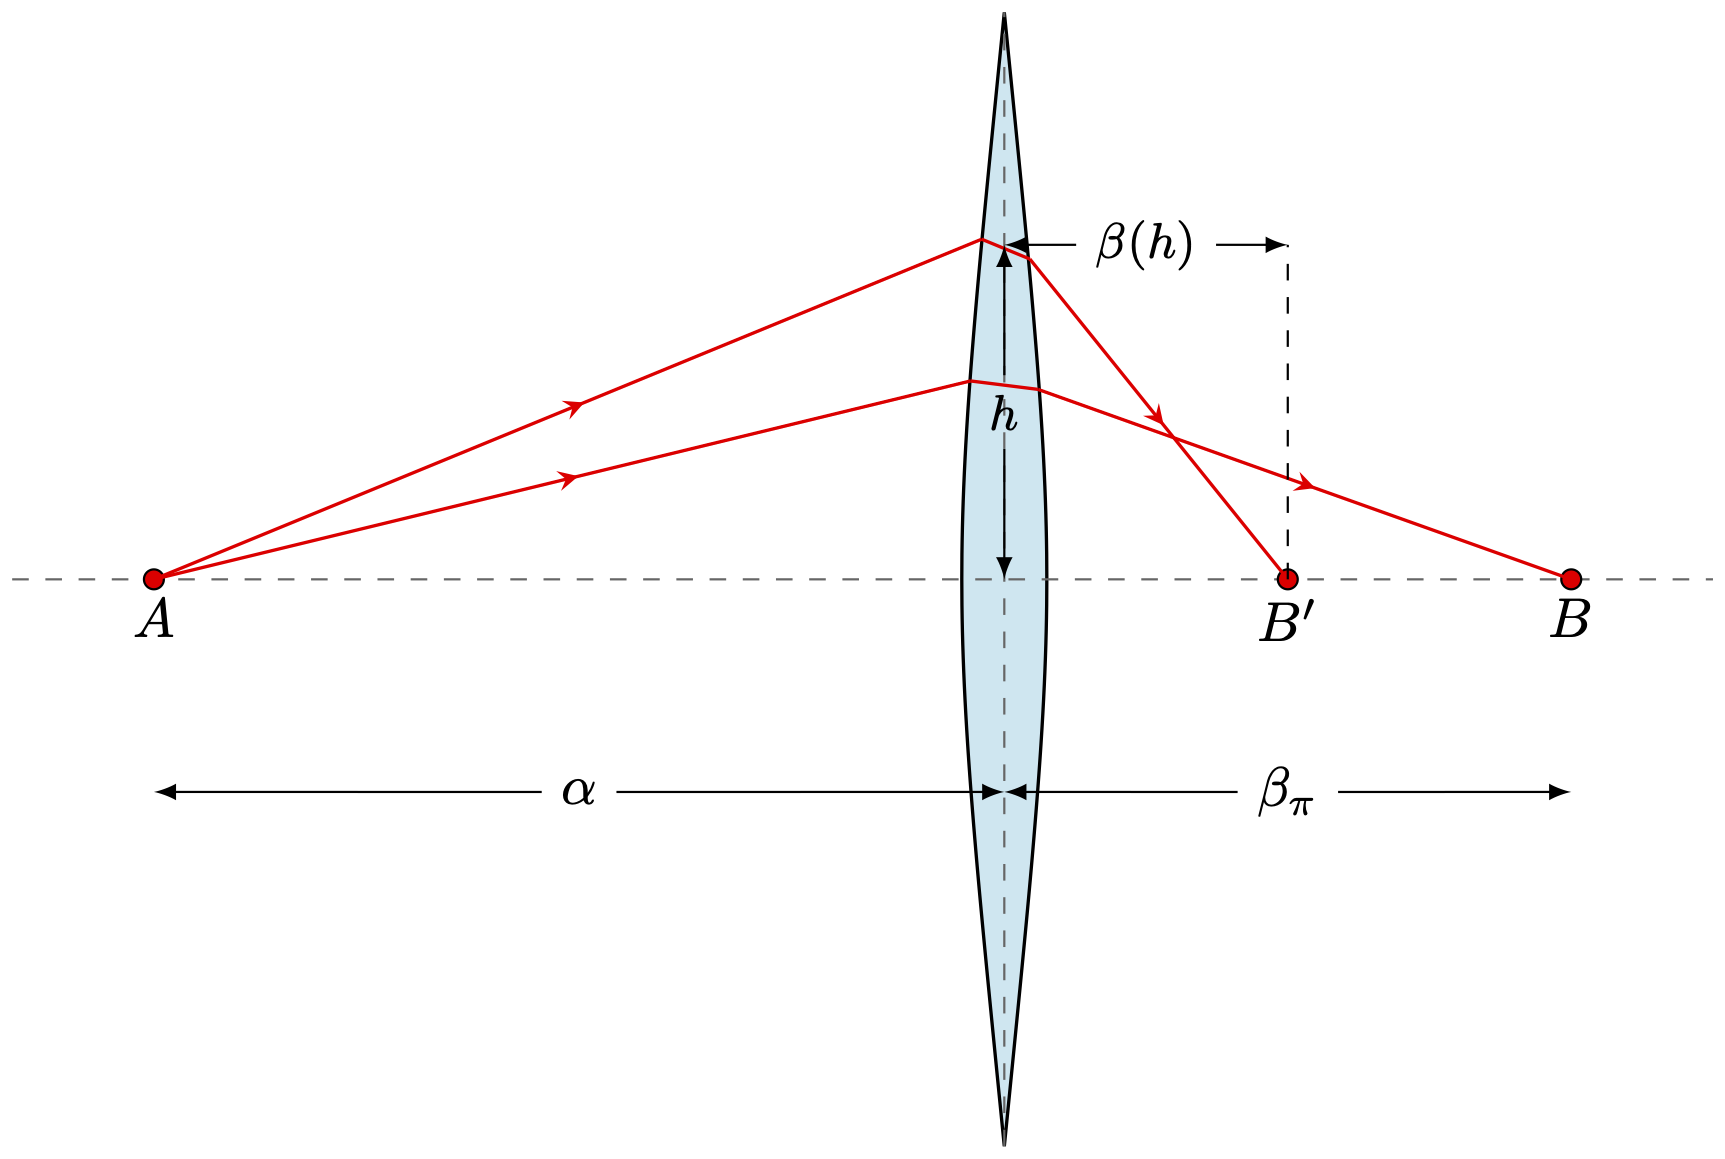
Edit and compile if you like:
\documentclass[border=2pt]{standalone}%Drawing\usepackage{tikz}\tikzset{>=latex}\usetikzlibrary{calc, decorations.markings}%Styles%%Arrow in the Middle\tikzset{arrow inside/.style = {postaction=decorate,decoration={markings,mark=at position 0.52 with \arrow{stealth}}}}%Newcommand%%Midline Label\newcommand{\midlinelabel}[3]{\node (midlabel) at ($ (#1)!.5!(#2) $) {#3};\draw[<-] (#1) -- (midlabel);\draw[->] (midlabel) -- (#2);}% Define Color\definecolor{glass}{cmyk}{0.2,0,0,0}\begin{document}\begin{tikzpicture}[scale=1.8]% Grid% \draw[help lines] (-3,-3) grid (6,6);% Lens\path[fill=glass, draw=black, line width = 0.6] (1,-2) .. controls (0.8,0) .. (1,2) .. controls (1.2,0) .. (1,-2);% Axis\draw[dashed, black!60] (1,-2) -- +(0,4);\draw[dashed, black!60] (-2.5,0) -- (3.5,0);% Points\draw[fill=red] (-2,0) circle (1pt) node[below] {$A$};\draw[fill=red] (3,0) circle (1pt) node[below] {$B$};\draw[fill=red] (2,0) circle (1pt) node[below] {$B'$};%Rays
Click to download: lens-errors.tex
Open in Overleaf: lens-errors.tex
This file is available on GitHub.
See more on the author page of Alexandros Tsagkaropolulos.


Hello! Thank you for making your codes available.
I modified your code to how image formation in a convex lens (see code below). I was wondering if there would be a way to further modify it, so that by changing the position of the object, it would automatically change the rays and image. My skills are not that great yet! hehehe
Thank you,
Wagner.
\documentclass[border=2pt]{standalone}
%Drawing
\usepackage{tikz}
\tikzset{>=latex}
\usetikzlibrary{calc, decorations.markings}
%Styles
%%Arrow in the Middle
\tikzset{arrow inside/.style = {postaction=decorate,decoration={markings,mark=at position 0.52 with \arrow{stealth}}}}
%Newcommand
%%Midline Label
\newcommand{\midlinelabel}[3]{
\node (midlabel) at ($ (#1)!.5!(#2) $) {#3};
\draw[] (midlabel) — (#2);
}
% Define Color
\definecolor{glass}{cmyk}{0.2,0,0,0}
\begin{document}
\begin{tikzpicture}[scale=1.8]
% Grid
% \draw[help lines] (-3,-3) grid (6,6);
% Lens
\path[fill=glass, draw=black, line width = 0.6] (1,-2) .. controls (0.8,0) .. (1,2) .. controls (1.2,0) .. (1,-2);
% Axis
\draw[dashed, black!60] (1,-2) — +(0,4);
\draw[black!60] (-4,0) — (6,0) node[below]{\small Principal Axis};
% Points
\draw[fill=red] (-2,0) circle (0.5pt) node[below] {$2f$};
\draw[fill=red] (-0.5,0) circle (0.5pt) node[below] {$f$};
\draw[fill=magenta] (1,0) circle (0.5pt) node[below] {$C$};
\draw[fill=red] (2.5,0) circle (0.5pt) node[below] {$f$};
\draw[fill=red] (4,0) circle (0.5pt) node[below] {$2f$};
%Rays
%%1
\draw[red, line width = 0.6, arrow inside] (-3.,1.2) — (1,0);
%\draw[red, line width = 0.6] (0.88,0.7) — (1.12,0.67);
\draw[red, line width = 0.6, arrow inside] (1,0) — (5,-1.2);
%%2
\draw[red, line width = 0.6, arrow inside] (-3.,1.2) — (0.92,1.2);
\draw[red, line width = 0.6] (0.92,1.2) — (1.09,1.13);
\draw[red, line width = 0.6, arrow inside] (1.09,1.13) — (4.5,-1.6);
%%3
\draw[red, line width = 0.6, arrow inside] (-3.,1.2) — (0.875,-0.658);
\draw[red, line width = 0.6] (0.875,-0.658) — (1.11,-0.72);
\draw[red, line width = 0.6, arrow inside] (1.11,-0.72) — (4.5,-0.72);
% Distances
%\midlinelabel{-2,-0.75}{1,-0.75}{$\alpha$}
\midlinelabel{1,0.1}{2.5,0.1}{$F$}
%\midlinelabel{1,0}{1,1.18}{\small$h$}
%\midlinelabel{1,1.18}{2,1.18}{\small$\beta(h)$}
% Dashed
%\draw[dashed] (2,0) — (2,1.18);
%Object and Image
\draw[->, thick, blue] (-3,0) node[below]{\small $Object$} –++ (0,1.2);
\draw[->, thick, cyan] (3.4,0) node[above]{\small $Image$} –++ (0,-0.72);
\end{tikzpicture}
\end{document}