")


For more figures related to the definition of coordinate systems, please have a look at the “coordinates” tag.
Edit and compile if you like:
\documentclass[border=2pt]{standalone}
% Drawing
\usepackage{tikz}
\usepackage{tikz-3dplot}
% Styles
\tikzset{>=latex}
\begin{document}
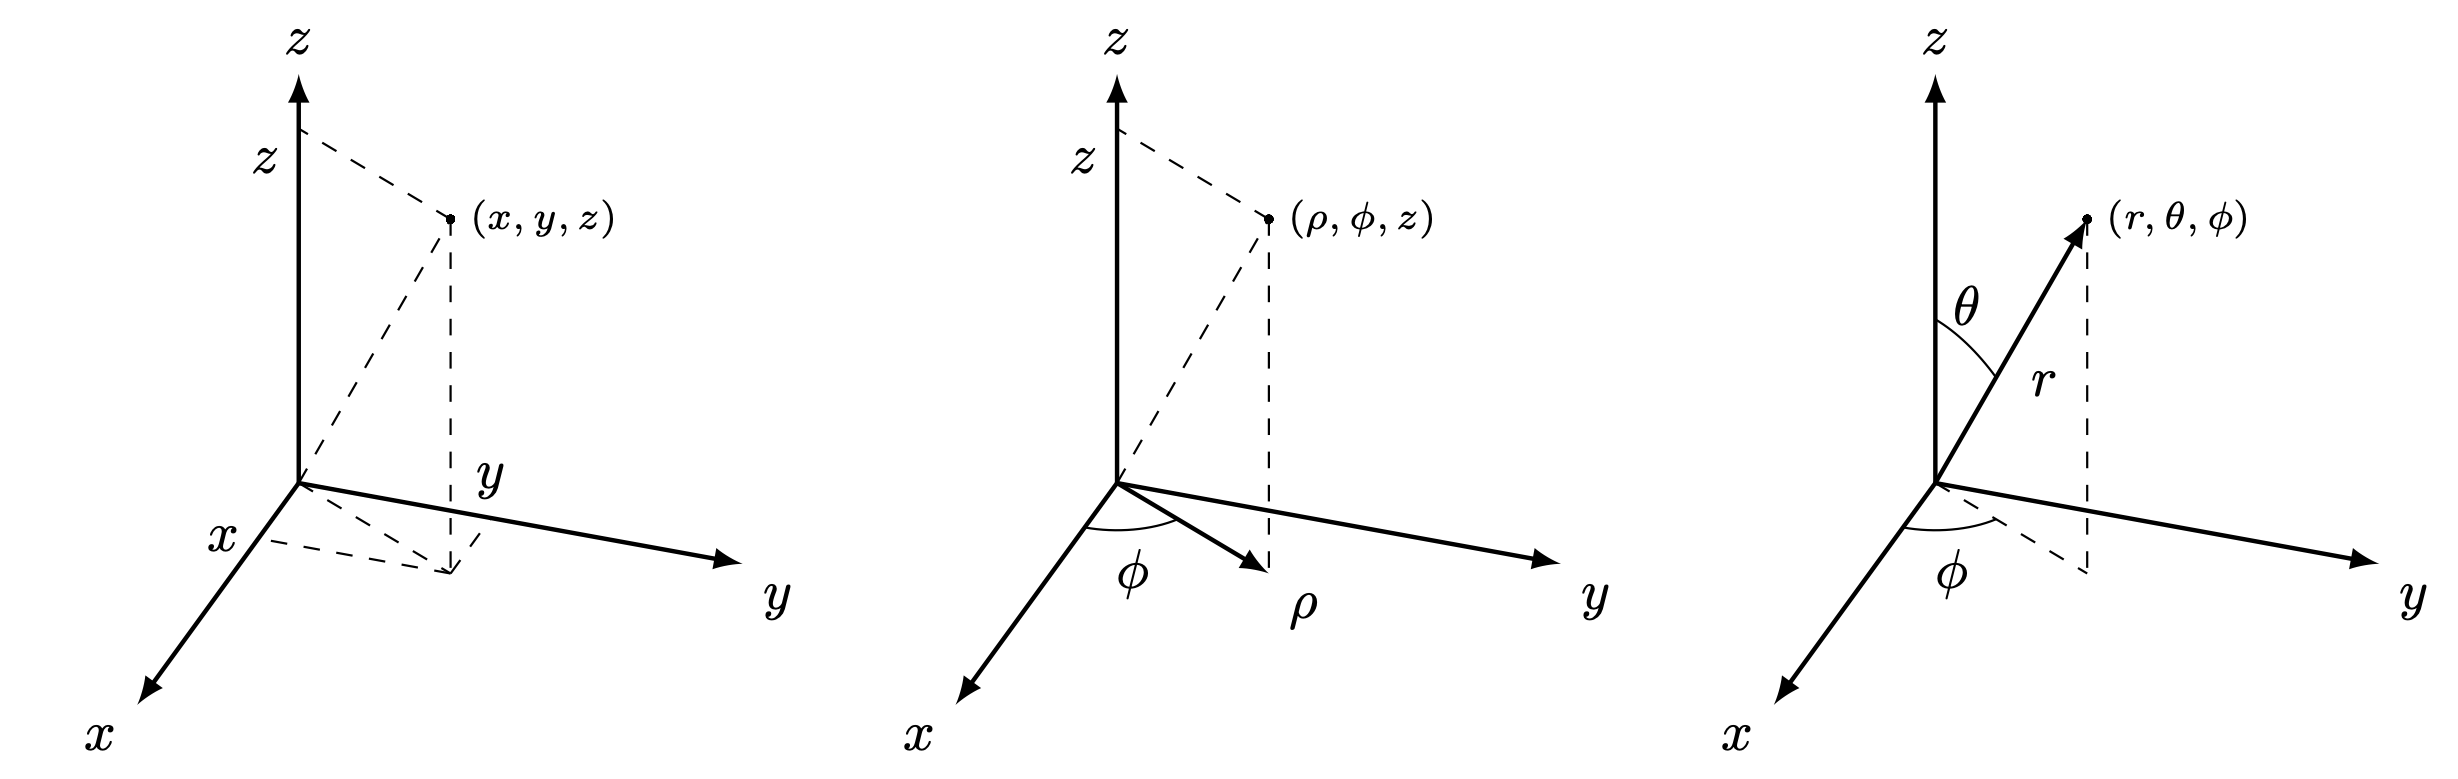
% Cartesian Coordinates
\tdplotsetmaincoords{60}{110}
\begin{tikzpicture}[scale=3, tdplot_main_coords]
\coordinate (O) at (0,0,0);
\draw[thick,->] (0,0,0) -- (1,0,0) node[anchor=north east]{$x$};
\draw[thick,->] (0,0,0) -- (0,1,0) node[anchor=north west]{$y$};
\draw[thick,->] (0,0,0) -- (0,0,1) node[anchor=south]{$z$};
\tdplotsetcoord{P}{1}{30}{60}
\draw plot [mark=*, mark size=0.2] (P) node [right] {\scriptsize$(x,y,z)$};
\draw[dashed] (O) -- (P);
\draw[dashed, color=black] (O) -- (Pxy);
\draw[dashed, color=black] (P) -- (Pxy);
\draw[dashed, color=black] (P) -- (Pz) node [below left] {$z$};
\draw[dashed, color=black] (Pxy) -- (Px) node [left] {$x$};
\draw[dashed, color=black] (Pxy) -- (Py) node [above] {$y$};
\end{tikzpicture}
% Polar Coordinates
\tdplotsetmaincoords{60}{110}
\begin{tikzpicture}[scale=3, tdplot_main_coords]
\coordinate (O) at (0,0,0);
\draw[thick,->] (0,0,0) -- (1,0,0) node[anchor=north east]{$x$};
\draw[thick,->] (0,0,0) -- (0,1,0) node[anchor=north west]{$y$};
\draw[thick,->] (0,0,0) -- (0,0,1) node[anchor=south]{$z$};
\tdplotsetcoord{P}{1}{30}{60}
\draw plot [mark=*, mark size=0.2] (P) node [right] {\scriptsize$(\rho,\phi,z)$};
\draw[dashed] (O) -- (P);
\draw[->, thick, color=black] (O) -- (Pxy) node [below right] {$\rho$};
\draw[dashed, color=black] (P) -- (Pxy);
\tdplotdrawarc{(O)}{0.2}{0}{60}{anchor=north}{$\phi$}
\draw[dashed, color=black] (P) -- (Pz) node [below left] {$z$};
\end{tikzpicture}
% Spherical Coordinates
\tdplotsetmaincoords{60}{110}
\begin{tikzpicture}[scale=3, tdplot_main_coords]
\coordinate (O) at (0,0,0);
\draw[thick,->] (0,0,0) -- (1,0,0) node[anchor=north east]{$x$};
\draw[thick,->] (0,0,0) -- (0,1,0) node[anchor=north west]{$y$};
\draw[thick,->] (0,0,0) -- (0,0,1) node[anchor=south]{$z$};
\tdplotsetcoord{P}{1}{30}{60}
\draw plot [mark=*, mark size=0.2] (P) node [right] {\scriptsize$(r,\theta,\phi)$};
\draw[->, thick] (O) -- (P) node [midway, below right] {$r$};
\draw[dashed, color=black] (O) -- (Pxy);
\draw[dashed, color=black] (P) -- (Pxy);
\tdplotdrawarc{(O)}{0.2}{0}{60}{anchor=north}{$\phi$}
\tdplotsetthetaplanecoords{60}
\tdplotdrawarc[tdplot_rotated_coords]{(0,0,0)}{0.4}{0}%
{30}{anchor=south}{$\theta$}
\end{tikzpicture}
\end{document}
Click to download: main-coordinate-systems.tex
Open in Overleaf: main-coordinate-systems.tex
This file is available on GitHub.
See more on the author page of Alexandros Tsagkaropolulos.