")


Edit and compile if you like:
\documentclass[tikz]{standalone}
\usepackage{pgfplots}
\pgfplotsset{compat=newest}
\tikzset{
canvas/.style={draw,left color=blue!35!black,right color=white},
sign/.style={align=center,fill=white,fill opacity=0.2,text opacity=1,text=white},
axis label/.style={midway,below,sloped}
}
\def\datapoint(#1,#2,#3)(#4) {
\filldraw (#1,#2,#3) -- (#1,#2,0) circle (0.2ex) (#1,#2,#3) -- (0,#2,#3) circle (0.2ex) (#1,#2,#3) -- (#1,0,#3) circle (0.2ex);
\shade[ball color=blue!40] (#1,#2,#3) circle (1ex) node[sign,right=1ex] {#4};}
\begin{document}
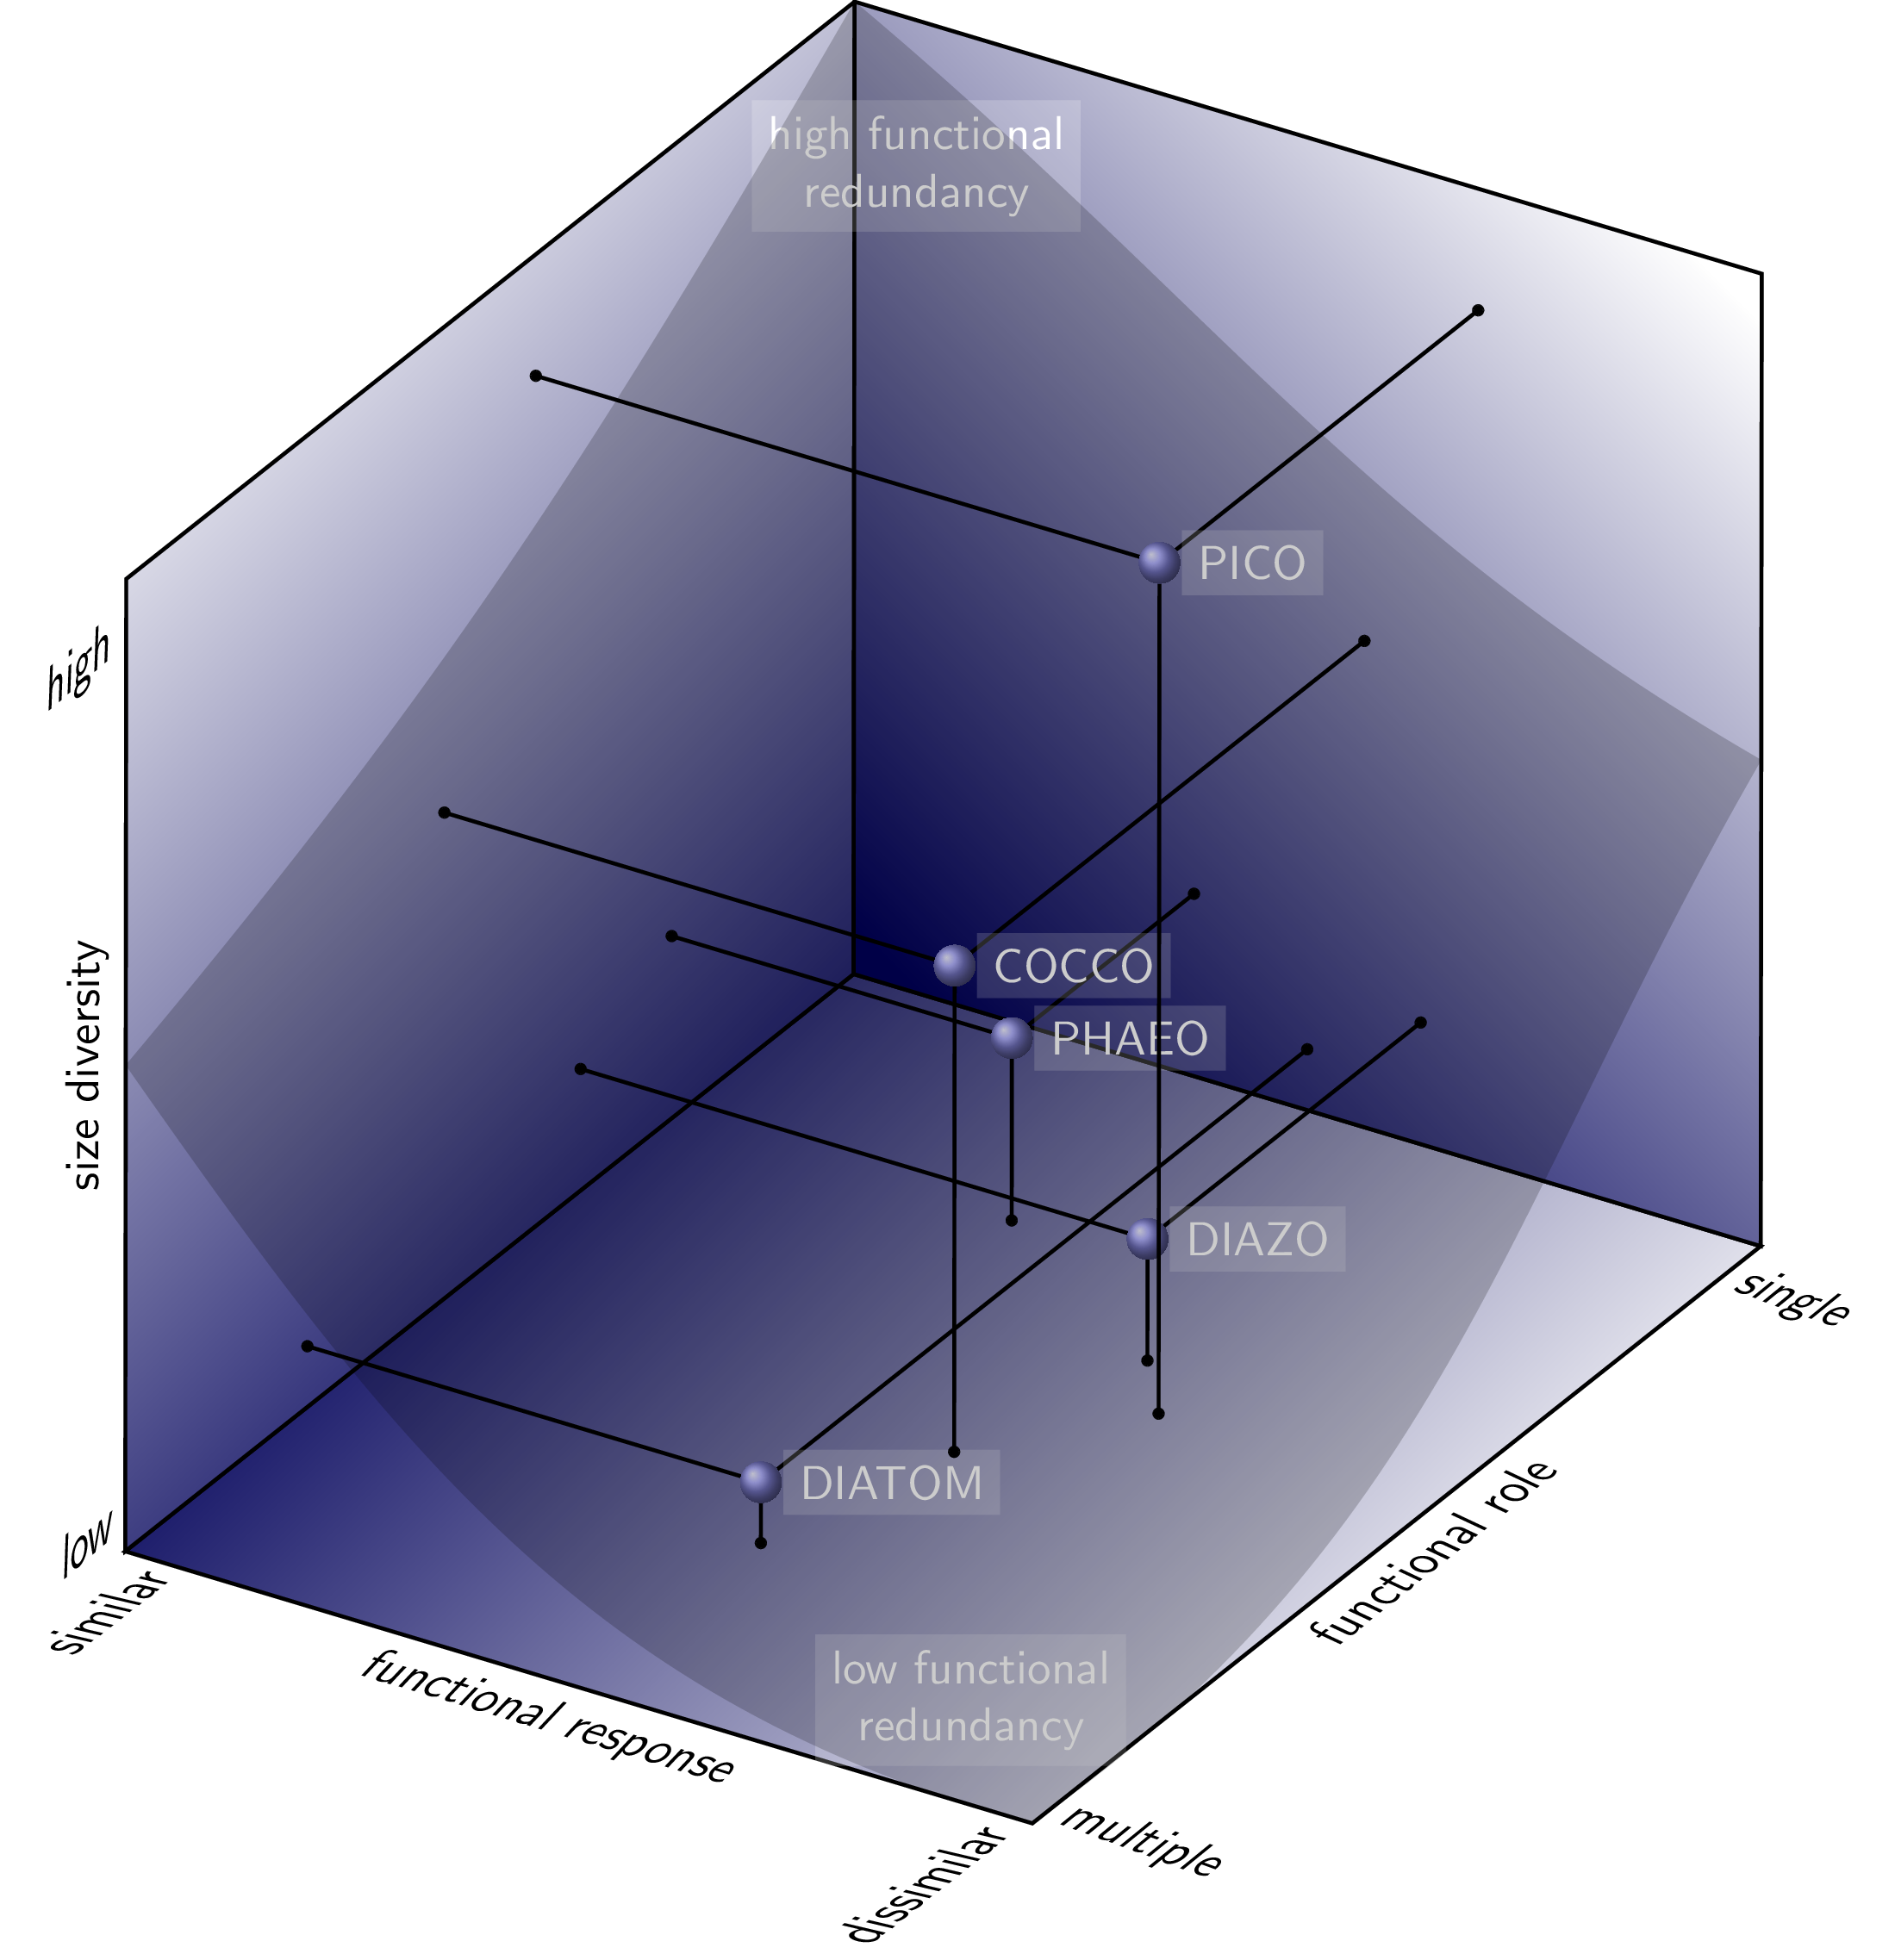
\begin{tikzpicture}[font=\sffamily,thick,rotate around y=-17,rotate around z=-8,rotate around x=10]
\shade[canvas,shading angle=45]
(0,0,0) -- (8,0,0)
node[below right,rotate=-20,xslant=0.6] {single}
-- (8,0,8)
node[right,rotate=-20,xslant=0.6,yshift=1ex] {multiple}
node[left,rotate=38,xslant=-0.8,yshift=1ex] {dissimilar}
node[sign,shift={(-3ex,6ex)}] {low functional\\redundancy}
node[axis label,xslant=-0.5] {functional role}
-- (0,0,8)
node[axis label,xslant=0.5] {functional response}
node[below left,rotate=38,xslant=-0.8] {similar}
-- cycle;
\shade[canvas,shading angle=225]
(0,0,0) -- (0,0,8)
node[above left,rotate=40,xslant=0.9] {low}
-- (0,8,8)
node[axis label,above] {size diversity}
node[below left,rotate=40,xslant=0.9] {high}
-- (0,8,0)
-- cycle;
\shade[canvas,shading angle=135]
(0,0,0) -- (8,0,0)
-- (8,8,0)
-- (0,8,0)
node[sign,shift={(3ex,-8ex)}] {high functional\\redundancy}
-- cycle;
\datapoint(4,0.5,6)(DIATOM)
\datapoint(5,1,3)(DIAZO)
\datapoint(3,1.5,2)(PHAEO)
\datapoint(4.5,4,4.5)(COCCO)
\datapoint(5.5,7,3.5)(PICO)
\fill[opacity=0.2] (8,0,8) to[out=35,in=-120] (8,4,0) to[out=150,in=-40] (0,8,0) to[out=-120,in=50] (0,4,8) to[out=-55,in=165] cycle;
\end{tikzpicture}
\end{document}
Click to download: relation-space.tex
Open in Overleaf: relation-space.tex
This file is available on tikz.netlify.app and on GitHub and is MIT licensed.
See more on the author page of Janosh Riebesell..

