")


Edit and compile if you like:
\documentclass[border=2pt]{standalone}
% Drawing
\usepackage{tikz}
\usetikzlibrary{shapes}
%% Styles
\tikzstyle{axis} = [line width = 0.8]
\tikzstyle{node} = [draw, rectangle, rounded corners, line width=0.5]
\begin{document}
\begin{tikzpicture}
% Grid
% \foreach \i in {-8,...,0,...,10}
% {
% \node at (\i,-2ex) {\i};
% \node at (0,\i) {\i};
% }
% n=1
%% Node
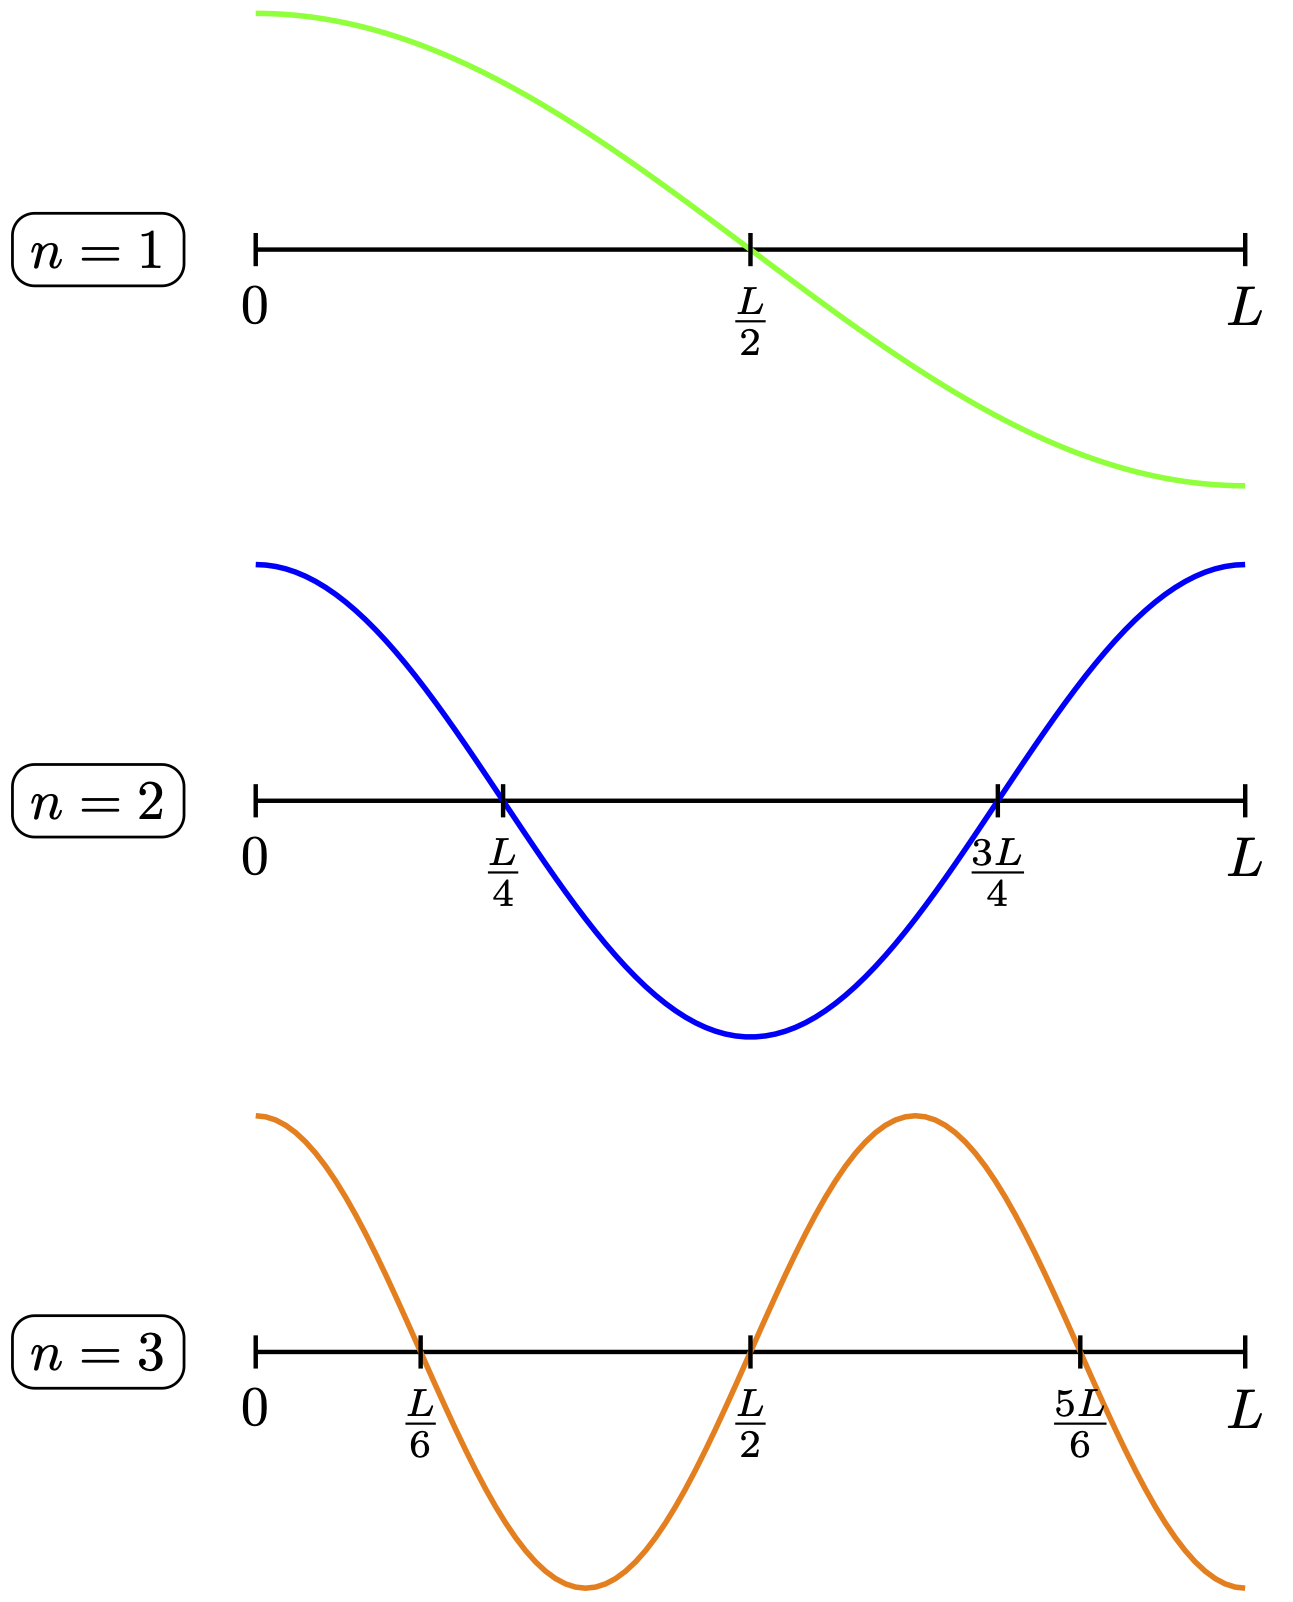
\node[node] at (-1,0) {$n=1$};
%% Axis
\draw[axis] (0,0) -- (2*pi,0);
%% Green Line
\draw[domain=0:2*pi, samples=100, line width = 1, green] plot (\x, {1.5*cos(deg(0.5*\x))});
%% Valus on Axis
\draw[thick] (0,3pt) -- (0,-3pt) node[below] {$0$};
\draw[thick] (pi,3pt) -- (pi,-3pt) node[below] {$\frac{L}{2}$};
\draw[thick] (2*pi,3pt) -- (2*pi,-3pt) node[below] {$L$};
% n=2
%% Node
\node[shift={(0,-3.5)}, node] at (-1,0) {$n=2$};
%% Axis
\draw[shift={(0,-3.5)}, axis] (0,0) -- (2*pi,0);
%% Blue Line
\draw[domain=0:2*pi, samples=100, shift={(0,-3.5)}, line width = 1, blue] plot (\x, {1.5*cos(deg(\x))});
%% Values
\draw[shift={(0,-3.5)}, thick] (0,3pt) -- (0,-3pt) node[below] {$0$};
\draw[shift={(0,-3.5)}, thick] (0.5*pi,3pt) -- (0.5*pi,-3pt) node[below] {$\frac{L}{4}$};
\draw[shift={(0,-3.5)}, thick] (1.5*pi,3pt) -- (1.5*pi,-3pt) node[below] {$\frac{3L}{4}$};
\draw[shift={(0,-3.5)}, thick] (2*pi,3pt) -- (2*pi,-3pt) node[below] {$L$};
% n=3
%% Node
\node[shift={(0,-7)}, node] at (-1,0) {$n=3$};
%% Axis
\draw[shift={(0,-7)}, axis] (0,0) -- (2*pi,0);
%% Orange Line
\draw[domain=0:2*pi, samples=100, shift={(0,-7)}, line width = 1, orange] plot (\x, {1.5*cos(deg(1.5*\x))});
%% Values
\draw[shift={(0,-7)}, thick] (0,3pt) -- (0,-3pt) node[below] {$0$};
\draw[shift={(0,-7)}, thick] (pi/3,3pt) -- (pi/3,-3pt) node[below] {$\frac{L}{6}$};
\draw[shift={(0,-7)}, thick] (pi,3pt) -- (pi,-3pt) node[below] {$\frac{L}{2}$};
\draw[shift={(0,-7)}, thick] (5*pi/3,3pt) -- (5*pi/3,-3pt) node[below] {$\frac{5L}{6}$};
\draw[shift={(0,-7)}, thick] (2*pi,3pt) -- (2*pi,-3pt) node[below] {$L$};
\end{tikzpicture}
\end{document}
Click to download: ressonance1.tex
Open in Overleaf: ressonance1.tex
This file is available on GitHub.
See more on the author page of Alexandros Tsagkaropolulos.


