")


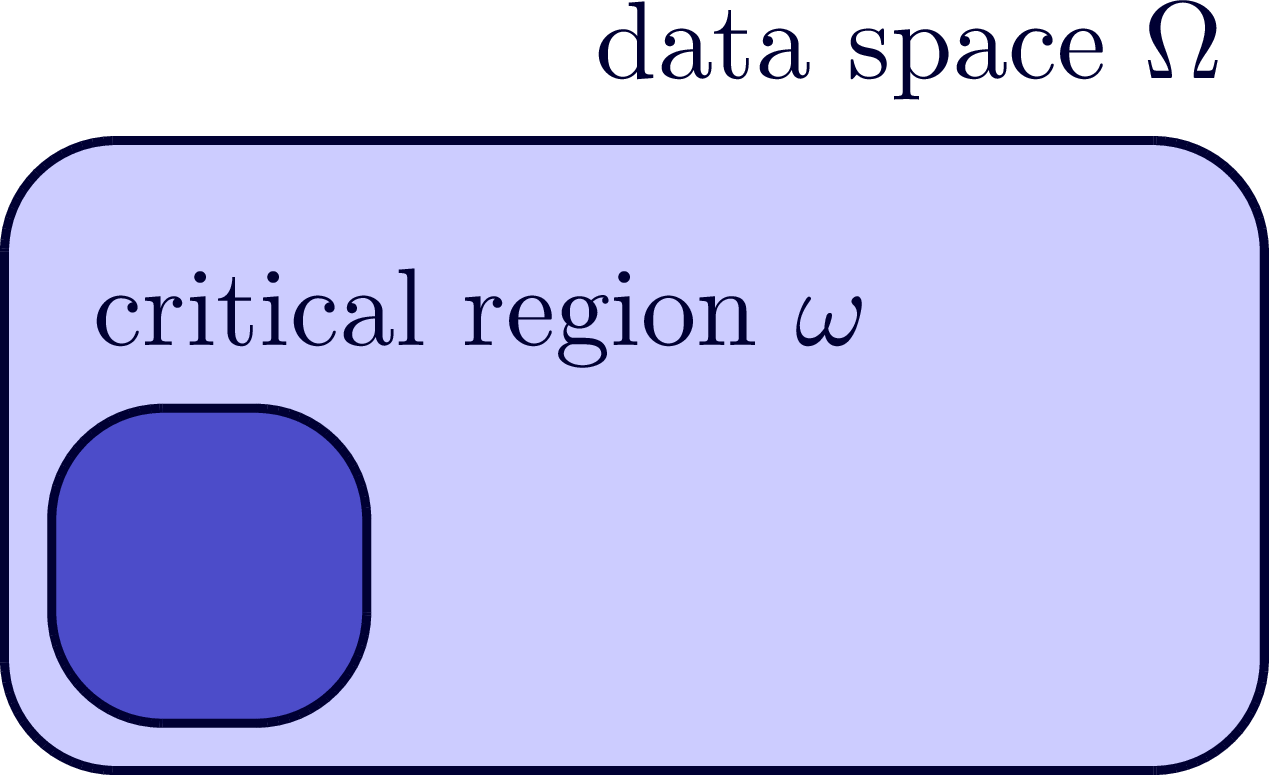
Critical regions to construct a null hypothesis test. Inspired by Glen Cowen’s CERN lectures. Also see this graph of a critical region, or these test statistics in hypothesis testing.
Edit and compile if you like:
% Basic drawings
% https://www.sharelatex.com/blog/2013/08/27/tikz-series-pt1.html
% https://www.tug.org/TUGboat/tb29-1/tb91walczak.pdf
\documentclass[border=1pt,tikz]{standalone}
\usepackage{tikz}
\begin{document}
% SET: critical region
\begin{tikzpicture}[scale=1.0]
\draw[blue!20!black,fill=blue!20,rounded corners=10,thick]
(0,0) rectangle (4,2)
node[above left] {data space $\Omega$};
\draw[blue!20!black,fill=blue!70!black!70,rounded corners=10,thick,shift={(0.15,0.15)}]
(1,0) rectangle (0,1)
node[above right] {critical region $\omega$};
\end{tikzpicture}
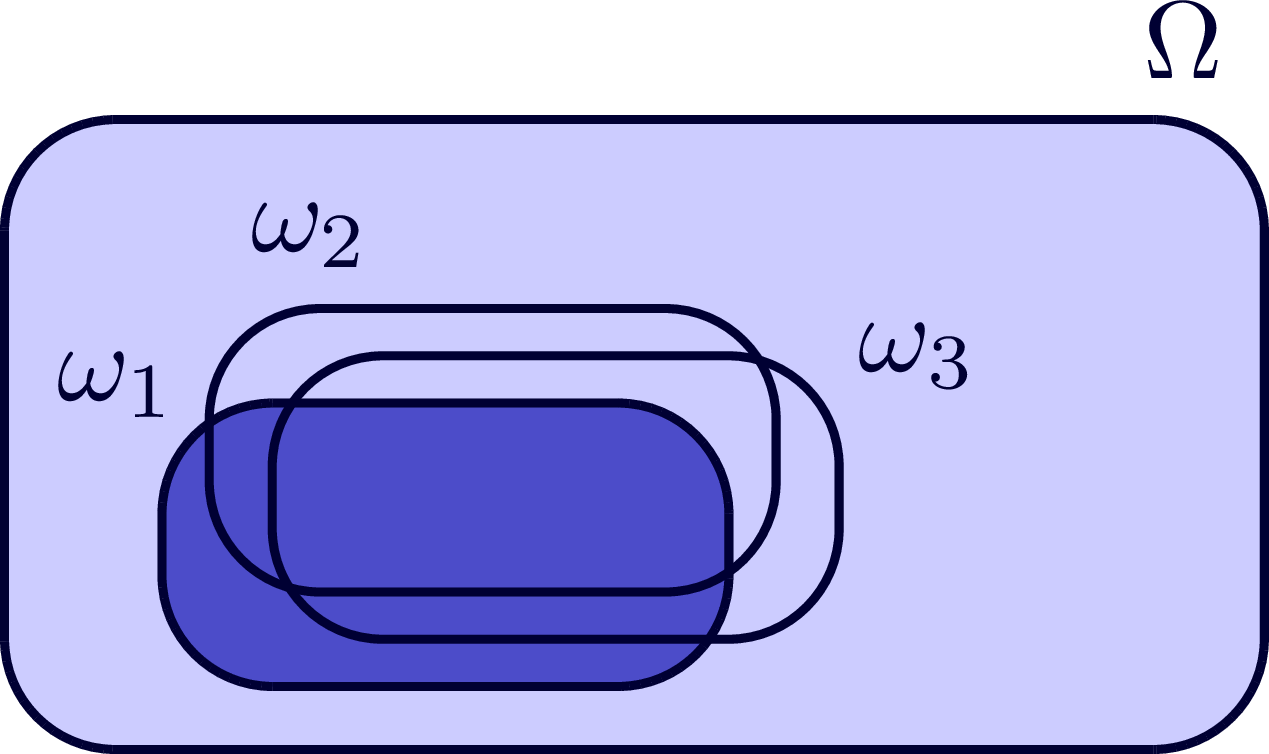
% SET: overlapping critical regions
\begin{tikzpicture}[scale=1.0]
\draw[blue!20!black,fill=blue!20,rounded corners=10,thick]
(0,0) rectangle (4,2)
node[above left] {$\Omega$};
\begin{scope}[shift={(0.35,0.05)}]
\draw[blue!20!black,fill=blue!70!black!70,rounded corners=10,thick,shift={(0.15,0.15)},scale=0.90]
(2,0) rectangle (0,1)
node[above left=-5pt] {$\omega_1$};
\draw[blue!20!black,rounded corners=10,thick,shift={(0.30,0.45)},scale=0.90]
(2,0) rectangle (0,1)
node[right=0pt,above right] {$\omega_2$};
\draw[blue!20!black,rounded corners=10,thick,shift={(0.50,0.30)},scale=0.90]
(0,0) rectangle (2,1)
node[right=-2pt] {$\omega_3$};
\end{scope}
\end{tikzpicture}
\end{document}Click to download: sets.tex • sets.pdf
Open in Overleaf: sets.tex


