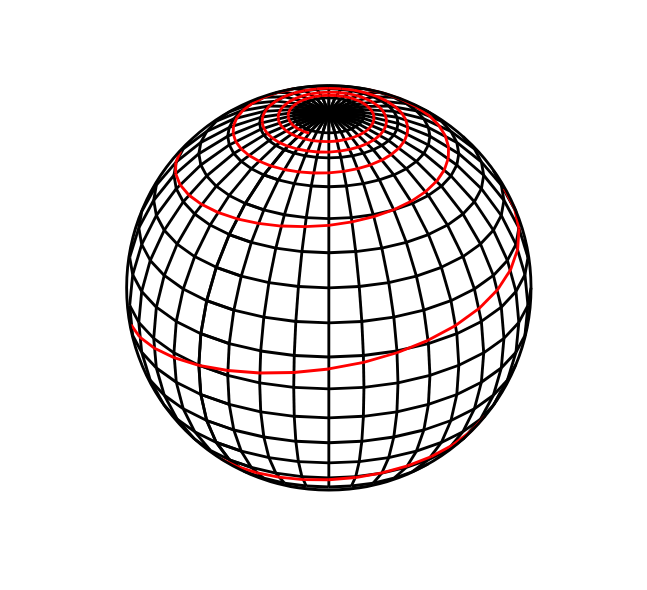
This is a sphere with an inscribed loxodrome.
The sphere is drawn using the parametric sphere equations. In order to draw only the side of the sphere we see, we use the camera vector defined in https://tex.stackexchange.com/a/729510/319072 and take its dot product with the start point of a small line segment. If the dot product is positive, then our line segment starts in front of the camera vector plane when it passes through the origin. Similarly, we draw the loxodrome with its corresponding parametric equations, and draw only the portion we see using the same dot product method.
Python is used for creating a multi-page PDF document, which is finally converted into a GIF file using a free .pdf to .gif conversion website.
You may need to click the .gif below for it to run.

This is an example LaTeX file for a particular azimuthal angle, that you can run yourself here in the browser:
\documentclass[tikz, border=1cm]{standalone}
\usepackage{tikz-3dplot}

\newcommand{\sphereX}[2]{cos(#1)*cos(#2)}
\newcommand{\sphereY}[2]{cos(#1)*sin(#2)}
\newcommand{\sphereZ}[2]{sin(#1)}

\newcommand{\loxodromeX}[1]{cos(#1)/sqrt((cos(#1))^2+(sin(#1))^2+((#1)/360)^2)}
\newcommand{\loxodromeY}[1]{sin(#1)/sqrt((cos(#1))^2+(sin(#1))^2+((#1)/360)^2)}
\newcommand{\loxodromeZ}[1]{(#1)/360/sqrt((cos(#1))^2+(sin(#1))^2+((#1)/360)^2)}

\newcommand{\elevation}{30}
\newcommand{\azimuth}{130}

% https://tex.stackexchange.com/a/729510/319072
\pgfmathsetmacro{\CameraX}{sin(\azimuth)*cos(\elevation)}
\pgfmathsetmacro{\CameraY}{-cos(\azimuth)*cos(\elevation)}
\pgfmathsetmacro{\CameraZ}{sin(\elevation)}

\begin{document}
\tdplotsetmaincoords{90-\elevation}{\azimuth}
\begin{tikzpicture}[tdplot_main_coords]
    \foreach \latitude in {-90,-80,...,90}{
        \foreach \longitude in {0,10,...,360}{

            \pgfmathsetmacro\dotproduct{(\CameraX)*(\sphereX{\latitude}{\longitude}) + (\CameraY)*(\sphereY{\latitude}{\longitude}) + (\CameraZ)*(\sphereZ{\latitude}{\longitude})}

            \ifdim\dotproduct pt > 0pt
            \draw[thin]
            (
                {\sphereX{\latitude}{\longitude}},
                {\sphereY{\latitude}{\longitude}},
                {\sphereZ{\latitude}{\longitude}}
            )
            --
            (
                {\sphereX{\latitude}{\longitude+10}},
                {\sphereY{\latitude}{\longitude+10}},
                {\sphereZ{\latitude}{\longitude+10}}
            );

            \fi
        }
    }

    \foreach \longitude in {0,10,...,360}{
        \foreach \latitude in {-90,-80,...,90}{

            \pgfmathsetmacro\dotproduct{(\CameraX)*(\sphereX{\latitude}{\longitude}) + (\CameraY)*(\sphereY{\latitude}{\longitude}) + (\CameraZ)*(\sphereZ{\latitude}{\longitude})}

            \ifdim\dotproduct pt > 0pt
                \draw[thin]
                (
                    {\sphereX{\latitude}{\longitude}},
                    {\sphereY{\latitude}{\longitude}},
                    {\sphereZ{\latitude}{\longitude}}
                )
                --
                (
                    {\sphereX{\latitude+10}{\longitude}},
                    {\sphereY{\latitude+10}{\longitude}},
                    {\sphereZ{\latitude+10}{\longitude}}
                );
            \fi
        }
    }

    \foreach \Vt in {-1800,-1790,...,1800}{
        \pgfmathsetmacro\dotproduct{(\CameraX)*(\loxodromeX{\Vt}) + (\CameraY)*(\loxodromeY{\Vt}) + (\CameraZ)*(\loxodromeZ{\Vt})}

        \ifdim\dotproduct pt > 0pt
            \draw[red]
            (
                {\loxodromeX{\Vt}},
                {\loxodromeY{\Vt}},
                {\loxodromeZ{\Vt}}
            )
            --
            (
                {\loxodromeX{\Vt+10}},
                {\loxodromeY{\Vt+10}},
                {\loxodromeZ{\Vt+10}}
            );
        \fi
    }

    \draw[tdplot_screen_coords] circle[radius=1];
\end{tikzpicture}
\end{document}
The source code is at Github (spinning_sphere_with_loxodrome.py).