")


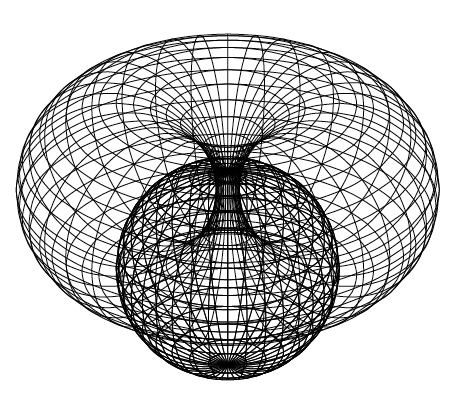
This is an interesting stereographic projection that you get when you rotate 90-degree Steiner circles about their axis of symmetry.
Animated GIF; you may need to click on it for running:
This is an example LaTeX file for a particular value of \animationparameter, that you can run yourself here in the browser:
\documentclass[
    tikz
    ,border = 3.14mm
]{standalone}
\usepackage{tikz-3dplot}
\pgfmathdeclarefunction{sphereX}{2}{%
    % #1  - longitude
    % #2  - latitude
    \pgfmathparse{cos(#2)*cos(#1)}%
}
\pgfmathdeclarefunction{sphereY}{2}{%
    \pgfmathparse{cos(#2)*sin(#1)}%
}
\pgfmathdeclarefunction{sphereZ}{2}{%
    \pgfmathparse{sin(#2)}%
}
\pgfmathdeclarefunction{toruscenter}{1}{%
    % #1  - \animationparameter
    \pgfmathparse{1/cos(#1)}%
}
\pgfmathdeclarefunction{torusradius}{1}{%
    % #1  - \animationparameter
    \pgfmathparse{-sin(#1)/cos(#1)}%
}
\pgfmathdeclarefunction{projectionx}{3}{%
    % #1  - \animationparameter
    % #2  - \longitude
    % #2  - \latitude
    \pgfmathparse{
        torusradius(#1) *
        sphereX(#2,#3) +
        toruscenter(#1) *
        cos(#2)
    }%
}
\pgfmathdeclarefunction{projectiony}{3}{%
    % #1  - \animationparameter
    % #2  - \longitude
    % #2  - \latitude
    \pgfmathparse{
        torusradius(#1) *
        sphereY(#2,#3) +
        toruscenter(#1) *
        sin(#2)
    }%
}
\pgfmathdeclarefunction{projectionz}{3}{%
    % #1  - \animationparameter
    % #2  - \longitude
    % #2  - \latitude
    \pgfmathparse{
        torusradius(#1) *
        sphereZ(#2,#3)
    }%
}
\pgfmathsetmacro{\animationparameter}{60}
\begin{document}
    \tdplotsetmaincoords{60}{120}
    \begin{tikzpicture}[tdplot_main_coords]
         % This clips and adds struts to a rectangle
         % which mimicks the size of a Beamer frame.
        \path[tdplot_screen_coords]
            (-12.8/2,-9.6/2)
            rectangle
            (12.8/2,9.6/2);
        \clip[tdplot_screen_coords]
            (-12.8/2,-9.6/2)
            rectangle
            (12.8/2,9.6/2);
        \pgfmathsetmacro{\startlatitude}{0}
        \pgfmathsetmacro{\endlatitude}{360}
        \pgfmathsetmacro{\sampleslatitude}{20}
        \pgfmathsetmacro{\steplatitude}{
            (\endlatitude - \startlatitude) /
            \sampleslatitude
        }
        \foreach
            \latitude[
                parse = true
                ,count = \count
            ]
            in {%
                \startlatitude%
                ,\startlatitude+\steplatitude%
                ,...%
                ,\endlatitude%
            } {
                \pgfmathparse{\count != \sampleslatitude + 1}
                \ifnum\pgfmathresult=1
                    \pgfmathsetmacro{\startlongitude}{0}
                    \pgfmathsetmacro{\endlongitude}{360}
                    \pgfmathsetmacro{\sampleslongitude}{20}
                    \draw[
                        smooth
                        ,domain = \startlongitude:\endlongitude
                        ,samples = \sampleslongitude
                        ,variable = \longitude
                    ] plot (
                        {
                            projectionx(
                                \animationparameter
                                ,\longitude
                                ,\latitude
                            )
                        }
                        ,{
                            projectiony(
                                \animationparameter
                                ,\longitude
                                ,\latitude
                            )
                        }
                        ,{
                            projectionz(
                                \animationparameter
                                ,\longitude
                                ,\latitude
                            )
                        }
                    ) plot (
                        {
                            toruscenter(\animationparameter) *
                            sphereX(\longitude,\latitude)
                        }
                        ,{
                            toruscenter(\animationparameter) *
                            sphereY(\longitude,\latitude)
                        }
                        ,{
                            toruscenter(\animationparameter) *
                            sphereZ(\longitude,\latitude) +
                            torusradius(\animationparameter)
                        }
                    );
                \fi
            }
        \pgfmathsetmacro{\startlongitude}{0}
        \pgfmathsetmacro{\endlongitude}{360}
        \pgfmathsetmacro{\sampleslongitude}{20}
        \pgfmathsetmacro{\steplongitude}{
            (\endlongitude - \startlongitude) /
            \sampleslongitude
        }
        \foreach
            \longitude[
                parse = true
                ,count = \count
            ]
            in {%
                \startlongitude%
                ,\startlongitude+\steplongitude%
                ,...%
                ,\endlongitude%
            } {
                \pgfmathparse{\count != \sampleslongitude + 1}
                \ifnum\pgfmathresult=1
                    \pgfmathsetmacro{\startlatitude}{0}
                    \pgfmathsetmacro{\endlatitude}{360}
                    \pgfmathsetmacro{\sampleslatitude}{20}
                    \draw[
                        smooth
                        ,domain = \startlatitude:\endlatitude
                        ,samples = \sampleslatitude
                        ,variable = \latitude
                    ] plot (
                        {
                            projectionx(
                                \animationparameter
                                ,\longitude
                                ,\latitude
                            )
                        }
                        ,{
                            projectiony(
                                \animationparameter
                                ,\longitude
                                ,\latitude
                            )
                        }
                        ,{
                            projectionz(
                                \animationparameter
                                ,\longitude
                                ,\latitude
                            )
                        }
                    ) plot (
                        {
                            toruscenter(\animationparameter) *
                            sphereX(\longitude,\latitude)
                        }
                        ,{
                            toruscenter(\animationparameter) *
                            sphereY(\longitude,\latitude)
                        }
                        ,{
                            toruscenter(\animationparameter) *
                            sphereZ(\longitude,\latitude) +
                            torusradius(\animationparameter)
                        }
                    );
                \fi
            }
    \end{tikzpicture}
\end{document}