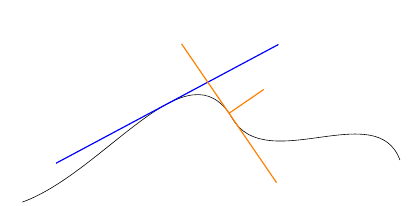
\documentclass{article}
\usepackage{tikz}
\usetikzlibrary{decorations.markings}

\begin{document}

\begin{tikzpicture}[
    tangent/.style={
        decoration={
            markings,% switch on markings
            mark=
                at position #1
                with
                {
                    \coordinate (tangent point-\pgfkeysvalueof{/pgf/decoration/mark info/sequence number}) at (0pt,0pt);
                    \coordinate (tangent unit vector-\pgfkeysvalueof{/pgf/decoration/mark info/sequence number}) at (1,0pt);
                    \coordinate (tangent orthogonal unit vector-\pgfkeysvalueof{/pgf/decoration/mark info/sequence number}) at (0pt,1);
                }
        },
        postaction=decorate
    },
    use tangent/.style={
        shift=(tangent point-#1),
        x=(tangent unit vector-#1),
        y=(tangent orthogonal unit vector-#1)
    },
    use tangent/.default=1
]
\draw [
    tangent=0.4,
    tangent=0.56
] (0,0)
    to [out=20,in=120] (5,2)
    to [out=-60, in=110] (9,1);
\draw [blue, thick, use tangent] (-3,0) -- (3,0);
\draw [orange, thick, use tangent=2] (-2,0) -- (2,0) (0,0) -- (0,1);
\end{tikzpicture}
\end{document}
")


Dear Prof,
why does not it work as your codes where only a curve is replaced by plot? Thanks for your help.
Best regards,
Jili
\documentclass[tikz,border=0.5mm]{standalone}
\usepackage{tikz}
\usetikzlibrary{decorations.markings}
\begin{document}
%Tangent line of an arbitrary point on a path
\begin{tikzpicture}[
tangent/.style={
decoration={
markings,% switch on markings
mark=
at position #1
with
{
\coordinate (tangent point-\pgfkeysvalueof{/pgf/decoration/mark info/sequence number}) at (0pt,0pt);
\coordinate (tangent unit vector-\pgfkeysvalueof{/pgf/decoration/mark info/sequence number}) at (1,0pt);
\coordinate (tangent orthogonal unit vector-\pgfkeysvalueof{/pgf/decoration/mark info/sequence number}) at (0pt,1);
}
},
postaction=decorate
},
use tangent/.style={
shift=(tangent point-#1),
x=(tangent unit vector-#1),
y=(tangent orthogonal unit vector-#1)
},
use tangent/.default=1
]
\draw[help lines] (0,0)grid (10,4);
\draw [
tangent=0.1,
tangent=0.4
]
plot[smooth,tension=0.6] coordinates{ (0,0) (5,2) (10,0) };
%(0,0)
%to [out=20,in=120] (5,2)
%to [out=-60, in=110] (9,1);
\draw [blue, thick, use tangent] (0,0) — (1,0);
\draw [orange, thick, use tangent=2] (-1,0) — (1,0) (0,0) — (0,0.5);
\end{tikzpicture}
\end{document}