")


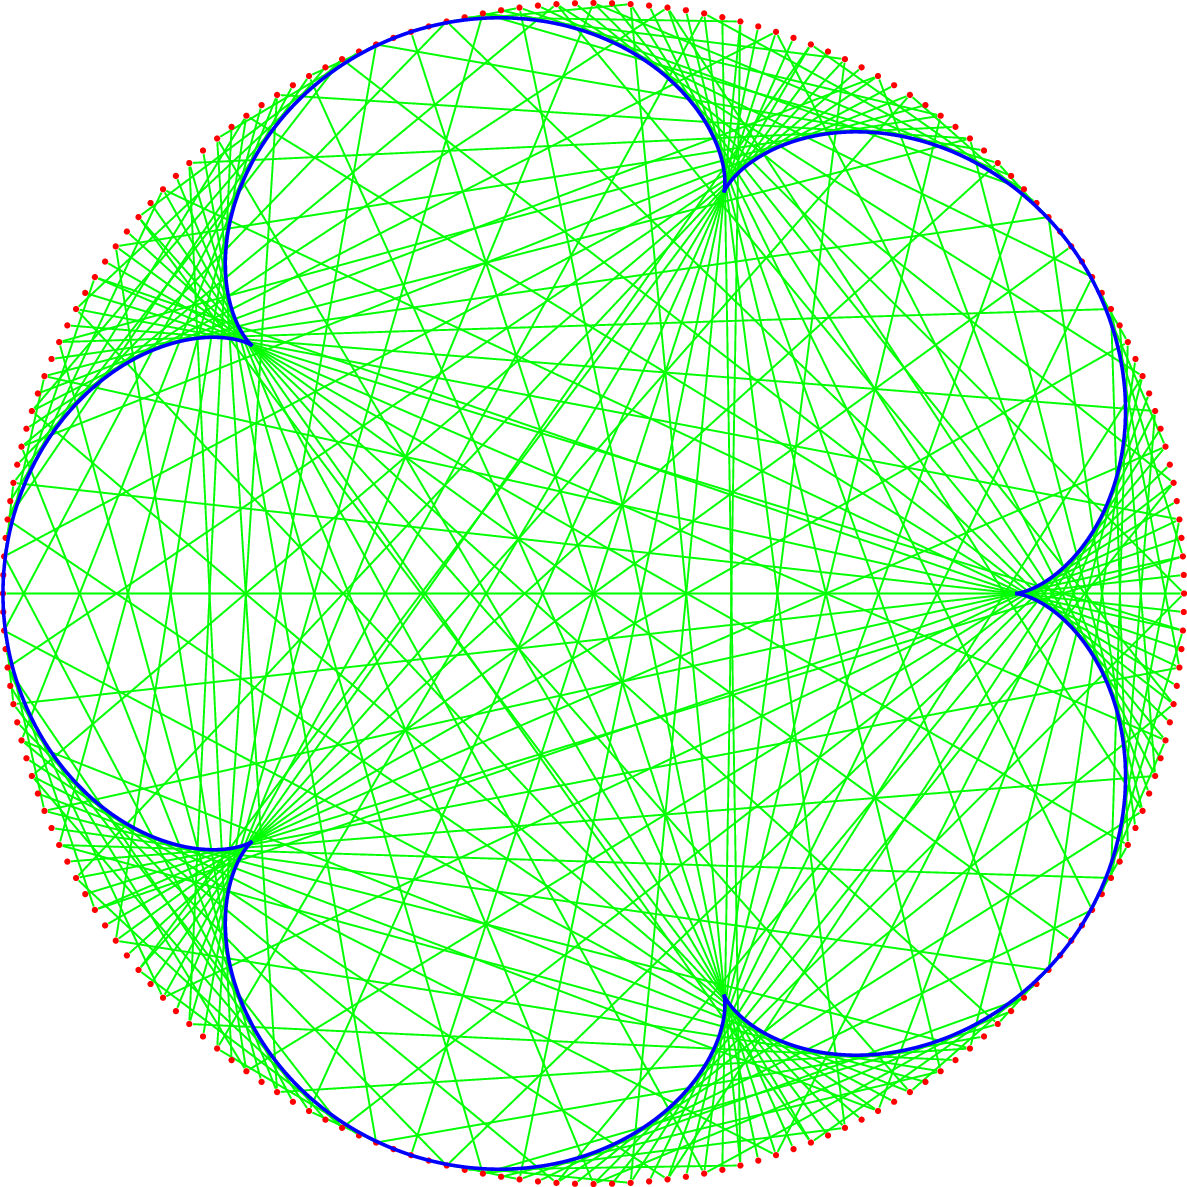
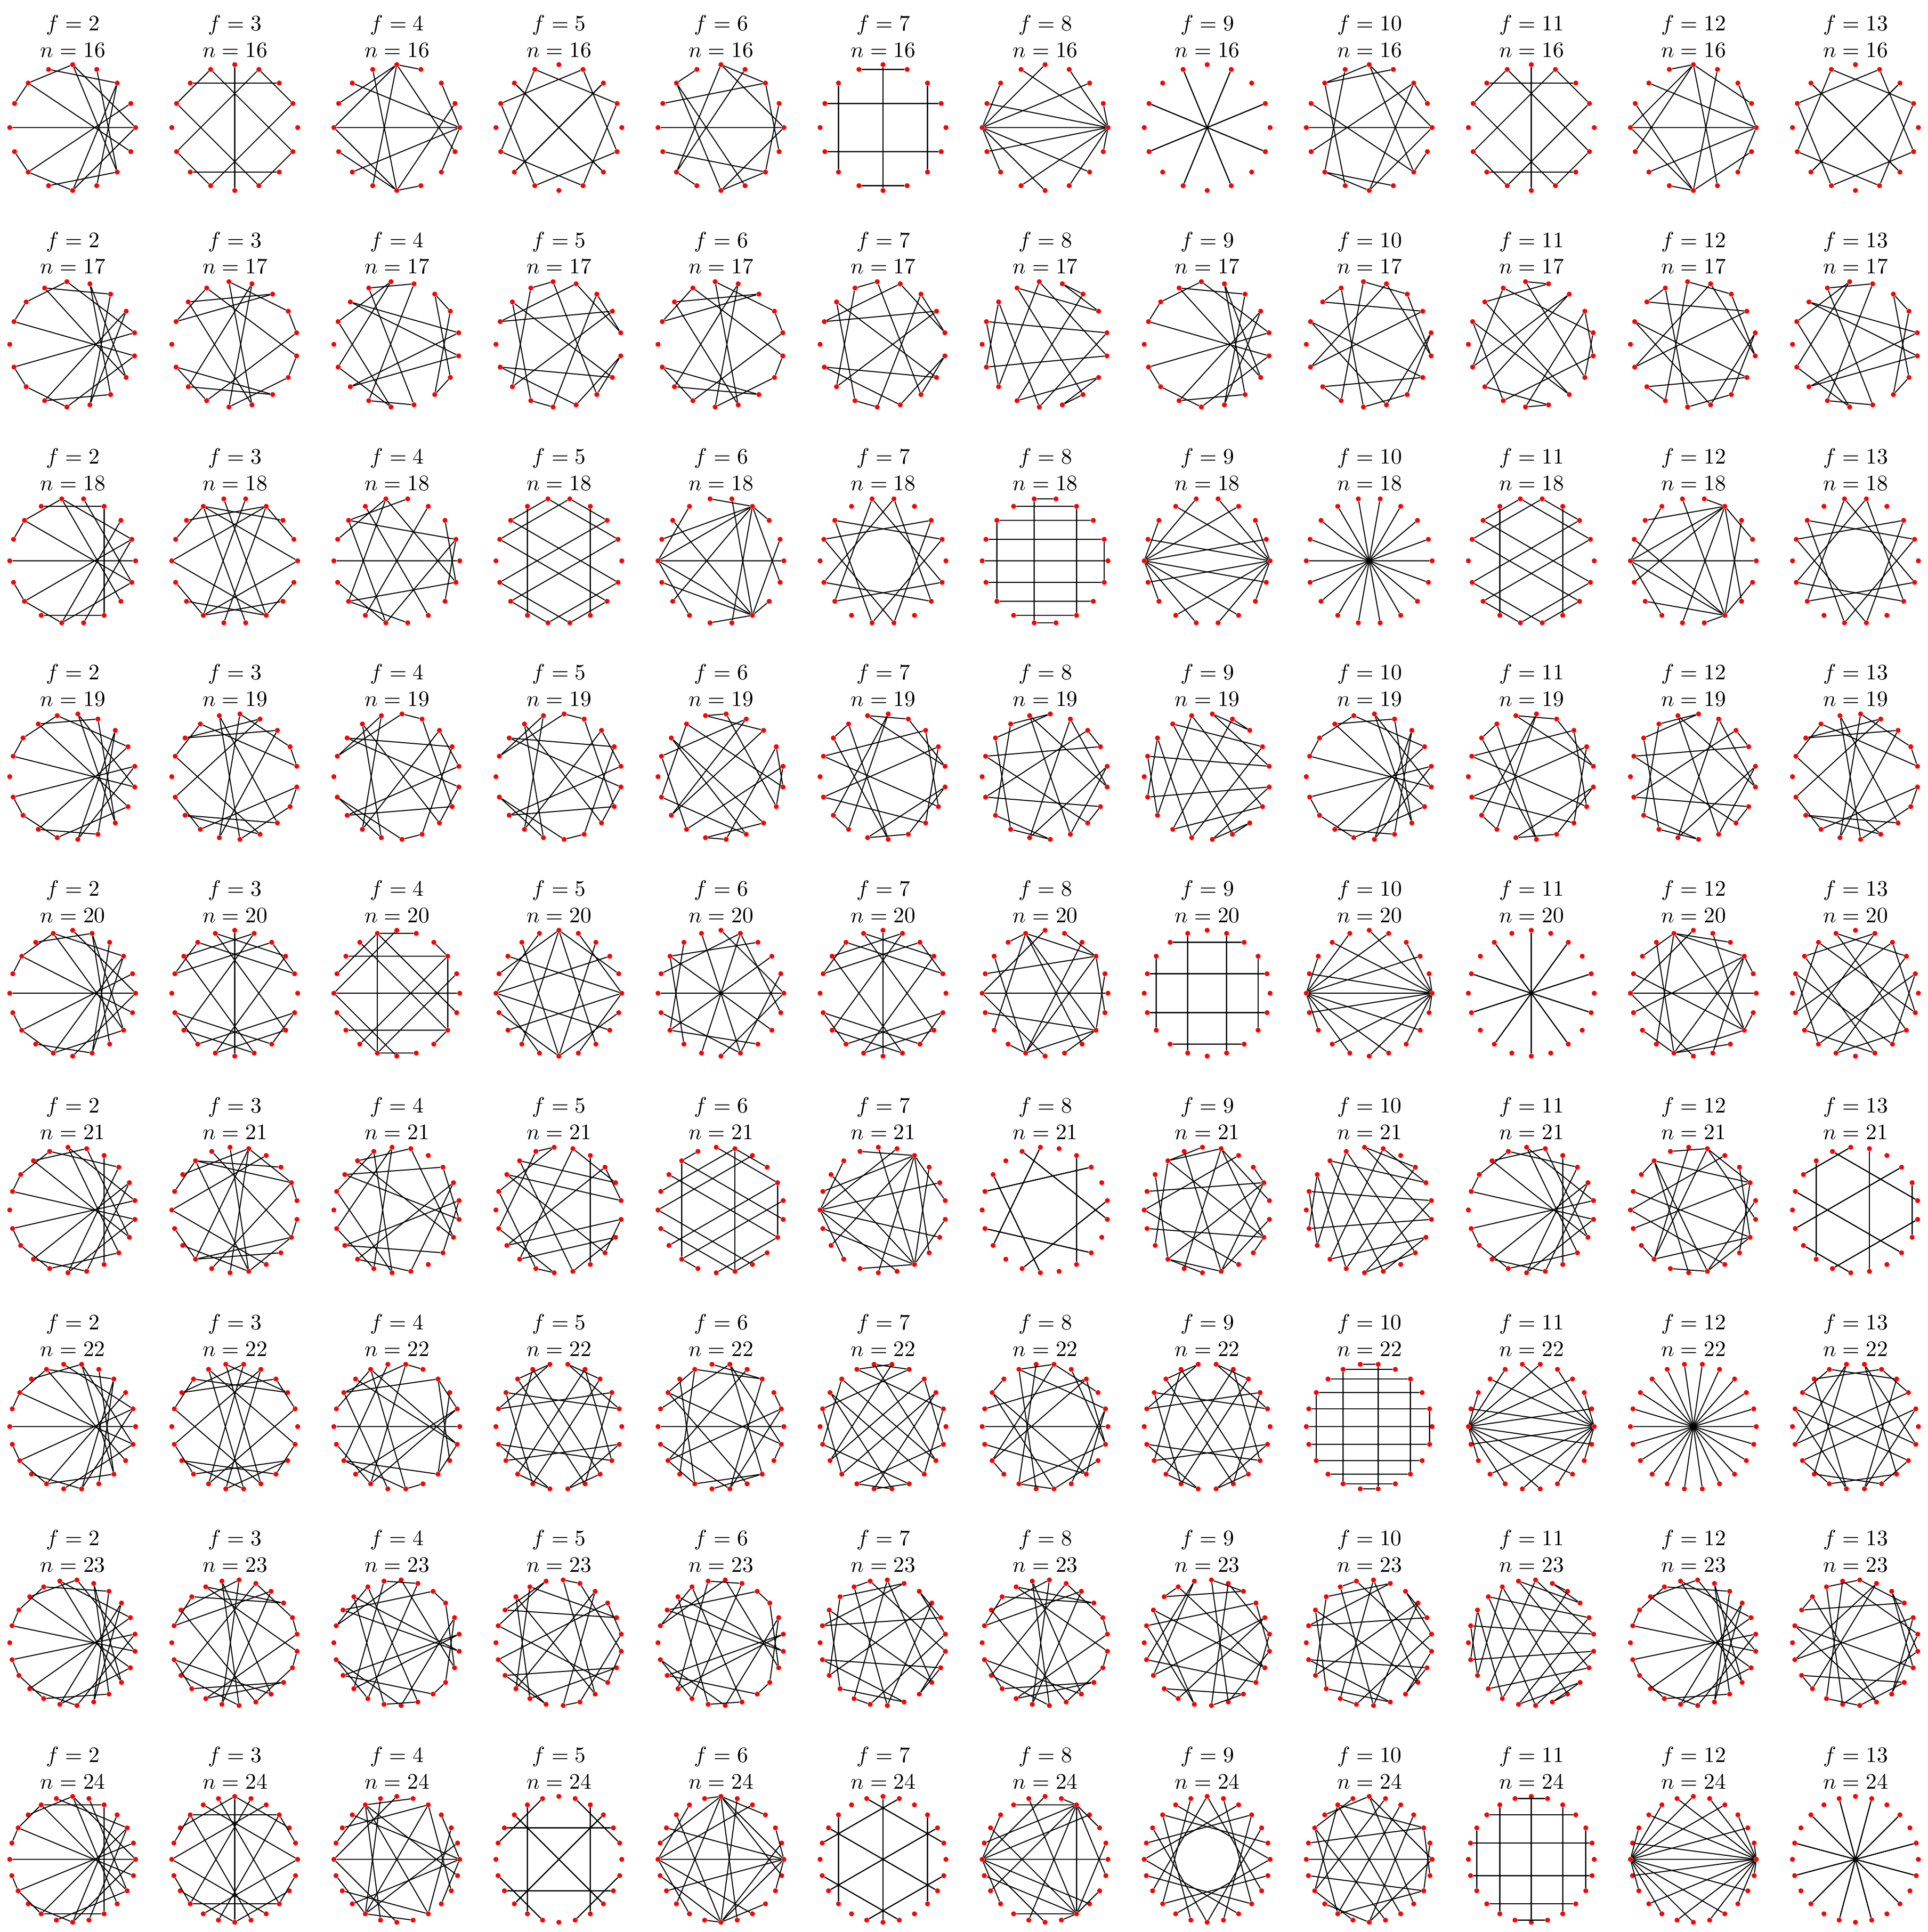
Inspired by Mathologer’s video on “Times Tables, Mandelbrot and the Heart of Mathematics” this example uses the graphs library to create a circular f times table mod n.
The left-most point on the circular is labeled “0”, counter-clockwise the points 1, 2, …, n − 1 follow.
For each point i, the value j = i × f mod n will be calculated and an line between i and j will be drawn (unless i = j which needs special care in PGF/TikZ because it would otherwise issue a warning in the log).
For f = 2, the edges will visualize a Cardioid.
\documentclass[tikz]{standalone}
\usetikzlibrary{backgrounds, graphs}
\tikzgraphsset{
  MandelTimes factor/.initial=2,
  declare = {MandelTimesTable}{
    [clockwise, phase=180] {
      \foreach \V in {0,...,\pgfinteval{\tikzgraphVnum-1}}{\V},
      \foreach \V in {1,...,\pgfinteval{\tikzgraphVnum-1}}{
        [/utils/exec = % (V × f) mod n
          \edef\pgfmathresult{\pgfinteval{\pgfintmod
            {\V*(\pgfkeysvalueof{/tikz/graphs/MandelTimes factor})}
            {\tikzgraphVnum}}},
         parse/.expanded = { % test for = to supress warnings
           \unless\ifnum\V=\pgfmathresult\space\V -- \pgfmathresult \fi}]}}}}
\begin{document}
\tikzgraphsset{% a few global settings
  /pgf/declare function={
    rBig(\r,\f)=\r*(\f-1)/(\f+1);
    rSmall(\r,\f)=\r/(\f+1);
    aSmall(\a,\f)=\a*(\f-1);},
  n=200, radius=5cm}
\foreach[count=\fMinus from 1] \f in {2,...,10}{%
\begin{tikzpicture}
\path[% graph's edges should be behind nodes
  execute at begin to = \pgfonlayer{background},
  execute at end to   = \endpgfonlayer]
  graph[
    edges              = green,
    MandelTimes factor = \f,
    nodes={circle, inner sep=+0pt, fill=red, minimum size=+.5mm, as=}
  ] {MandelTimesTable};
\path[samples=65, domain=0:360/\fMinus, save path=\p, smooth,
      rotate={isodd(\f)?180/\fMinus:0}] plot ([/utils/exec=
           \pgfmathsetlengthmacro\rSmall{rSmall(5cm,\f)}%
           \pgfmathsetlengthmacro\rBig{\rSmall+rBig(5cm,\f)}%
           \pgfmathsetmacro\aSmall{\x-180+aSmall(\x,\f)},
         shift={(\aSmall:\rSmall)}, shift={(\x:\rBig)}]0,0);
\foreach \i in {1,...,\fMinus}
  \draw[blue, thick, transform canvas={rotate=360/\fMinus*\i}, use path=\p];
\end{tikzpicture}}
\tikz[
  row sep=+5mm, column sep=+5mm,
  execute at empty cell = {
    \tikzgraphsset{
      radius=1cm,
      MandelTimes factor = \pgfmatrixcurrentcolumn+1,
      n = \pgfinteval{\pgfmatrixcurrentrow+15}}
    \node[align=center, above=\pgfkeysvalueof{/tikz/graphs/radius}]
      {$ f = \pgfinteval{\pgfkeysvalueof{/tikz/graphs/MandelTimes factor}} $
        \\ $ n = \tikzgraphVnum $};
    \graph[nodes={circle, inner sep=+0pt, fill=red, minimum size=+.75mm, as=}]
      {MandelTimesTable};}]\matrix{
  & & & & & & & & & & &  \\
  & & & & & & & & & & &  \\
  & & & & & & & & & & &  \\
  & & & & & & & & & & &  \\
  & & & & & & & & & & &  \\
  & & & & & & & & & & &  \\
  & & & & & & & & & & &  \\
  & & & & & & & & & & &  \\
  & & & & & & & & & & &  \\
};
\end{document}