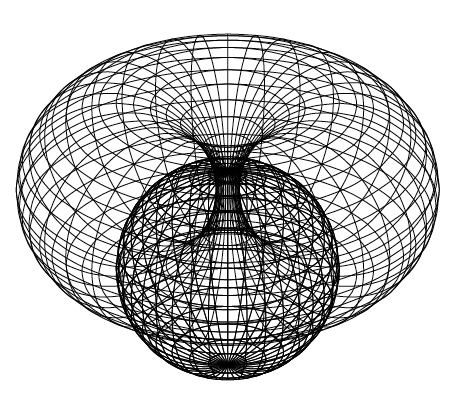
Symmetry in Stereographic Projection of 90° Rotated Sphere

Stereographic projection is a one-to-one mapping between the sphere and the plane which preserves angles.

Latitudinal and longitudinal lines on a sphere are always orthogonal. So, their mapping on the plane will always have a right angle.

For 90 degree polar rotations of the sphere, these mappings will have an axis of symmetry – the mapping of the sphere’s equator.

This lets us to rotate the image about that axis to produce orthogonally intersecting 3D shapes!

We can draw such an image using tikz-3dplot. Python is used for creating a multi-page PDF document, which is finally converted into a GIF file.

Single sample image of the series:

Toroidal field

Animated GIF; you may need to click on it for running:

Toroidal field amimated

This is an example LaTeX file for a particular value of theta, that you can run yourself here in the browser:

\documentclass[tikz, border=1cm]{standalone}

\usepackage{tikz-3dplot}

\newcommand{\sphereX}[2]{
% #1  - azimuthal angle
% #2  - polar angle
cos(#2)*cos(#1)
}

\newcommand{\sphereY}[2]{
% #1  - azimuthal angle
% #2  - polar angle
cos(#2)*sin(#1)
}

\newcommand{\sphereZ}[2]{
% #1  - azimuthal angle
% #2  - polar angle
sin(#2)
}

\newcommand{\torusRadius}[1]{
% #1  - projection angle
(-sin(#1)/cos(#1))
}

\newcommand{\torusCenter}[1]{
% #1  - projection angle
(1/cos(#1))
}

\newcommand{\variableTheta}{
% this is the projection angle
60
}

\begin{document}
    \tdplotsetmaincoords{60}{130}
    \begin{tikzpicture}[tdplot_main_coords]

        % This clips, and adds struts to a rectangle that is the size of a Beamer frame.
        \clip[tdplot_screen_coords] 
        (-12.8/2,-9.6/2) 
        rectangle (12.8/2,9.6/2);
        \draw[opacity=0,very thin,tdplot_screen_coords] 
        (-12.8/2,-9.6/2) 
        rectangle (12.8/2,9.6/2);

        % For every azimuthal angle, we draw the corresponding line of longitude on the torus. 
        % The lines of longitude vary in their polar angles.
        \foreach \azimuthalAngle in {0,10,...,350}{
        \draw[variable=\polarAngle,domain=0:360,smooth] 
        plot 
        (
        {\torusRadius{\variableTheta}*\sphereX{\azimuthalAngle}{\polarAngle}+\torusCenter{\variableTheta}*cos(\azimuthalAngle)},
        {\torusRadius{\variableTheta}*\sphereY{\azimuthalAngle}{\polarAngle}+\torusCenter{\variableTheta}*sin(\azimuthalAngle)},
        {\torusRadius{\variableTheta}*\sphereZ{\azimuthalAngle}{\polarAngle}}
        );
        }

        % Similarly, for every polar angle on the torus, we draw the corresponding line of latitude.
        % Latitudinal lines vary in their azimuthal angle. 
        % Note that the paths on the tori have the same equation, and we just vary a different parameter.
        \foreach \polarAngle in {0,10,...,350}{
        \draw[variable=\azimuthalAngle,domain=0:360,smooth] 
        plot 
        (
        {\torusRadius{\variableTheta}*\sphereX{\azimuthalAngle}{\polarAngle}+\torusCenter{\variableTheta}*cos(\azimuthalAngle)},
        {\torusRadius{\variableTheta}*\sphereY{\azimuthalAngle}{\polarAngle}+\torusCenter{\variableTheta}*sin(\azimuthalAngle)},
        {\torusRadius{\variableTheta}*\sphereZ{\azimuthalAngle}{\polarAngle}}
        );
        }

        % We follow a similar strategy for the sphere.
        % Here we draw the lines of longitude (which vary in their polar angles)
        % The radius of the sphere is the distance from the origin to any center of a longitudinal line on the torus.
        % The Center of the sphere is the radius of the torus. This makes them intersect orthogonally.
        \foreach \azimuthalAngle in {0,10,...,350}{
        \draw[variable=\polarAngle,domain=0:360,smooth] 
        plot 
        (
        {\torusCenter{\variableTheta}*\sphereX{\azimuthalAngle}{\polarAngle}},
        {\torusCenter{\variableTheta}*\sphereY{\azimuthalAngle}{\polarAngle}},
        {\torusRadius{\variableTheta}+\torusCenter{\variableTheta}*\sphereZ{\azimuthalAngle}{\polarAngle}}
        );
        }

        % And for the latitudinal lines, we vary the azimuthal angle in the same formula.
        \foreach \polarAngle in {0,10,...,350}{
        \draw[variable=\azimuthalAngle,domain=0:360,smooth] 
        plot 
        (
        {\torusCenter{\variableTheta}*\sphereX{\azimuthalAngle}{\polarAngle}},
        {\torusCenter{\variableTheta}*\sphereY{\azimuthalAngle}{\polarAngle}},
        {\torusRadius{\variableTheta}+\torusCenter{\variableTheta}*\sphereZ{\azimuthalAngle}{\polarAngle}}
        );
        }
        
    \end{tikzpicture}
\end{document}

The source code is at Github (Symmetry_in_Stereographic_Projection_of_90_degree_Rotated_Sphere.py), with MIT License.

Leave a Reply

Your email address will not be published.