")


Edit and compile if you like:
\documentclass{standalone}
\usepackage{pgfplots}
\pgfplotsset{compat=newest}
\begin{document}
\begin{tikzpicture}
\begin{axis}[
axis equal image,
axis lines=middle,
xmax=18,zmax=5,
ticks=none,
clip bounding box=upper bound,
colormap/blackwhite
]
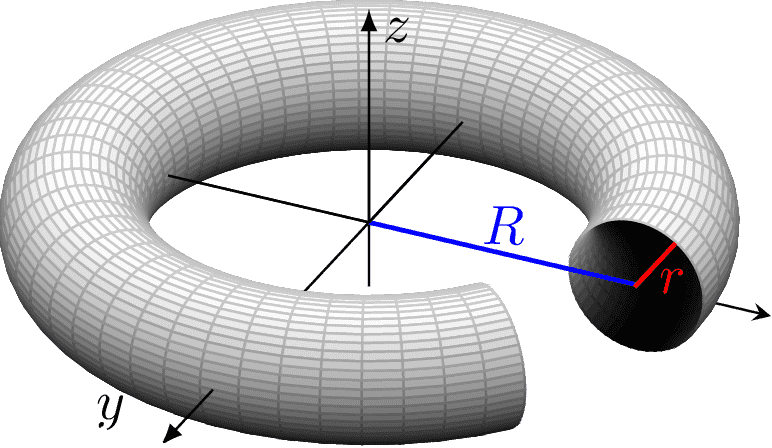
\addplot3[domain=0:360,y domain=0:320, samples=50,surf,z buffer=sort]
({(12 + 3 * cos(x)) * cos(y)} ,
{(12 + 3 * cos(x)) * sin(y)},
{3 * sin(x)});
% use axis coordinate system to draw the radii
\draw [thick,blue] (axis cs: 0,0,0) -- (axis cs: 12,0,0) node [midway,above=-2] {$R$};
\draw [thick,red] (axis cs: 12,-0.2,0) -- (axis cs: 12,3.7,0) node [midway,below right=-3] {$r$};
% use axis coordinate system to draw fake x, y and z axes
\draw [-latex] (axis cs: 0,0,0) -- node [pos=0.9, xshift=0.5em]{$z$}(axis cs: 0,0,10);
\draw [-latex] (axis cs: 0,-15,0) --
node [pos=0.9, xshift=-1em, yshift=0.5em]{$y$}(axis cs: 0,-20,0);
\draw (axis cs: 0,0,0) -- (axis cs: 0,9,0);
\draw (axis cs: 0,0,0) -- (axis cs: -9,0,0);
\end{axis}
\end{tikzpicture}
\end{document}
Click to download: torus.tex
Open in Overleaf: torus.tex
This file is available on tikz.netlify.app and on GitHub and is MIT licensed.
See more on the author page of Janosh Riebesell..


