\documentclass[tikz,border=10pt]{standalone}
\begin{document}
% Adjusts the size of the wheel:
\def\innerradius{1.8cm}
\def\outerradius{2.2cm}
% The main macro
\newcommand{\wheelchart}[1]{
% Calculate total
\pgfmathsetmacro{\totalnum}{0}
\foreach \value/\colour/\name in {#1} {
\pgfmathparse{\value+\totalnum}
\global\let\totalnum=\pgfmathresult
}
\begin{tikzpicture}
% The text in the center of the wheel
\node[align=center,text width=2*\innerradius]{Ratings given by \pgfmathprintnumber{\totalnum}~participants};
% Calculate the thickness and the middle line of the wheel
\pgfmathsetmacro{\wheelwidth}{\outerradius-\innerradius}
\pgfmathsetmacro{\midradius}{(\outerradius+\innerradius)/2}
% Rotate so we start from the top
\begin{scope}[line width=\wheelwidth,rotate=90]
% Loop through each value set. \cumnum keeps track of where we are in the wheel
\pgfmathsetmacro{\cumnum}{0}
\foreach \value/\colour/\name in {#1} {
\pgfmathsetmacro{\newcumnum}{\cumnum + \value/\totalnum*360}
% Calculate the percent value
\pgfmathsetmacro{\percentage}{\value/\totalnum*100}
% Calculate the mid angle of the colour segments to place the labels
\pgfmathsetmacro{\midangle}{-(\cumnum+\newcumnum)/2}
% This is necessary for the labels to align nicely
\pgfmathparse{
(-\midangle<5?"south":
(-\midangle<85?"south west":
(-\midangle<105?"west":
(-\midangle<175?"north west":
(-\midangle<185?"north":
(-\midangle<265?"north east":
(-\midangle<275?"east":
(-\midangle<355?"south east":"south")
)
)
)
)
)
)
)
} \edef\textanchor{\pgfmathresult}
% Draw the color segments. Somehow, the \midrow units got lost, so we add 'pt' at the end. Not nice...
\draw[\colour] (-\cumnum:\midradius pt) arc (-\cumnum:-(\newcumnum):\midradius pt);
% Draw the data labels
\node at (\midangle:\outerradius + 1ex) [inner sep=0pt, outer sep=0pt, ,anchor=\textanchor]{\name: \value\ (\pgfmathprintnumber{\percentage}\%)};
% The 'spokes'
\foreach \i in {0,...,\value} {
\draw [gray,thin] (-\cumnum-\i/\totalnum*360:\innerradius) -- (-\cumnum-\i/\totalnum*360:\outerradius);
}
% Set the old cumulated angle to the new value
\global\let\cumnum=\newcumnum
}
\end{scope}
\draw[gray] (0,0) circle (\outerradius) circle (\innerradius);
\end{tikzpicture}
}
% Usage: \wheelchart{//, ...}
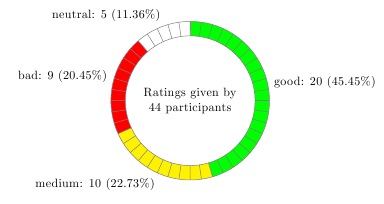
\wheelchart{20/green/good, 10/yellow/medium, 9/red/bad, 5/white/neutral}
\end{document}
")