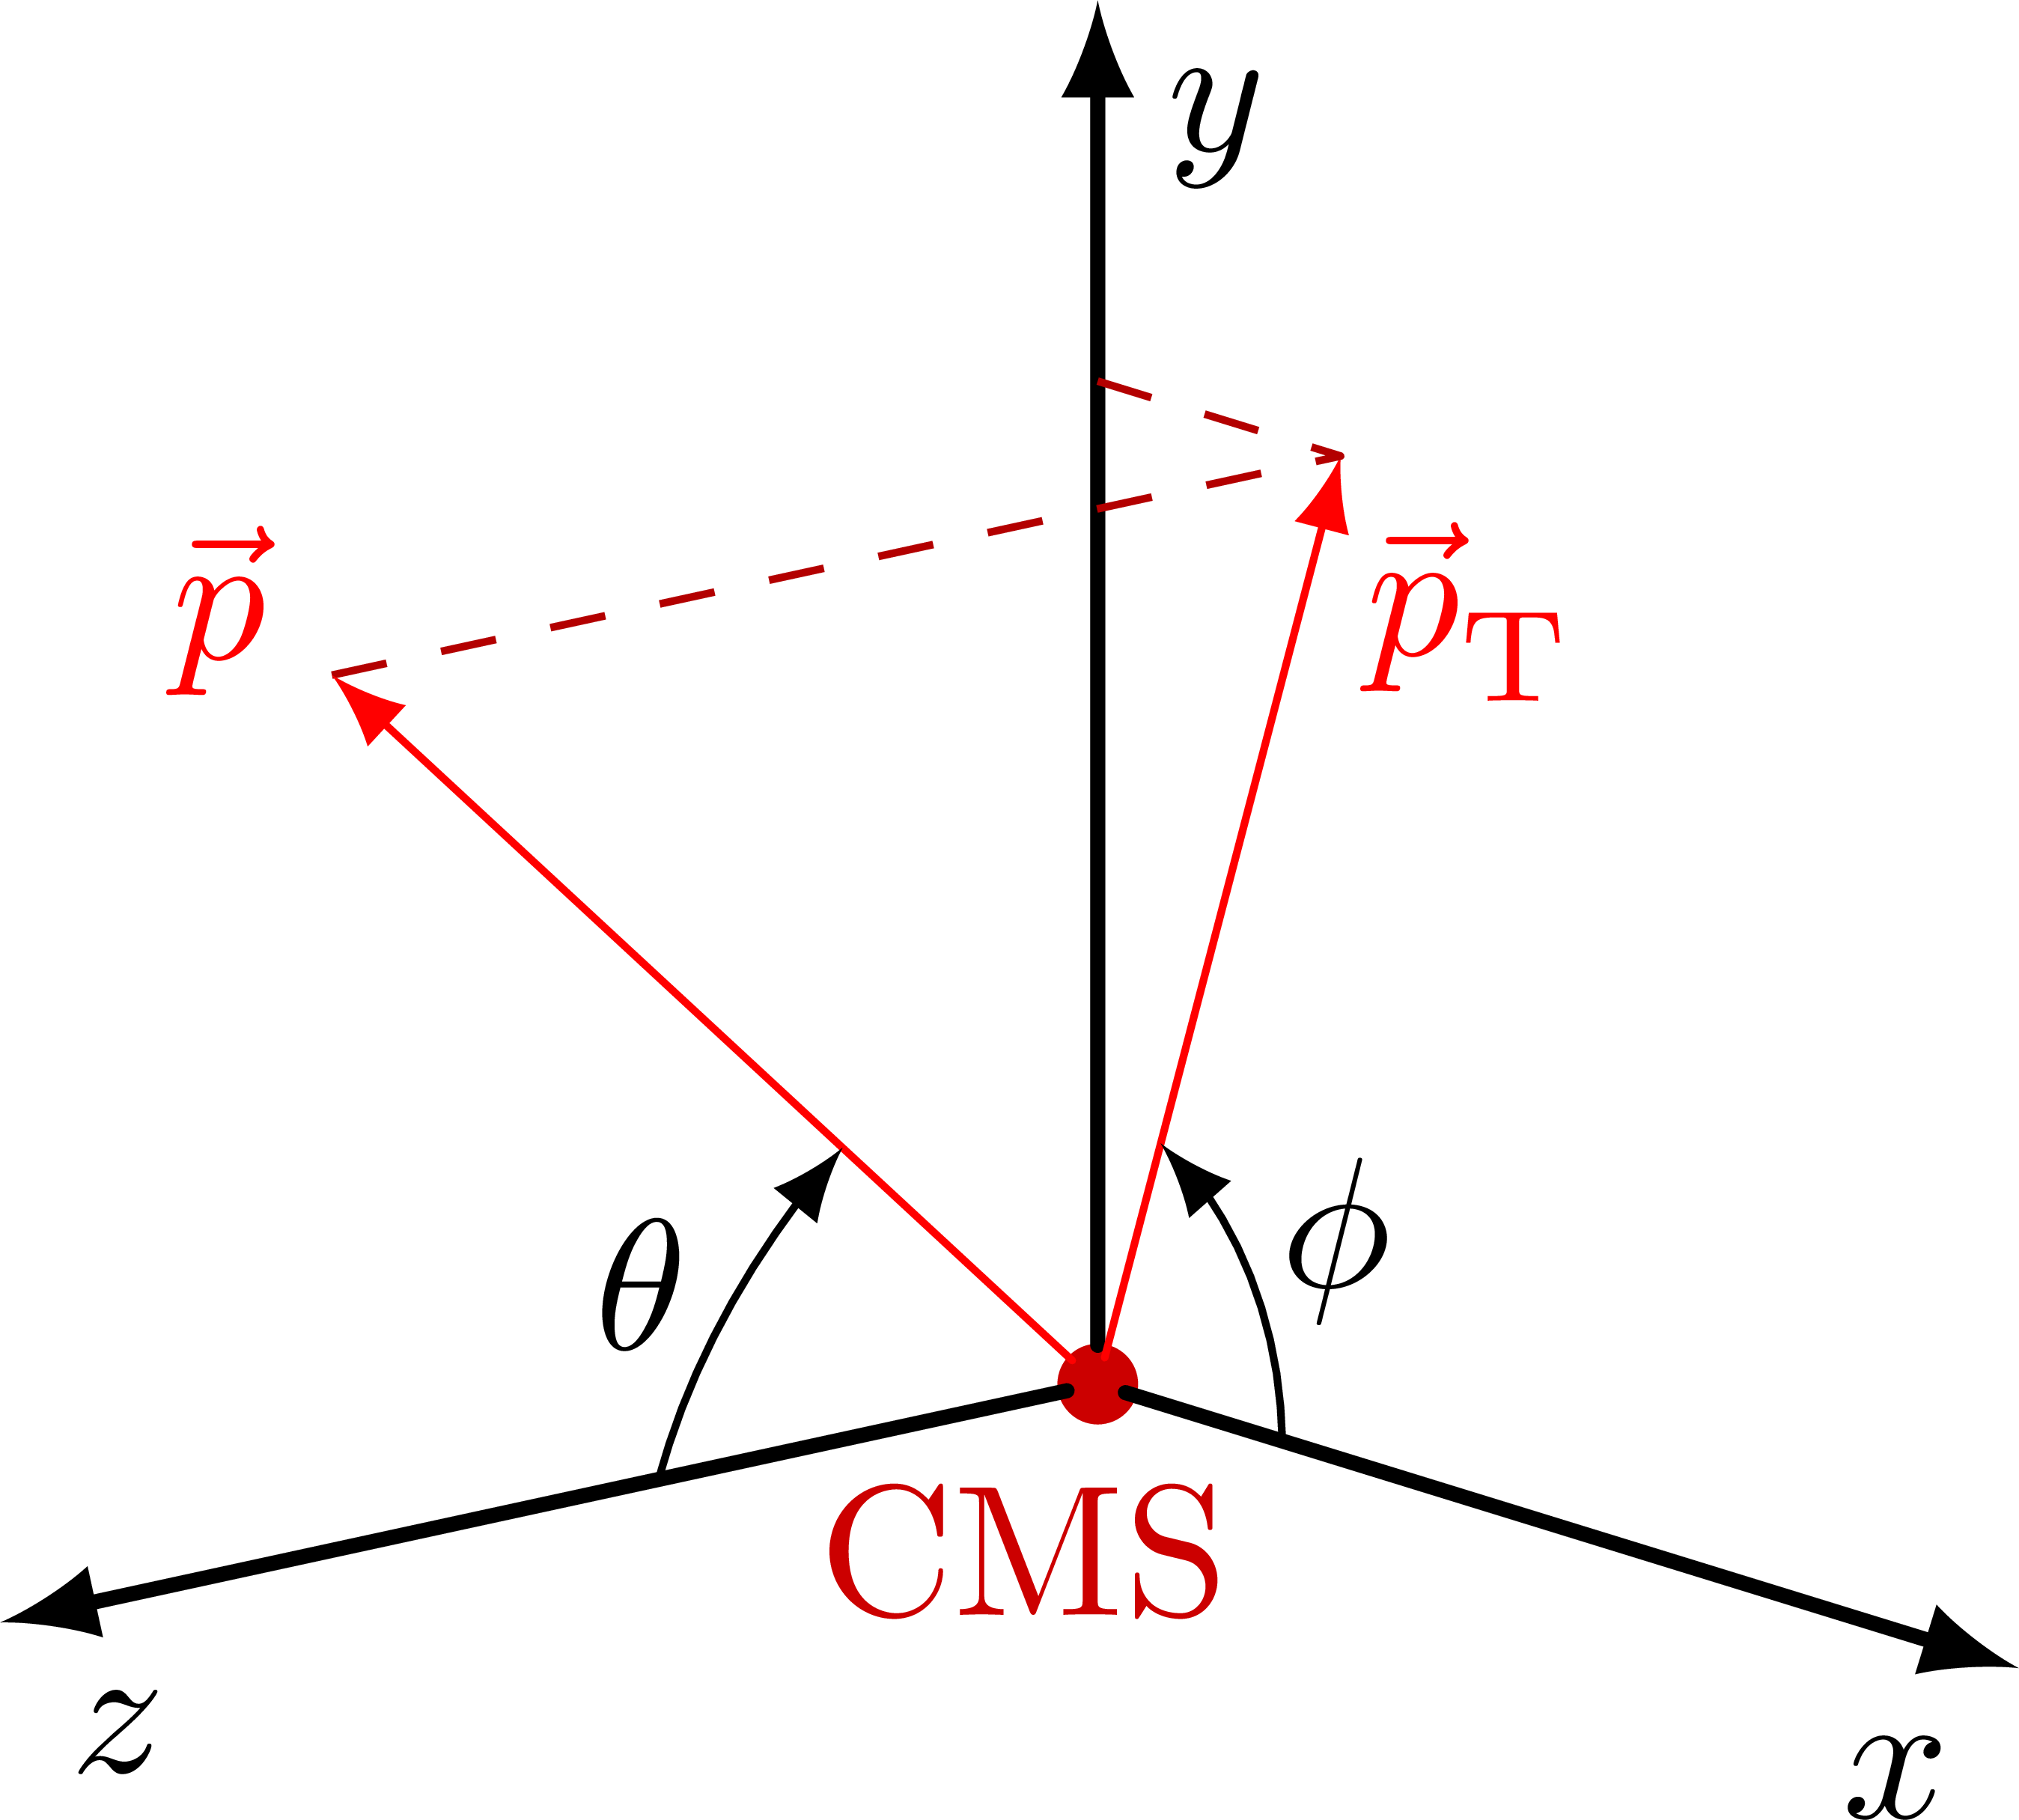
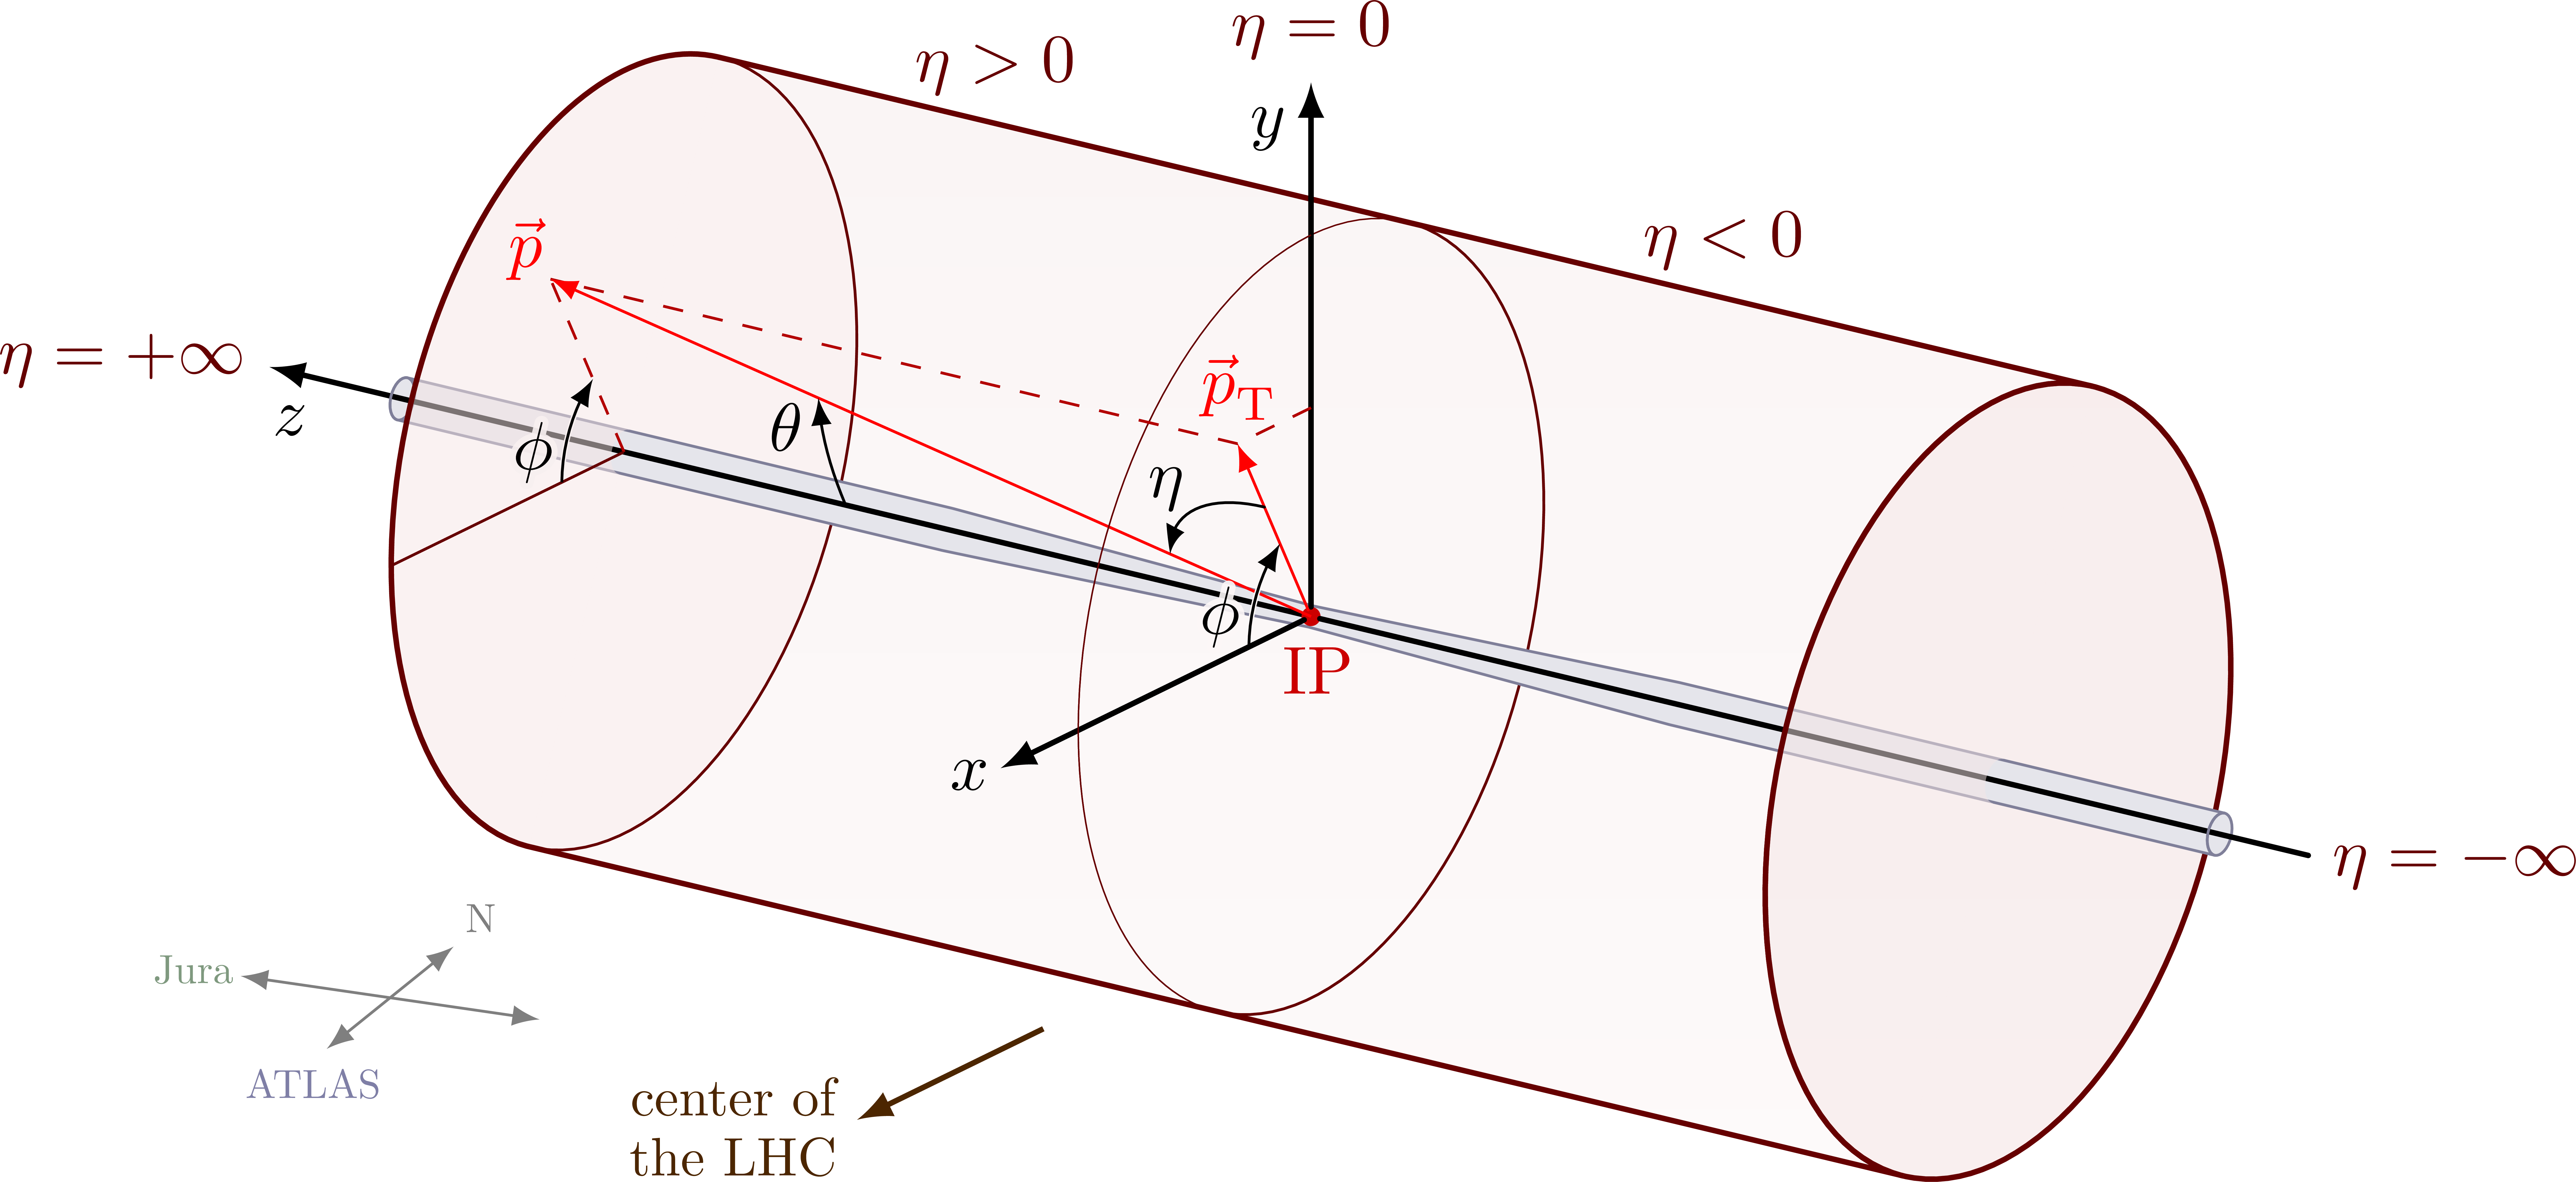
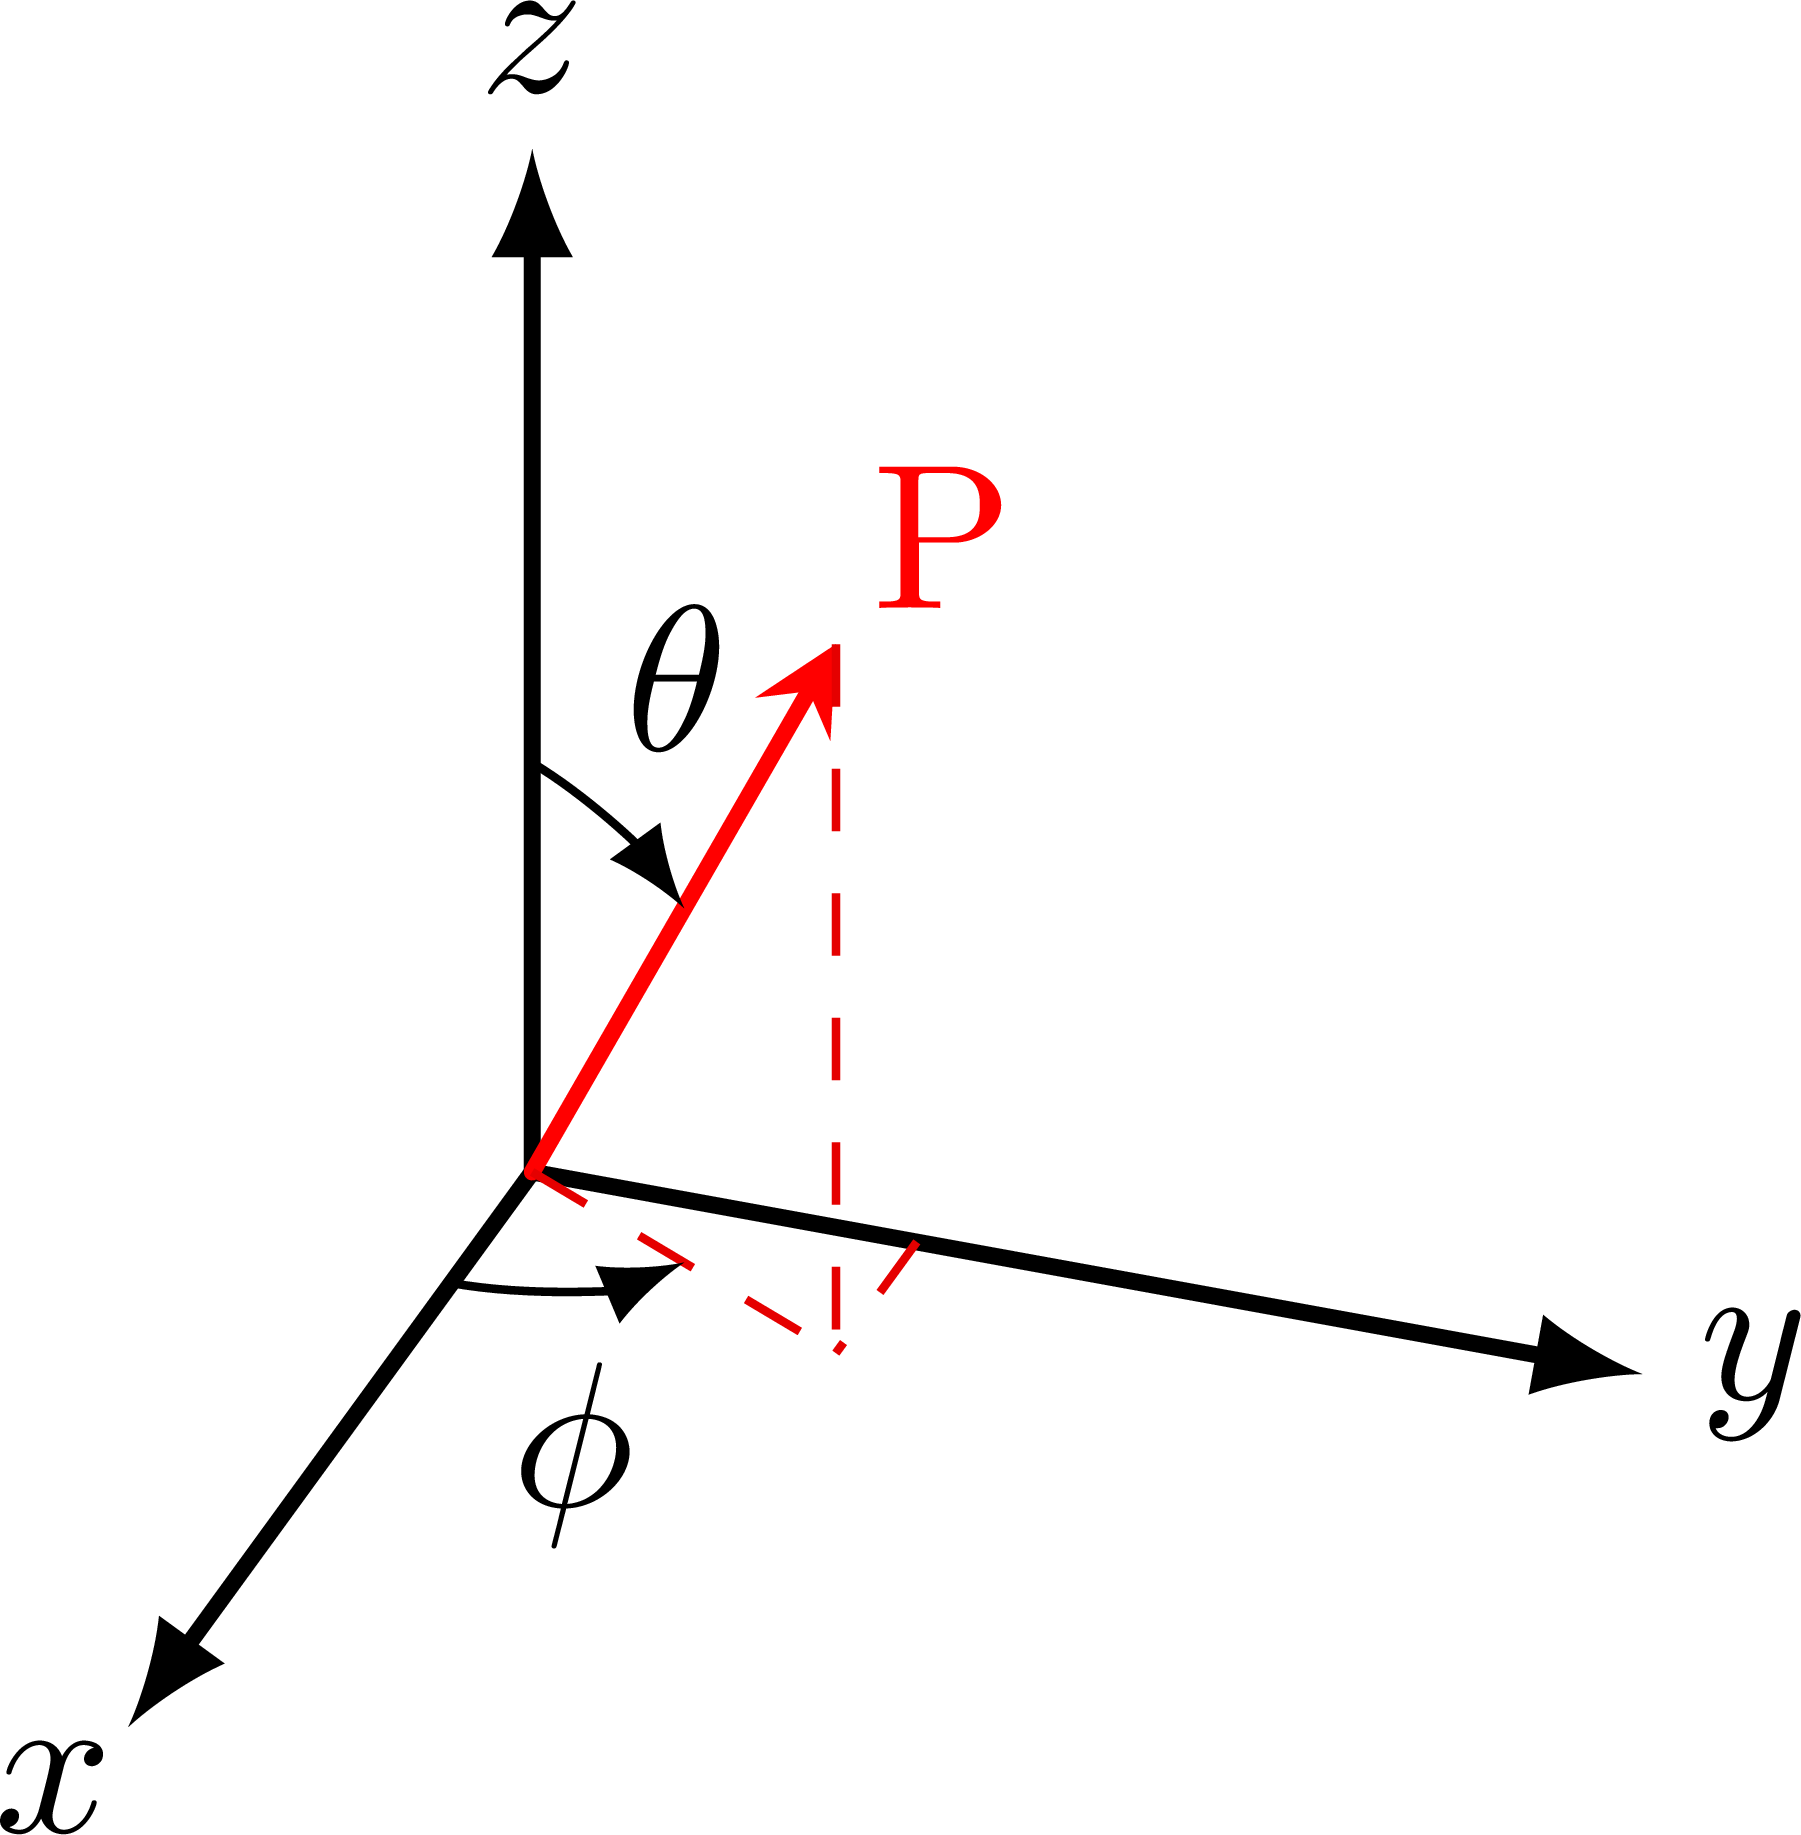
CMS coordinate system

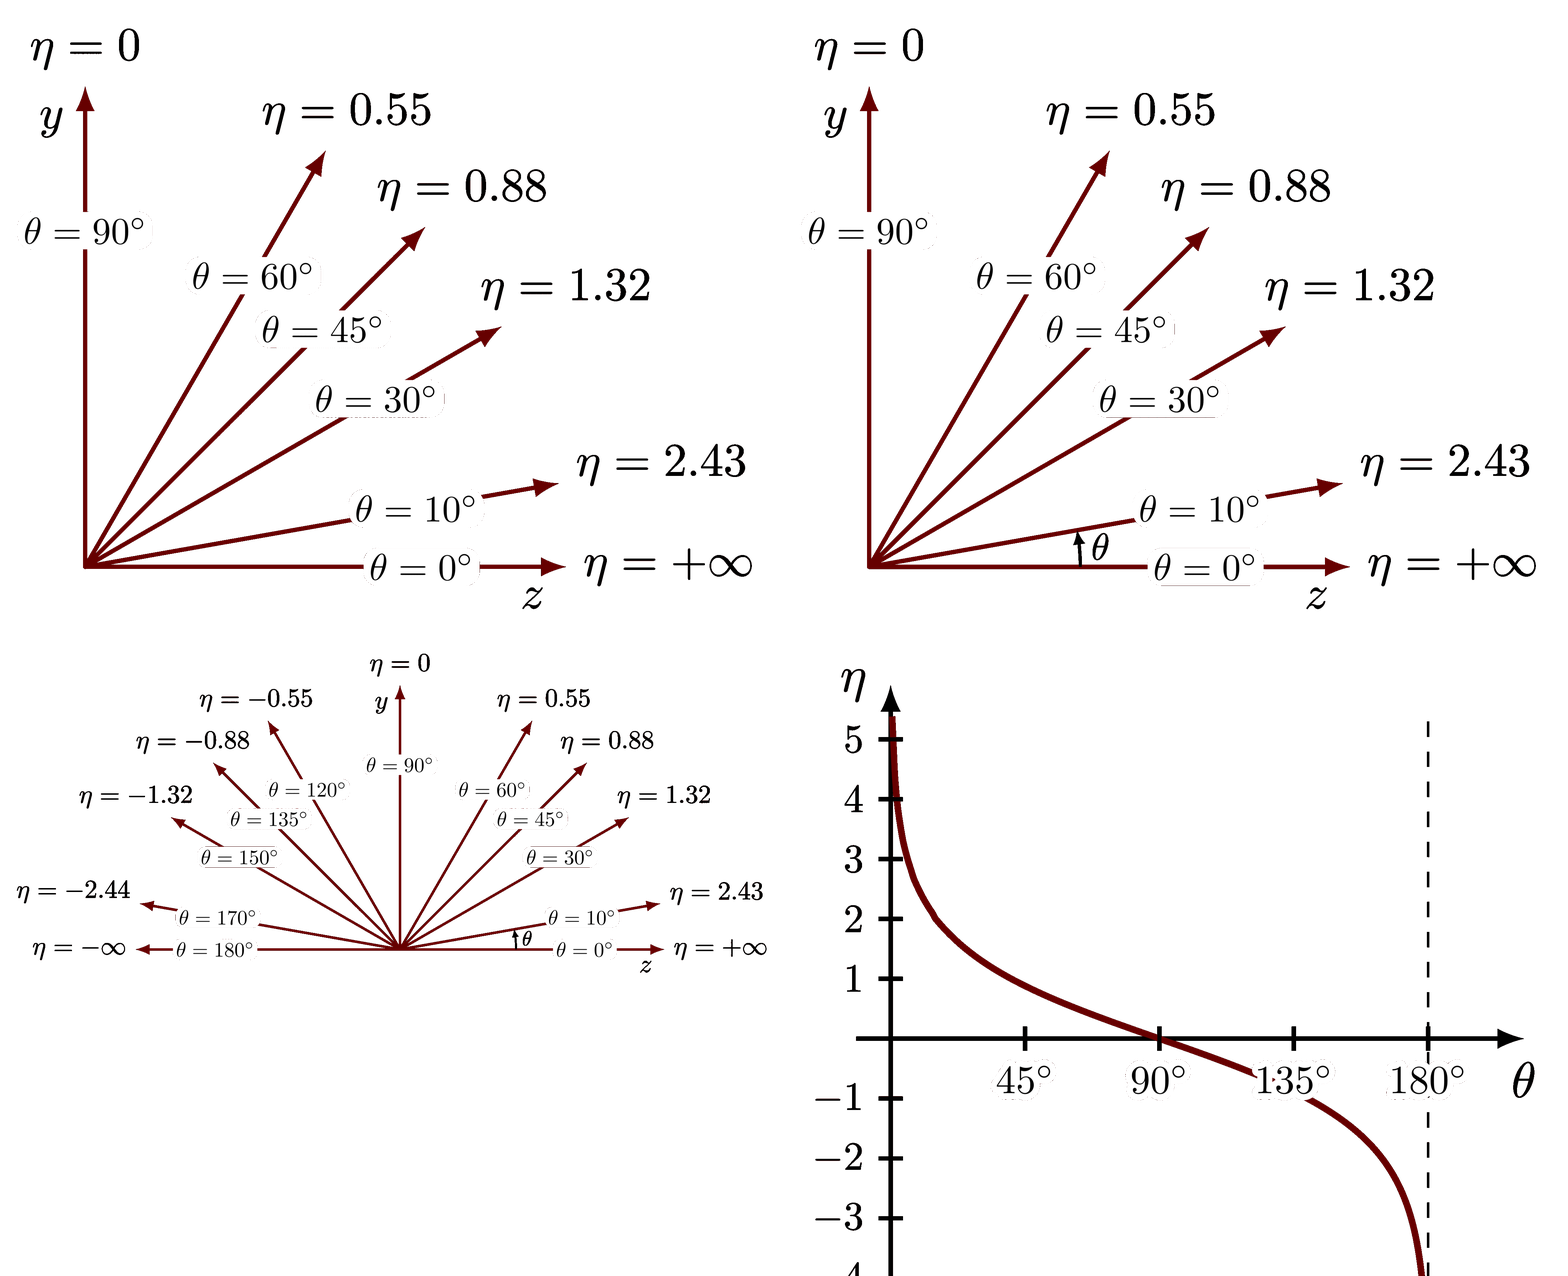
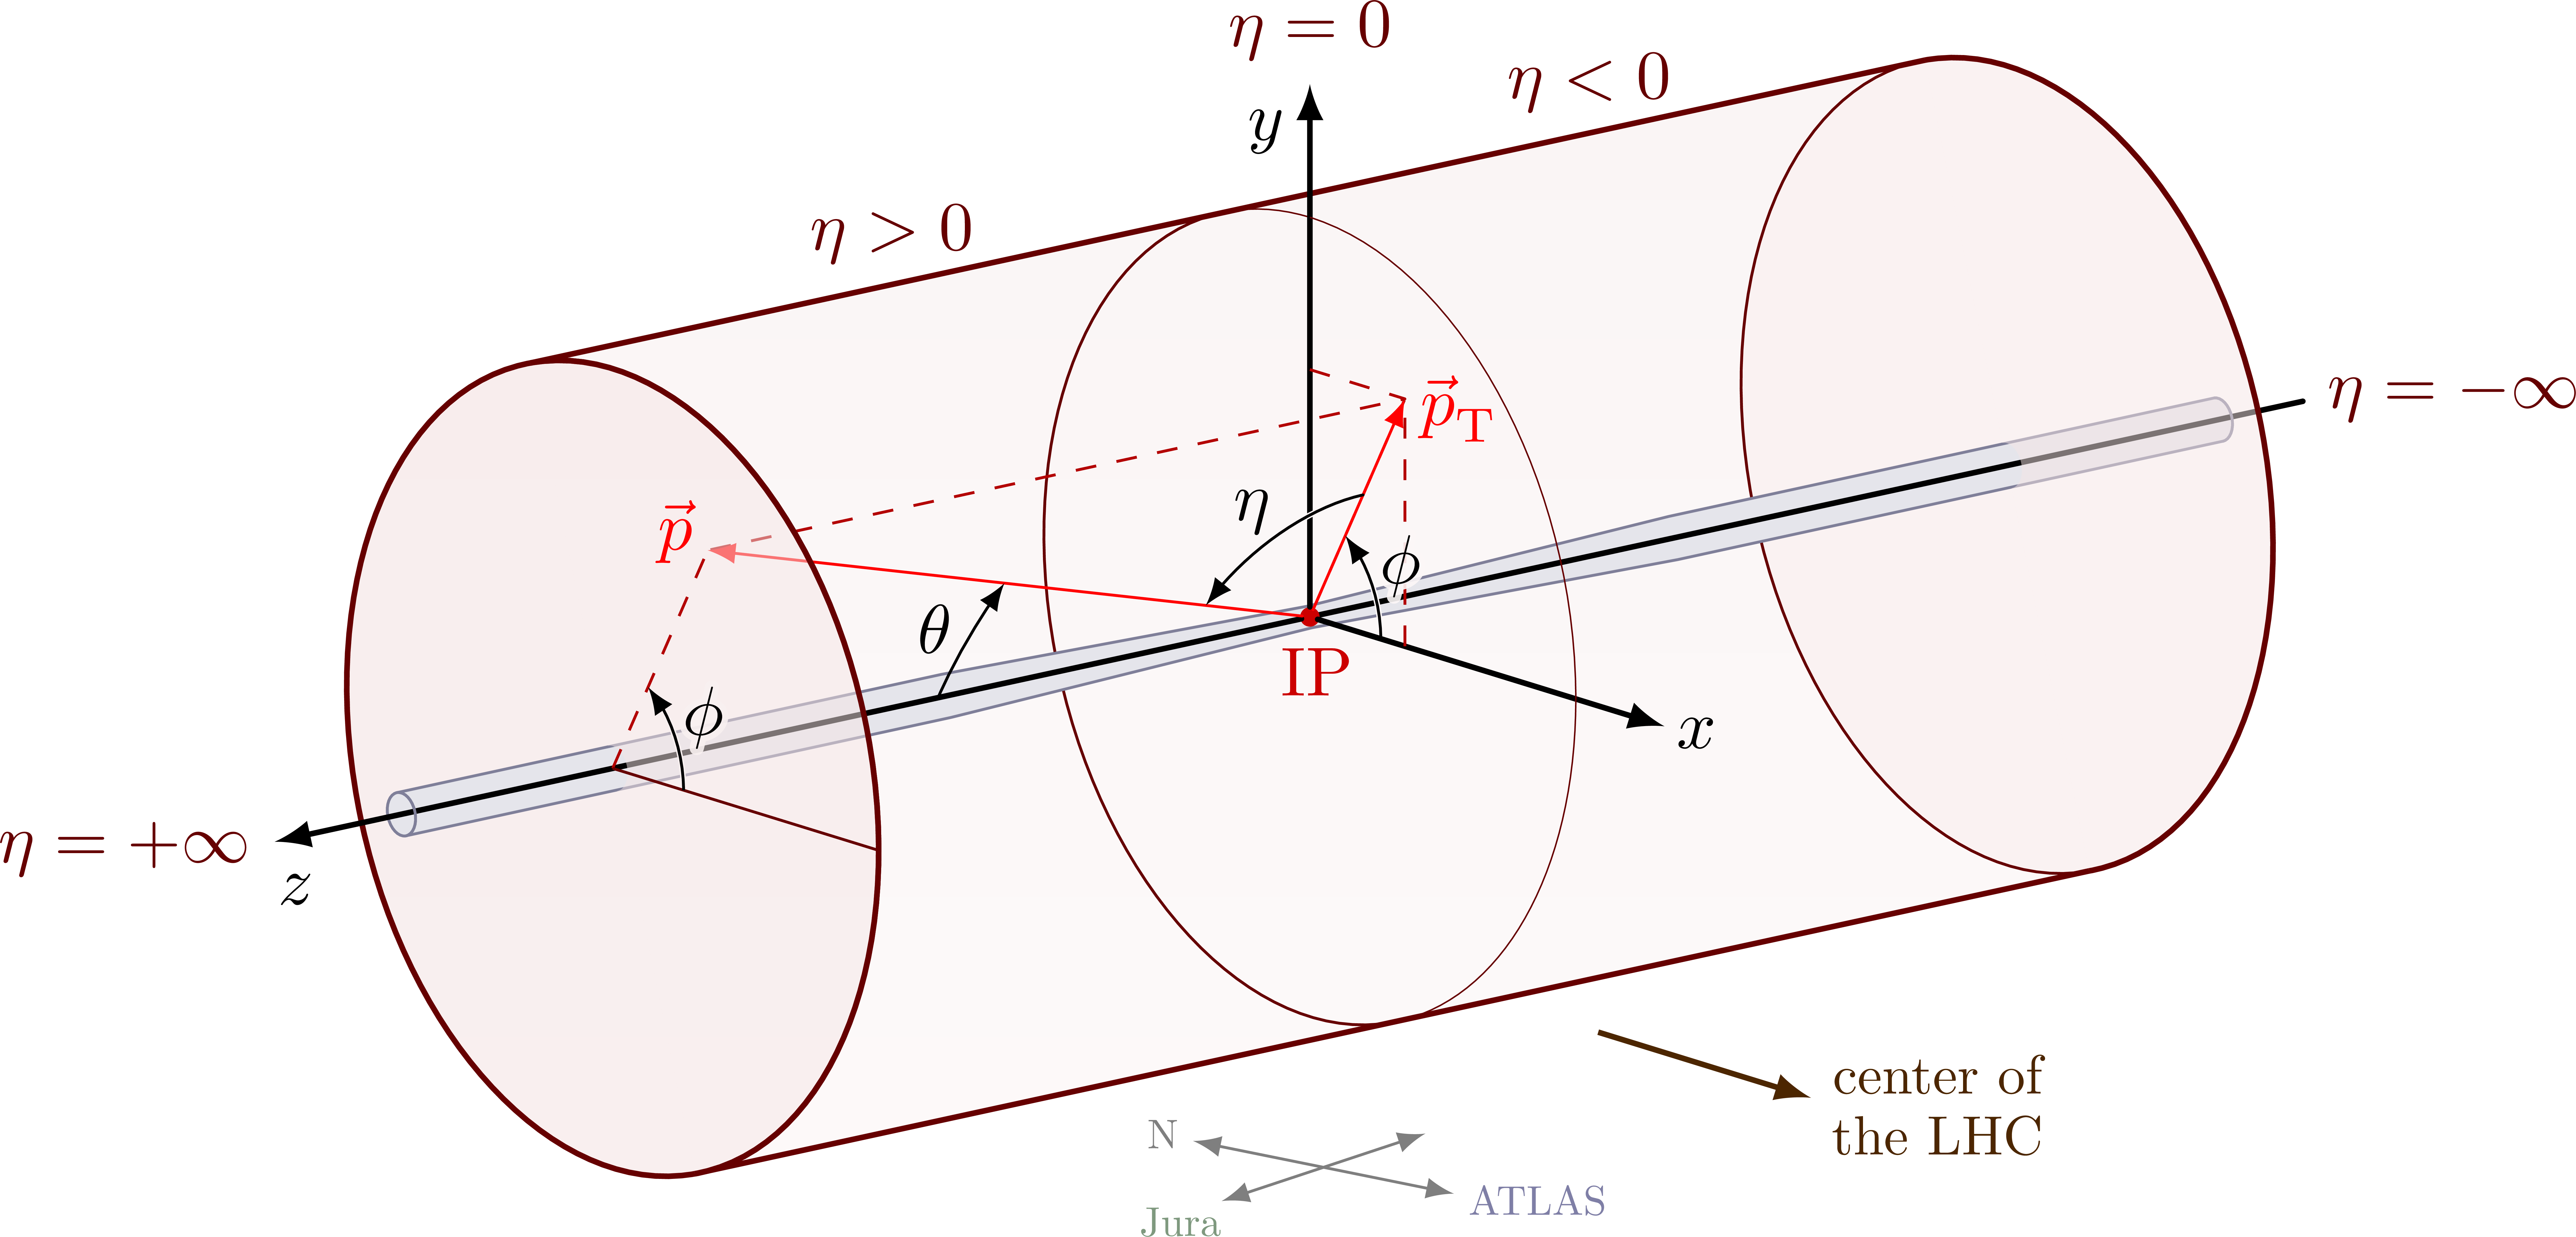
The conventional 3D coordinate system at the CMS detector with definition of the azimuthal angle φ. It is officially described in this paper. For more coordinate systems, please see the “coordinates” tag. For the definition of pseudorapidity, please see here. For more related figures, please see the Particle Physics category.

Minimal CMS coordinate system:axis3D_CMS-001.png
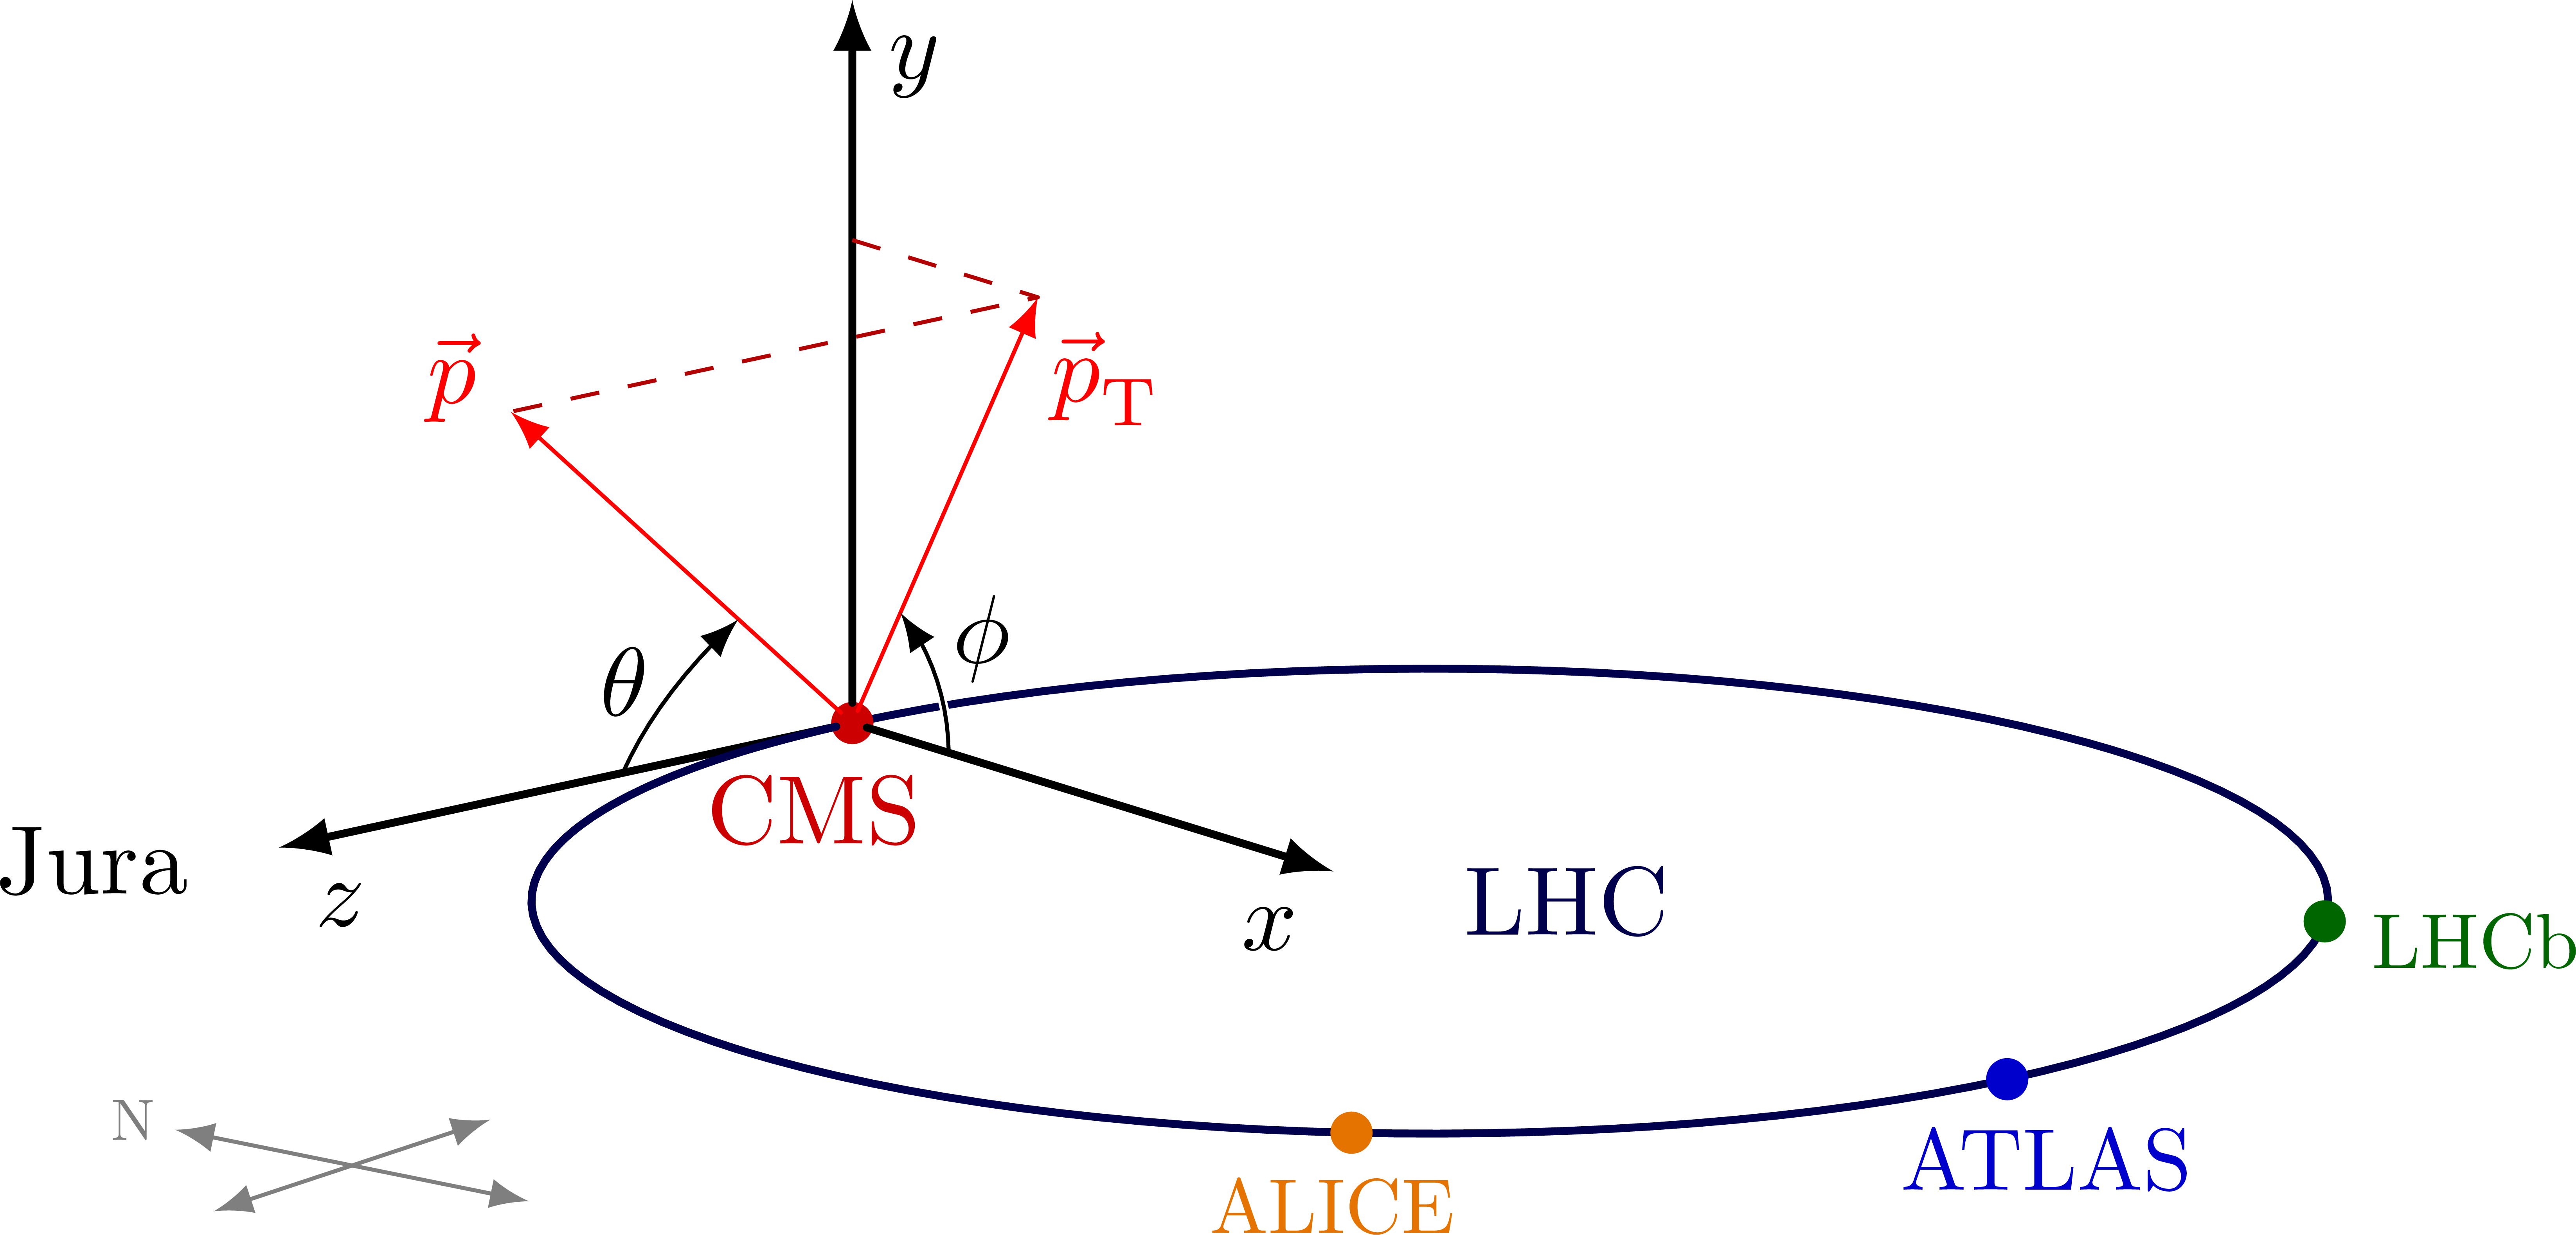
The CMS coordinate system, including the LHC and a compass (the z axis points to the Jura):axis3D_CMS-002.png
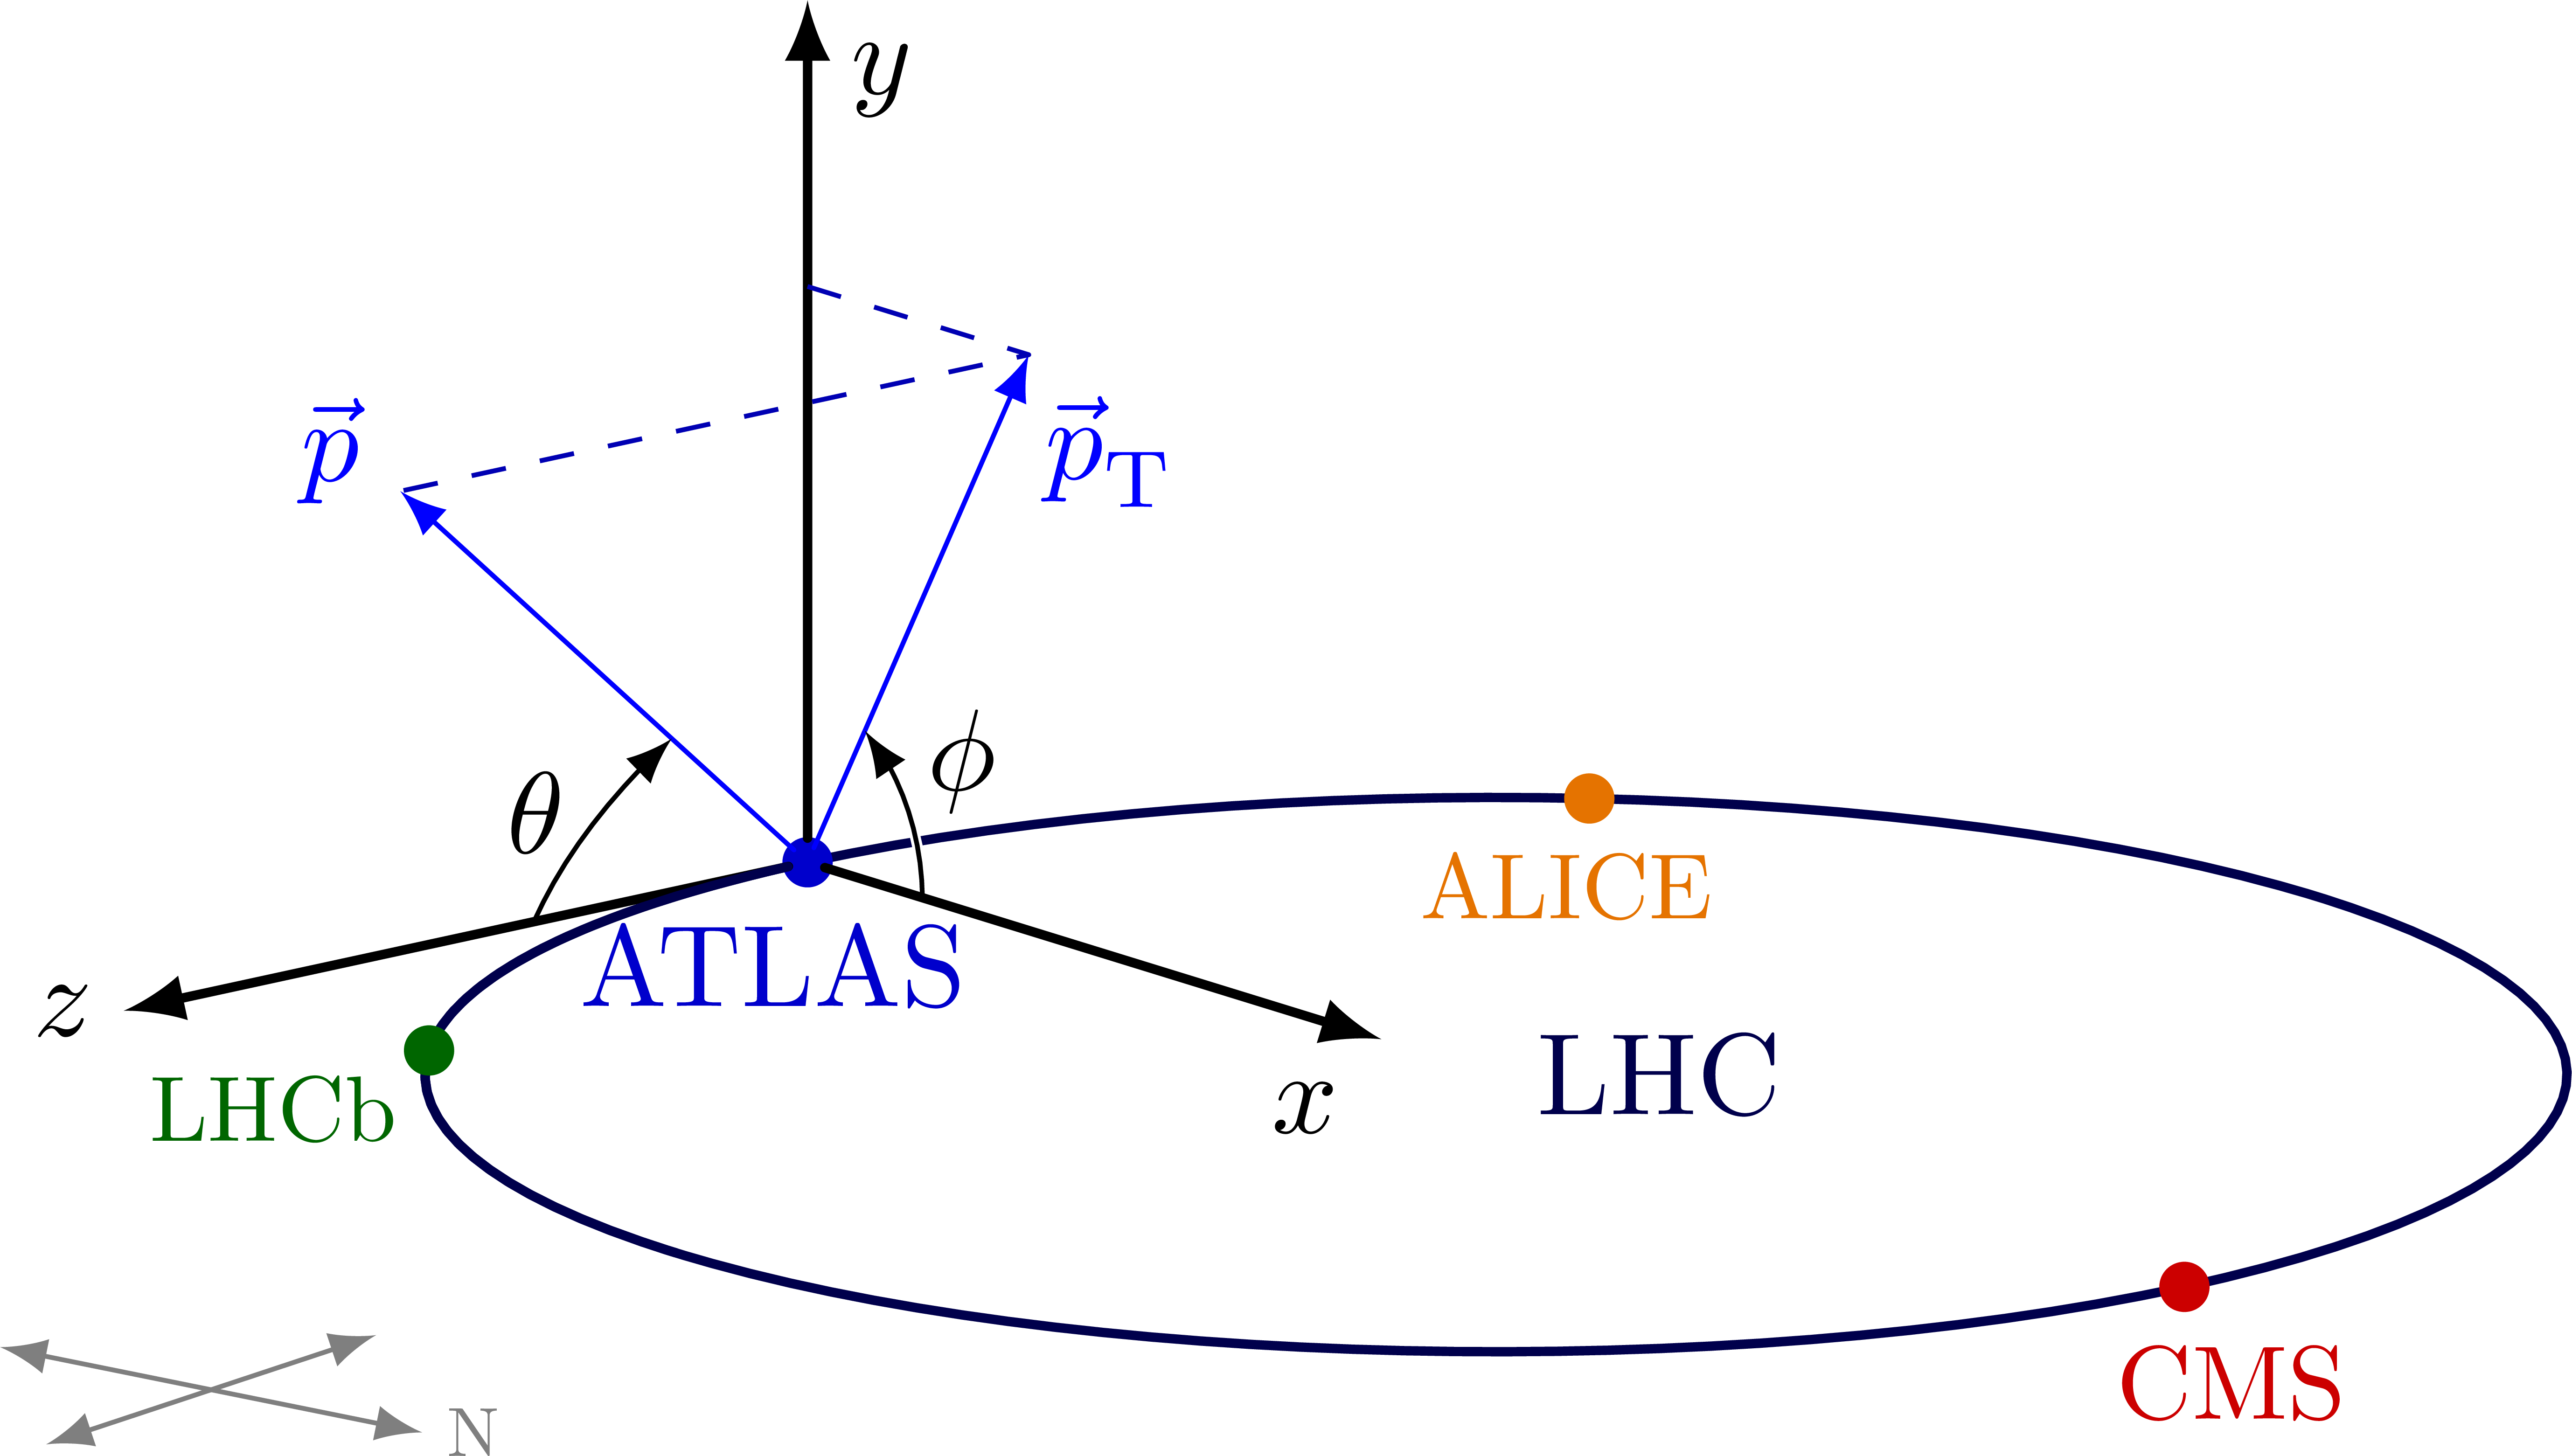
The ATLAS coordinate system, including the LHC:axis3D_CMS-003.png
CMS coordinate system with the a cylindrical detector:axis3D_CMS-004.pngaxis3D_CMS-005.png
Edit and compile if you like:

% Author: Izaak Neutelings (June 2017)
% Inspiration: https://tex.stackexchange.com/questions/159445/draw-in-cylindrical-and-spherical-coordinates
% Uploaded to https://tikz.net/axis3d_cms/

\documentclass[border=3pt,tikz]{standalone}
\usepackage{physics}
\usepackage{tikz}
\usepackage{tikz-3dplot}
\usetikzlibrary{arrows.meta} % for arrow size
\usetikzlibrary{3d} % for canvas is
\usepackage{xcolor}
\usepackage[outline]{contour} % glow around text
\contourlength{0.9pt}
\usetikzlibrary{bending} % for arrow head angle

\colorlet{veccol}{green!50!black}
\colorlet{myred}{red!70!black}
\colorlet{mycontourred}{red!55!black!3} % for contour
\colorlet{mycontourred2}{red!55!black!6} % for contour
\colorlet{myblue}{blue!70!black}
\colorlet{mydarkred}{red!40!black}
\colorlet{mydarkblue}{blue!30!black}
\colorlet{CMScol}{red!80!black}
\colorlet{ATLAScol}{blue!80!black}
\tikzset{>=latex} % for LaTeX arrow head
\tikzstyle{axis}=[->,thick,line cap=round]
\tikzstyle{detector}=[thick,draw=mydarkred,rotate around z=\ang]
\tikzstyle{beam pipe}=[draw=blue!20!black!50,fill=blue!20!black!10,rotate around z=\ang]
\tikzstyle{detector surface}=[red!60!black!10,opacity=0.5,rotate around z=\ang]
\usetikzlibrary{angles,quotes} % for pic (angle labels)
\newcommand*{\vv}[1]{\vec{\mkern0mu#1}} % aligned vector arrow

\begin{document}


% CMS conventional coordinate system
\tdplotsetmaincoords{75}{50} % to reset previous setting
\begin{tikzpicture}[scale=2.7,tdplot_main_coords,rotate around x=90]
  
  % VARIABLES
  \def\rvec{1.2}
  \def\thetavec{40}
  \def\phivec{70}
  \def\w{0.2}
  \coordinate (O) at (0,0,0);
  \tdplotsetcoord{O'}{0.04}{\thetavec}{\phivec} % shifted
  \tdplotsetcoord{O''}{0.022}{90}{\phivec} % shifted
  \tdplotsetcoord{P}{\rvec}{\thetavec}{\phivec}
  
  % AXES
  \fill[black!20!red] (O) circle(0.8pt) node[left=4,below=2] {CMS};
  \draw[axis] (0,0.028,0) -- (0,1,0) node[below right]{$y$};
  \draw[axis] (0,0,0.028) -- (0,0,1) node[below right]{$z$};
  \draw[axis] (0.030,0,0) -- (1,0,0) node[below left]{$x$};
  
  % VECTORS
  %\fill[radius=0.4,red] (P) circle;
  %\draw[dashed,myred] (O'') -- (Pxy);
  %\draw[dashed,myred] (Px) -- (Pxy);
  \draw[->,red,line cap=round] (O'') -- (Pxy) node[anchor=130] {$\vv{p}_\mathrm{T}$};
  \draw[dashed,myred,line join=round] (Py) -- (Pxy) -- (P);
  \draw[->,red,line cap=round] (O') -- (P) node[anchor=-30] {$\vv{p}$};
  
  % ARCS
  \tdplotdrawarc[->]{(O)}{0.2}{0}{\phivec}
    {anchor=-160,inner sep=1.5pt}{$\phi$} %{\contour{white}{$\phi$}}
  \tdplotdrawarc[->,rotate around z=\phivec-90,rotate around y=-90]{(O)}{0.4}{0}{\thetavec}
    {anchor=mid east,inner sep=2pt}{$\theta$}
  
\end{tikzpicture}


% CMS conventional coordinate system with LHC and other detectors
\tdplotsetmaincoords{75}{50} % to reset previous setting
\begin{tikzpicture}[scale=2.7,tdplot_main_coords,rotate around x=90]
  
  % VARIABLES
  \def\rvec{1.2}
  \def\thetavec{40}
  \def\phivec{60}
  \def\R{1.2}
  \def\w{0.3}
  \coordinate (O) at (0,0,0);
  \tdplotsetcoord{O'}{0.04}{\thetavec}{\phivec} % shifted
  \tdplotsetcoord{O''}{0.022}{90}{\phivec} % shifted
  \tdplotsetcoord{P}{\rvec}{\thetavec}{\phivec}
  
  % CIRCLE - LHC (behind)
  \tdplotdrawarc[thick,rotate around x=90,mydarkblue]{(\R,0,0)}{\R}{0}{360}{}{}
  
  % AXES
  \fill[CMScol] (O) circle(0.8pt) node[left=4,below=2] {CMS};
  \draw[axis] (0,0.028,0) -- (0,1,0) node[below right]{$y$};
  \draw[axis] (0,0,0.028) -- (0,0,1) node[below right]{$z$};
  \draw[axis] (0.030,0,0) -- (1,0,0) node[below left]{$x$};
  
  % VECTORS
  %\fill[radius=0.4,red] (P) circle;
  %\draw[dashed,myred] (O'') -- (Pxy);
  %\draw[dashed,myred] (Px) -- (Pxy);
  \draw[->,red,line cap=round] (O'') -- (Pxy) node[anchor=130] {$\vv{p}_\mathrm{T}$};
  \draw[dashed,myred,line join=round] (Py) -- (Pxy) -- (P);
  \draw[->,red,line cap=round] (O') -- (P) node[anchor=-30] {$\vv{p}$};
  
  % CIRCLE - LHC (front)
  \tdplotdrawarc[thick,rotate around x=90,mydarkblue,line cap=round]{(\R,0,0)}{\R}{178.6}{90}{}{}
  
  % COMPASS - CMS-ATLAS axis has a ~12° declination (http://googlecompass.com)
  \begin{scope}[shift={(1.1*\R,0,1.65*\R)},rotate around y=12]
    \draw[<->,black!50] (-\w,0,0) -- (\w,0,0);
    \draw[<->,black!50] (0,0,-\w) -- (0,0,\w);
    \node[above=1,left,black!50,scale=0.6] at (-\w,0,0) {N};
  \end{scope}
  
  %% COMPASS - CMS-ATLAS axis has a ~12° declination (http://googlecompass.com) (flat
  %\begin{scope}[shift={(1.1*\R,0,1.65*\R)},rotate around y=12,
  %              canvas is xz plane at y=0,transform shape]
  %  \pgflowlevelsynccm
  %  \draw[{Latex[length=3,width=2]}-{Latex[length=3,width=2]},black!50] (-\w,0) -- (\w,0);
  %  \draw[{Latex[length=3,width=2]}-{Latex[length=3,width=2]},black!50] (0,-\w) -- (0,\w);
  %  \node[below=1,black!50,scale=0.4,xscale=-1,rotate=90] at (-\w,0) {N};
  %\end{scope}
  
  % NODES
  \node[left,align=center] at (0,0,1.1) {Jura};
  \node[right,mydarkblue] at (\R,0,0) {LHC};
  \fill[ATLAScol]
    (2*\R,0,0) circle(0.8pt)
    node[right=4,below=2,scale=0.9] {ATLAS};
  \fill[black!10!orange,rotate around x=90]
    (\R,0,0)++(45:\R) circle(0.8pt) % 45 degrees from ATLAS
    node[left=2,below=2,scale=0.8] {ALICE};
  \fill[black!60!green,rotate around x=90]
    (\R,0,0)++(-45:\R) circle(0.8pt) % 45 degrees from ATLAS
    node[below=2,right=2,scale=0.8] {LHCb};
  
  % ARCS
  \tdplotdrawarc[white,line width=0.9]{(O)}{0.2}{4}{\phivec-4}{}{}
  \tdplotdrawarc[->]{(O)}{0.2}{0}{\phivec}
    {anchor=-140,inner sep=1.5pt}{$\phi$} %\contour{white}{$\phi$}}
  \tdplotdrawarc[->,rotate around z=\phivec-90,rotate around y=-90]{(O)}{0.4}{0}{\thetavec}
    {anchor=mid east,inner sep=2pt}{$\theta$}
  
\end{tikzpicture}


% ATLAS conventional coordinate system with LHC and other detectors
\tdplotsetmaincoords{75}{50} % to reset previous setting
\begin{tikzpicture}[scale=2.7,tdplot_main_coords,rotate around x=90]
  
  % VARIABLES
  \def\rvec{1.2}
  \def\thetavec{40}
  \def\phivec{60}
  \def\R{1.2}
  \def\w{0.3}
  \coordinate (O) at (0,0,0);
  \tdplotsetcoord{O'}{0.04}{\thetavec}{\phivec} % shifted
  \tdplotsetcoord{O''}{0.022}{90}{\phivec} % shifted
  \tdplotsetcoord{P}{\rvec}{\thetavec}{\phivec}
  
  % CIRCLE - LHC (behind)
  \tdplotdrawarc[thick,rotate around x=90,mydarkblue]{(\R,0,0)}{\R}{0}{360}{}{}
  
  % AXES
  \fill[ATLAScol] (O) circle(0.8pt) node[left=3,below=2] {ATLAS};
  \draw[axis] (0,0.028,0) -- (0,1,0) node[below right]{$y$};
  \draw[axis] (0,0,0.028) -- (0,0,1) node[left=-1]{$z$};
  \draw[axis] (0.030,0,0) -- (1,0,0) node[below left]{$x$};
  
  % VECTORS
  %\fill[radius=0.4,blue] (P) circle;
  %\draw[dashed,myblue] (O'')  -- (Pxy);
  %\draw[dashed,myblue] (Px) -- (Pxy);
  \draw[->,blue,line cap=round] (O'') -- (Pxy) node[anchor=130] {$\vv{p}_\mathrm{T}$};
  \draw[dashed,myblue,line join=round] (Py) -- (Pxy) -- (P);
  \draw[->,blue,line cap=round] (O') -- (P) node[anchor=-30] {$\vv{p}$};
  
  % CIRCLE - LHC (front)
  \tdplotdrawarc[thick,rotate around x=90,mydarkblue,line cap=round]{(\R,0,0)}{\R}{178.6}{90}{}{}
  
  % COMPASS - CMS-ATLAS axis has a ~12° declination (http://googlecompass.com)
  \begin{scope}[shift={(1.1*\R,0,1.65*\R)},rotate around y=12]
    \draw[<->,black!50] (-\w,0,0) -- (\w,0,0);
    \draw[<->,black!50] (0,0,-\w) -- (0,0,\w);
    \node[right,black!50,scale=0.6] at (\w,0,0) {N};
  \end{scope}

  % NODES
  %\node[left,align=center] at (0,0,1.1) {Jura};
  \node[right,mydarkblue] at (\R,0,0) {LHC};
  \fill[CMScol]
    (2*\R,0,0) circle(0.8pt)
    node[right=4,below=2,scale=0.9] {CMS};
  \fill[black!10!orange,rotate around x=90]
    (\R,0,0)++(225:\R) circle(0.8pt) % 45 degrees from ATLAS
    node[left=2,below=2,scale=0.8] {ALICE};
  \fill[black!60!green,rotate around x=90]
    (\R,0,0)++(135:\R) circle(0.8pt) % 45 degrees from ATLAS
    node[below=5,left=0,scale=0.8] {LHCb};
  
  % ARCS
  \tdplotdrawarc[white,line width=0.9]{(O)}{0.2}{4}{\phivec-4}{}{}
  \tdplotdrawarc[->]{(O)}{0.2}{0}{\phivec}
    {anchor=-140,inner sep=1.5pt}{$\phi$} %\contour{white}{$\phi$}}
  \tdplotdrawarc[->,rotate around z=\phivec-90,rotate around y=-90]{(O)}{0.4}{0}{\thetavec}
    {anchor=mid east,inner sep=2pt}{$\theta$}

\end{tikzpicture}


% CMS detector - west perspective
\tdplotsetmaincoords{75}{50} % to reset previous setting
\begin{tikzpicture}[scale=2.8,tdplot_main_coords,rotate around x=90]
  
  % VARIABLES
  \def\rvec{\L/2/cos(\thetavec)}
  \def\thetavec{18}
  \def\phivec{60}
  \def\L{3.3}    % detector length
  \def\R{0.75}   % detector cylinder radius
  \def\l{4.3}    % beam pipe length
  \def\r{0.04}   % beam pipe radius
  \def\rt{0.042} % beam pipe radius + line thickness
  \def\xmax{1}   % maximum x axis
  \def\ymax{1}   % maximum y axis
  \def\zmin{-\l/2-0.2} % minimum z axis
  \def\zmax{\l/2+0.3}  % maximum z axis
  \def\w{0.3}
  \coordinate (O) at (0,0,0);
  \coordinate (Z) at (0,0,\L/2);
  \tdplotsetcoord{O'}{0.022}{\thetavec}{\phivec} % slightly shifted origin
  \tdplotsetcoord{O''}{0.018}{90}{\phivec} % slightly shifted origin
  \tdplotsetcoord{P}{\rvec}{\thetavec}{\phivec}
  
  % CYLINDER behind
  \def\ang{18} % rotate lines to simulate cylinder
  \fill[top color=red!50!black!4,bottom color=red!60!black!2,rotate around z=\ang]
    (0,\R,\L/2) --++ (0,0,-\L) arc(90:270:\R) --++ (0,0,\L) arc(270:90:\R) -- cycle;
  \fill[detector surface] % transverse plane at z=L/2
    (0,0,\L/2) --++ (0,\R,0) arc(90:270:\R) -- cycle;
  \fill[detector surface] % transverse plane at z=-L/2
    (0,0,-\L/2) --++ (0,\R,0) arc(90:270:\R) -- cycle;
  \tdplotdrawarc[detector]{(0,0,\L/2)}{\R}{0}{360}{}{} % transverse plane at z=L/2
  \tdplotdrawarc[detector,thin]{(0,0,-\L/2)}{\R}{0}{360}{}{} % transverse plane at z=-L/2
  \draw[detector,thin] % transverse plane at z=0
    (90:\R) arc (90:270:\R);
  %\fill[detector surface] % top piece
  %  (0,\R,\L/2) --++ (0,0,-\L) arc(90:90-\ang:\R) --++ (0,0,\L) arc(90-\ang:90:\R) -- cycle;
  %\draw[detector,canvas is yx plane at z=-\L/2] (0,0,0) circle(\R);
  \draw[detector,very thin] % transverse plane at z=0, top piece
    (90:\R) arc (90:90-\ang:\R);
  \draw[detector] (0,0,-\L/2)++(90:\R) --++ (0,0,\L); % top horizontal
  \draw[detector] (0,0,-\L/2)++(-90:\R) --++ (0,0,\L); % bottom horizontal
  
  % BEAM PIPE
  \tdplotdrawarc[beam pipe]{(0,0,\l/2)}{\r}{0}{360}{}{}
  %\tdplotdrawarc[beam pipe]{(0,0,-\l/2)}{\r}{\ang-90}{90}{}{}
  %\draw[beam pipe] % cylindric beam pipe
  %  (0,\r,-\l/2) --++ (0,0,\l) arc(90:-90:\r)
  %  --++ (0,0,-\l) arc(-90:90:\r);
  \draw[beam pipe] % beam pipe, thinner in middle
    (0,\r,-\l/2) -- (0,\r,-0.2*\l) -- (90:0.5*\r)
    -- (0,\r,0.2*\l) -- (0,\r,0.5*\l) arc(90:-90:\r)
    -- (0,-\r,0.2*\l) -- (-90:0.5*\r) --
    (0,-\r,-0.2*\l) -- (0,-\r,-\l/2) arc(-90:90:\r);
  \draw[beam pipe] (0,0,\l/2) circle(\r);
  
  % AXES
  %\draw[thick,->] (0,0,0) -- (0,0,1) node[below right]{$z$}; % short
  \draw[axis,-] (0,0,\zmin) -- (0,0,0); % long
  \fill[CMScol] (O) circle(0.5pt) node[right=1,below=1] {IP};
  \draw[axis] (0,0,0.020) -- (0,0,\zmax) node[right=3,below=1]{$z$}; % long
  \draw[axis] (0,0.019,0) -- (0,\ymax,0) node[below left]{$y$};
  \draw[dashed,myred] (O'')  -- (Pxy);
  \draw[axis] (0.022,0,0) -- (\xmax,0,0) node[below=1,right=-2]{$x$};
  
  % LABELS
  \node[mydarkred,above] at (0,\ymax,0) {$\eta=0$};
  \node[mydarkred,above=3] at (0,\R,0.3*\L) {$\eta>0$};
  \node[mydarkred,above=3] at (0,\R,-0.2*\L) {$\eta<0$};
  \node[mydarkred,below=1,left] at (0,0,\zmax) {$\eta=+\infty$};
  \node[mydarkred,above=1,right] at (0,0,\zmin) {$\eta=-\infty$};
  
  % VECTORS
  %\fill[radius=0.4,red] (P) circle;
  %\draw[dashed,myred] (P)  -- (Pxy);
  %\draw[dashed,myred] (Py) -- (Pxy);
  \draw[dashed,myred] (Px) -- (Pxy);
  \draw[->,red,line cap=round] (O'') -- (Pxy) node[anchor=170,inner sep=2pt] {$\vv{p}_\mathrm{T}$};
  \draw[dashed,myred,line join=round] (Py) -- (Pxy) -- (P);
  \draw[->,red,line cap=round] (O') -- (P); %node[anchor=-30] {$\vv{p}$};
  
  % CYLINDER front
  \draw[beam pipe,fill=none] (0,\r,-\l/2) arc(90:-90:\r);
  \fill[detector surface] % transverse plane at z=L/2
    (0,\rt,\L/2) --++ (0,\R-\rt,0) arc(90:-90:\R) --++ (0,\R-\rt,0) arc(-90:90:\rt);
  \fill[detector surface] % transverse plane at z=-L/2
    (0,\rt,-\L/2) --++ (0,\R-\rt,0) arc(90:-90:\R) --++ (0,\R-\rt,0) arc(-90:90:\rt);
  \tdplotdrawarc[detector]{(0,0,\L/2)}{\R}{-90}{90}{}{} % transverse plane at z=L/2
  \tdplotdrawarc[detector]{(0,0,-\L/2)}{\R}{-90}{90}{}{} % transverse plane at z=-L/2
  \draw[beam pipe,fill=none] (0,\r,\l/2) arc(90:-90:\r);
  \draw[detector,very thin] % transverse plane at z=0
    (90-\ang:\R) arc (90-\ang:-90:\R);
  \node[red,anchor=-30,inner sep=2pt] at (P) {$\vv{p}$};
  \draw[dashed,myred] (Pz) -- (P);
  
  % ANGLES
  \tdplotdrawarc[thick,mycontourred] % contour
    {(O)}{0.2}{4}{0.7*\phivec}{}{}
  \tdplotdrawarc[draw=none,opacity=0.9]{(O)}{0.2}{0}{\phivec} % transparant contour
    {anchor=-150,inner sep=1pt}{\contour{mycontourred}{$\phi$}}
  \tdplotdrawarc[->]{(O)}{0.2}{0}{\phivec}
    {anchor=-150,inner sep=1pt}{$\phi$}
  \tdplotdrawarc[->,rotate around z=\phivec-90,rotate around y=-90]
    {(O)}{0.88}{0}{\thetavec}
    {anchor=-20,inner sep=2pt}{$\theta$}
  \tdplotdrawarc[thick,red!58!black!4,rotate around z=\phivec-90,rotate around y=-90] % contour
    {(O)}{0.3}{88}{0.5*(90+\thetavec)}{}{}
  \tdplotdrawarc[-{>[flex'=1]},rotate around z=\phivec-90,rotate around y=-90,line cap=round]
    {(O)}{0.3}{90}{\thetavec}
    {anchor=-40,inner sep=1pt}{$\eta$}
  \draw[mydarkred] (0,0,\L/2) --++ (\R,0,0);
  \tdplotdrawarc[thick,mycontourred2] % contour
    {(Z)}{0.2}{4}{0.7*\phivec}{}{}
  \tdplotdrawarc[draw=none,opacity=0.9]{(Z)}{0.2}{0}{\phivec} % transparant contour
    {anchor=-150,inner sep=1pt}{\contour{mycontourred2}{$\phi$}}
  \tdplotdrawarc[->]{(Z)}{0.2}{0}{\phivec}
    {anchor=-150,inner sep=1pt}{$\phi$}
  
  % COMPASS - CMS-ATLAS axis has a ~12° declination (http://googlecompass.com)
  \begin{scope}[shift={(1.1*\R,-\R,0.2*\L)},rotate around y=12]
    \draw[<->,black!50] (-\w,0,0) -- (\w,0,0);
    \draw[<->,black!50] (0,0,-\w) -- (0,0,\w);
    \node[above=1,left,black!50,scale=0.6] at (-\w,0,0) {N};
    \node[below=3,left=-2,green!20!black!50,scale=0.6] at (0,0,\w) {Jura};
    %\node[below=1,right,black!50,scale=0.6,align=center] at (\w,0,0) {center of\\the LHC};
    \node[below=1,right,blue!30!black!50,scale=0.6] at (\w,0,0) {ATLAS};
  \end{scope}
  \draw[->,thick,orange!30!black] (1.4*\w,-\R,-0.1*\L) --++ (2*\w,0,0)
    node[below=1,right,scale=0.8,align=center] {center of\\[-1pt]the LHC};

\end{tikzpicture}


% CMS detector - east perspective
\tdplotsetmaincoords{70}{125} % to reset previous setting
\begin{tikzpicture}[scale=2.8,tdplot_main_coords,rotate around x=90]
  
  % VARIABLES
  \def\rvec{\L/2/cos(\thetavec)}
  \def\thetavec{17}
  \def\phivec{60}
  \def\L{3.1}     % detector length
  \def\R{0.75}    % detector cylinder radius
  \def\l{4.1}     % beam pipe length
  \def\r{0.04}    % beam pipe radius
  \def\rt{0.042}  % beam pipe radius + line thickness
  \def\xmax{1}    % maximum x axis
  \def\ymax{1.05} % maximum y axis
  \def\zmin{-\l/2-0.2} % minimum z axis
  \def\zmax{\l/2+0.3}  % maximum z axis
  \def\w{0.3}
  \coordinate (O) at (0,0,0);
  \coordinate (Z) at (0,0,\L/2);
  \tdplotsetcoord{O'}{0.8*\rvec}{\thetavec}{\phivec} % shifted origin
  \tdplotsetcoord{O''}{0.018}{90}{\phivec} % shifted origin
  \tdplotsetcoord{P}{\rvec}{\thetavec}{\phivec}
  
  % CYLINDER behind
  \def\ang{24} % rotate lines to simulate cylinder
  \fill[top color=red!50!black!4,bottom color=red!60!black!2,rotate around z=\ang]
    (0,\R,\L/2) --++ (0,0,-\L) arc(90:270:\R) --++ (0,0,\L) arc(270:90:\R) -- cycle;
  \fill[detector surface] % transverse plane at z=L/2
    (0,0,\L/2) --++ (0,\R,0) arc(90:270:\R) -- cycle;
  \fill[detector surface] % transverse plane at z=-L/2
    (0,0,-\L/2) --++ (0,\R,0) arc(90:270:\R) -- cycle;
  \tdplotdrawarc[detector,thin]{(0,0,\L/2)}{\R}{0}{360}{}{} % transverse plane at z=L/2
  \tdplotdrawarc[detector]{(0,0,-\L/2)}{\R}{0}{360}{}{} % transverse plane at z=-L/2
  \draw[detector,thin] % transverse plane at z=0
    (90:\R) arc (90:270:\R);
  %\fill[detector surface] % top piece
  %  (0,\R,\L/2) --++ (0,0,-\L) arc(90:90-\ang:\R) --++ (0,0,\L) arc(90-\ang:90:\R) -- cycle;
  \draw[detector,very thin] % transverse plane at z=0, top piece
    (90:\R) arc (90:90-\ang:\R);
  \draw[detector] (0,0,-\L/2)++(90:\R) --++ (0,0,\L); % top horizontal along z
  \draw[detector] (0,0,-\L/2)++(-90:\R) --++ (0,0,\L); % bottom horizontal along z
  
  % BEAM PIPE
  \tdplotdrawarc[beam pipe]{(0,0,-\l/2)}{\r}{0}{360}{}{}
  \draw[beam pipe] % beam pipe, thinner in middle
    (0,\r,-\l/2) -- (0,\r,-0.2*\l) -- (90:0.5*\r)
    -- (0,\r,0.2*\l) -- (0,\r,0.5*\l) arc(90:-90:\r)
    -- (0,-\r,0.2*\l) -- (-90:0.5*\r) --
    (0,-\r,-0.2*\l) -- (0,-\r,-\l/2) arc(-90:90:\r);
  \draw[beam pipe] (0,0,\l/2) circle(\r);
  
  % AXES
  \draw[axis] (0,0,0) -- (0,0,\zmax) node[right=3,below=2]{$z$}; % long
  \fill[CMScol] (O) circle(0.5pt) node[right=1,below=1] {IP};
  \draw[axis,-] (0,0,\zmin) -- (0,0,-0.020); % long
  \draw[axis] (0,0.019,0) -- (0,\ymax,0) node[below left]{$y$};
  \draw[axis] (0.022,0,0) -- (\xmax,0,0) node[below=1,left=-2]{$x$};
  \draw[red] (O) -- (O'); % behind circle
  
  % LABELS
  \node[mydarkred,above] at (0,\ymax,0) {$\eta=0$};
  \node[mydarkred,above=6] at (0,\R,0.23*\L) {$\eta>0$};
  \node[mydarkred,above=6] at (0,\R,-0.3*\L) {$\eta<0$};
  \node[mydarkred,above=1,left] at (0,0,\zmax) {$\eta=+\infty$};
  \node[mydarkred,below=1,right] at (0,0,\zmin) {$\eta=-\infty$};
  
  % CYLINDER front
  \draw[beam pipe,fill=none] (0,\r,-\l/2) arc(90:-90:\r);
  \fill[detector surface] % transverse plane at z=L/2
    (0,\rt,\L/2) --++ (0,\R-\rt,0) arc(90:-90:\R) --++ (0,\R-\rt,0) arc(-90:90:\rt);
  \fill[detector surface] % transverse plane at z=-L/2
    (0,\rt,-\L/2) --++ (0,\R-\rt,0) arc(90:-90:\R) --++ (0,\R-\rt,0) arc(-90:90:\rt);
  \tdplotdrawarc[detector]{(0,0,\L/2)}{\R}{-90}{90.1}{}{}
  \tdplotdrawarc[detector]{(0,0,-\L/2)}{\R}{-90}{90}{}{}
  \draw[beam pipe,fill=none] (0,\r,\l/2) arc(90:-90:\r);
  \draw[detector,very thin] % transverse plane at z=0
    (90-\ang:\R) arc (90-\ang:-90:\R);
  \draw[detector,very thin] % top piece
    (90-\ang:\R) arc (90-\ang:-90:\R);
  
  % VECTORS
  %\fill[radius=0.4,red] (P) circle;
  %\fill[radius=0.4,red] (P) circle;
  %\draw[dashed,myred] (P)  -- (Pxy);
  %\draw[dashed,myred] (Py) -- (Pxy);
  \draw[dashed,myred] (Pz) -- (P);
  \draw[->,red,line cap=round] (O'') -- (Pxy) node[anchor=-92] {$\vv{p}_\mathrm{T}$};
  \draw[dashed,myred,line join=round] (Py) -- (Pxy) -- (P);
  \draw[->,red] (O') -- (P) node[anchor=-50,inner sep=1pt] {$\vv{p}$};;
  
  % ANGLES
  \tdplotdrawarc[thick,mycontourred]{(O)}{0.2}{4}{0.7*\phivec}{}{} % contour
  \tdplotdrawarc[draw=none,opacity=0.9]{(O)}{0.2}{0}{\phivec} % transparant contour
    {below=4,left=-1,anchor=mid east}{\contour{mycontourred}{$\phi$}}
  \tdplotdrawarc[->]{(O)}{0.2}{0}{\phivec}
    {below=4,left=-1,anchor=mid east}{$\phi$}
  \tdplotdrawarc[->,rotate around z=\phivec-90,rotate around y=-90]
    {(O)}{1.05}{0}{\thetavec}{above=2,anchor=mid east}{$\theta$}
  \tdplotdrawarc[-{>[bend=1]},rotate around z=\phivec-90,rotate around y=-90,line cap=round]
    {(O)}{0.3}{90}{\thetavec}{above=4,right=2,anchor=mid east}{$\eta$}
  \draw[mydarkred,line cap=round] (0.004,0,\L/2) --++ (\R,0,0);
  \tdplotdrawarc[thick,mycontourred2]{(Z)}{0.2}{4}{0.7*\phivec}{}{} % contour
  \tdplotdrawarc[draw=none]{(Z)}{0.2}{0}{\phivec} % transparant contour
    {below=4,left=-1,anchor=mid east,opacity=0.9}{\contour{mycontourred2}{$\phi$}}
  \tdplotdrawarc[->]{(Z)}{0.2}{0}{\phivec}
    {below=4,left=-1,anchor=mid east}{$\phi$}
  
  % COMPASS - CMS-ATLAS axis has a ~12° declination (http://googlecompass.com)
  \begin{scope}[shift={(1.3*\R,-\R,0.45*\L)},rotate around y=12]
    \draw[<->,black!50] (-\w,0,0) -- (\w,0,0);
    \draw[<->,black!50] (0,0,-\w) -- (0,0,\w);
    \node[right=4,above,black!50,scale=0.6] at (-\w,0,0) {N};
    \node[above=1,left=-1,green!20!black!50,scale=0.6] at (0,0,\w) {Jura};
    \node[left=2,below=1,blue!30!black!50,scale=0.6] at (\w,0,0) {ATLAS};
  \end{scope}
  \draw[->,thick,orange!30!black] (1.4*\w,-\R,0.1*\L) --++ (2*\w,0,0)
    node[below=1,left,scale=0.8,align=center] {center of\\[-1pt]the LHC};

\end{tikzpicture}


\end{document}

Click to download: axis3D_CMS.texaxis3D_CMS.pdf
Open in Overleaf: axis3D_CMS.tex.

Leave a Reply

Your email address will not be published.