")


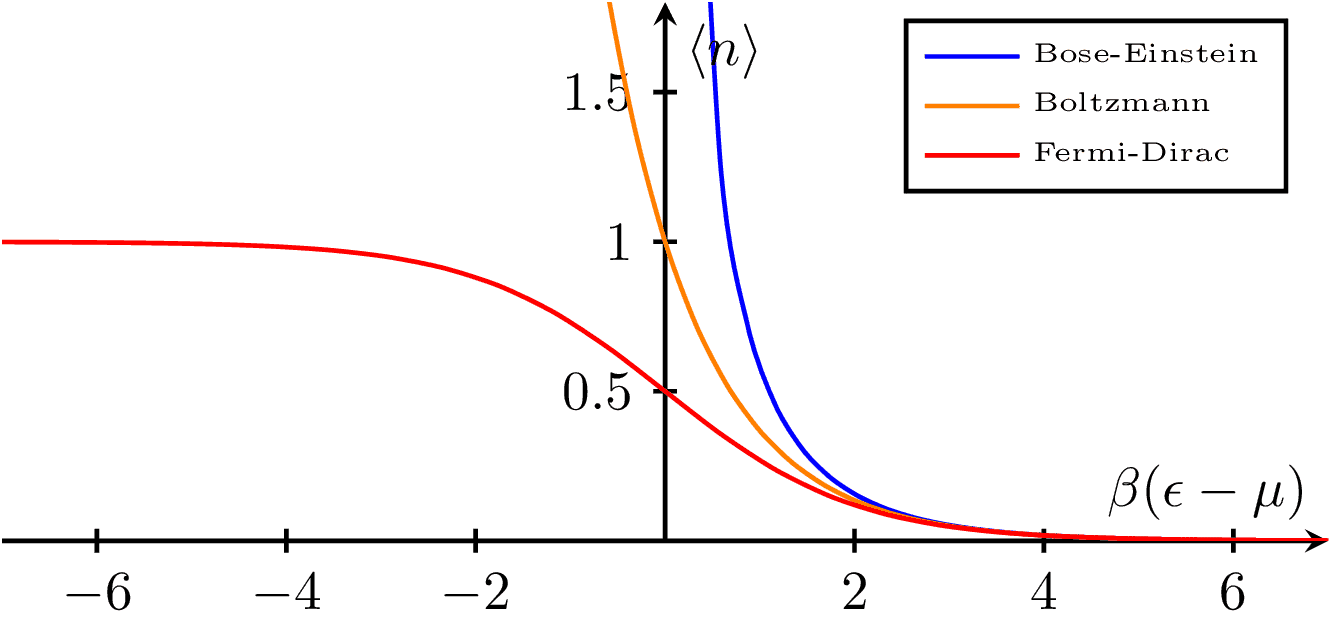
Comparing Bose-Einstein, Boltzmann and Fermi-Dirac distributions.
Edit and compile if you like:
\documentclass{standalone}

\usepackage{pgfplots}
\pgfplotsset{compat=newest}

\begin{document}
\begin{tikzpicture}
  \begin{axis}[
      xlabel = $\beta (\epsilon - \mu)$,
      ylabel = $\langle n\rangle$,
      ymin = 0,ymax = 1.8,
      smooth,thick,
      axis lines = center,
      every tick/.style = {thick},
      legend cell align=left,
      legend style={legend pos=north east,font=\tiny},
      width=10cm,height=5cm]

    \def\xmax{7}
    \addplot[color=blue,domain=0:\xmax]{1/(e^x - 1)};
    \addplot[color=orange,domain=-1:\xmax]{1/e^x};
    \addplot[color=red,domain = -\xmax:\xmax]{1/(e^x + 1)};

    \legend{Bose-Einstein,Boltzmann,Fermi-Dirac}

  \end{axis}
\end{tikzpicture}
\end{document}
Click to download: distributions.tex
Open in Overleaf: distributions.tex
This file is available on tikz.netlify.app and on GitHub and is MIT licensed.
See more on the author page of Janosh Riebesell..


