")


Edit and compile if you like:
% Author: Izaak Neutelings (June 2020)
% Inspiration: https://tex.stackexchange.com/questions/285578/how-to-draw-parallelepiped-and-cube-with-latex/288101#288101
\documentclass[border=3pt,tikz]{standalone}
\usepackage{amsmath}
\usepackage{siunitx}
\usepackage{physics}
\tikzset{>=latex} % for LaTeX arrow head
\colorlet{myblue}{blue!70!black}
\colorlet{mydarkblue}{blue!40!black}
\colorlet{mygreen}{green!60!black}
\colorlet{myred}{red!65!black}
\colorlet{mypurple}{red!50!blue!95!black!75}
\tikzstyle{wave}=[myblue,thick]
\tikzstyle{xline}=[very thick,myblue]
\tikzstyle{vline}=[very thick,mygreen]
\tikzstyle{aline}=[very thick,mypurple]
\tikzstyle{mydashed}=[mydarkblue,dashed]
\def\tick#1#2{\draw[thick] (#1) ++ (#2:0.1) --++ (#2-180:0.2)}
\def\tlabel{$t\,\left[\si{s}\right]$}
\def\vlabel{$v\,\left[\si{m/s}\right]$}
\def\alabel{$a\,\left[\si{m/s^2}\right]$}
\begin{document}
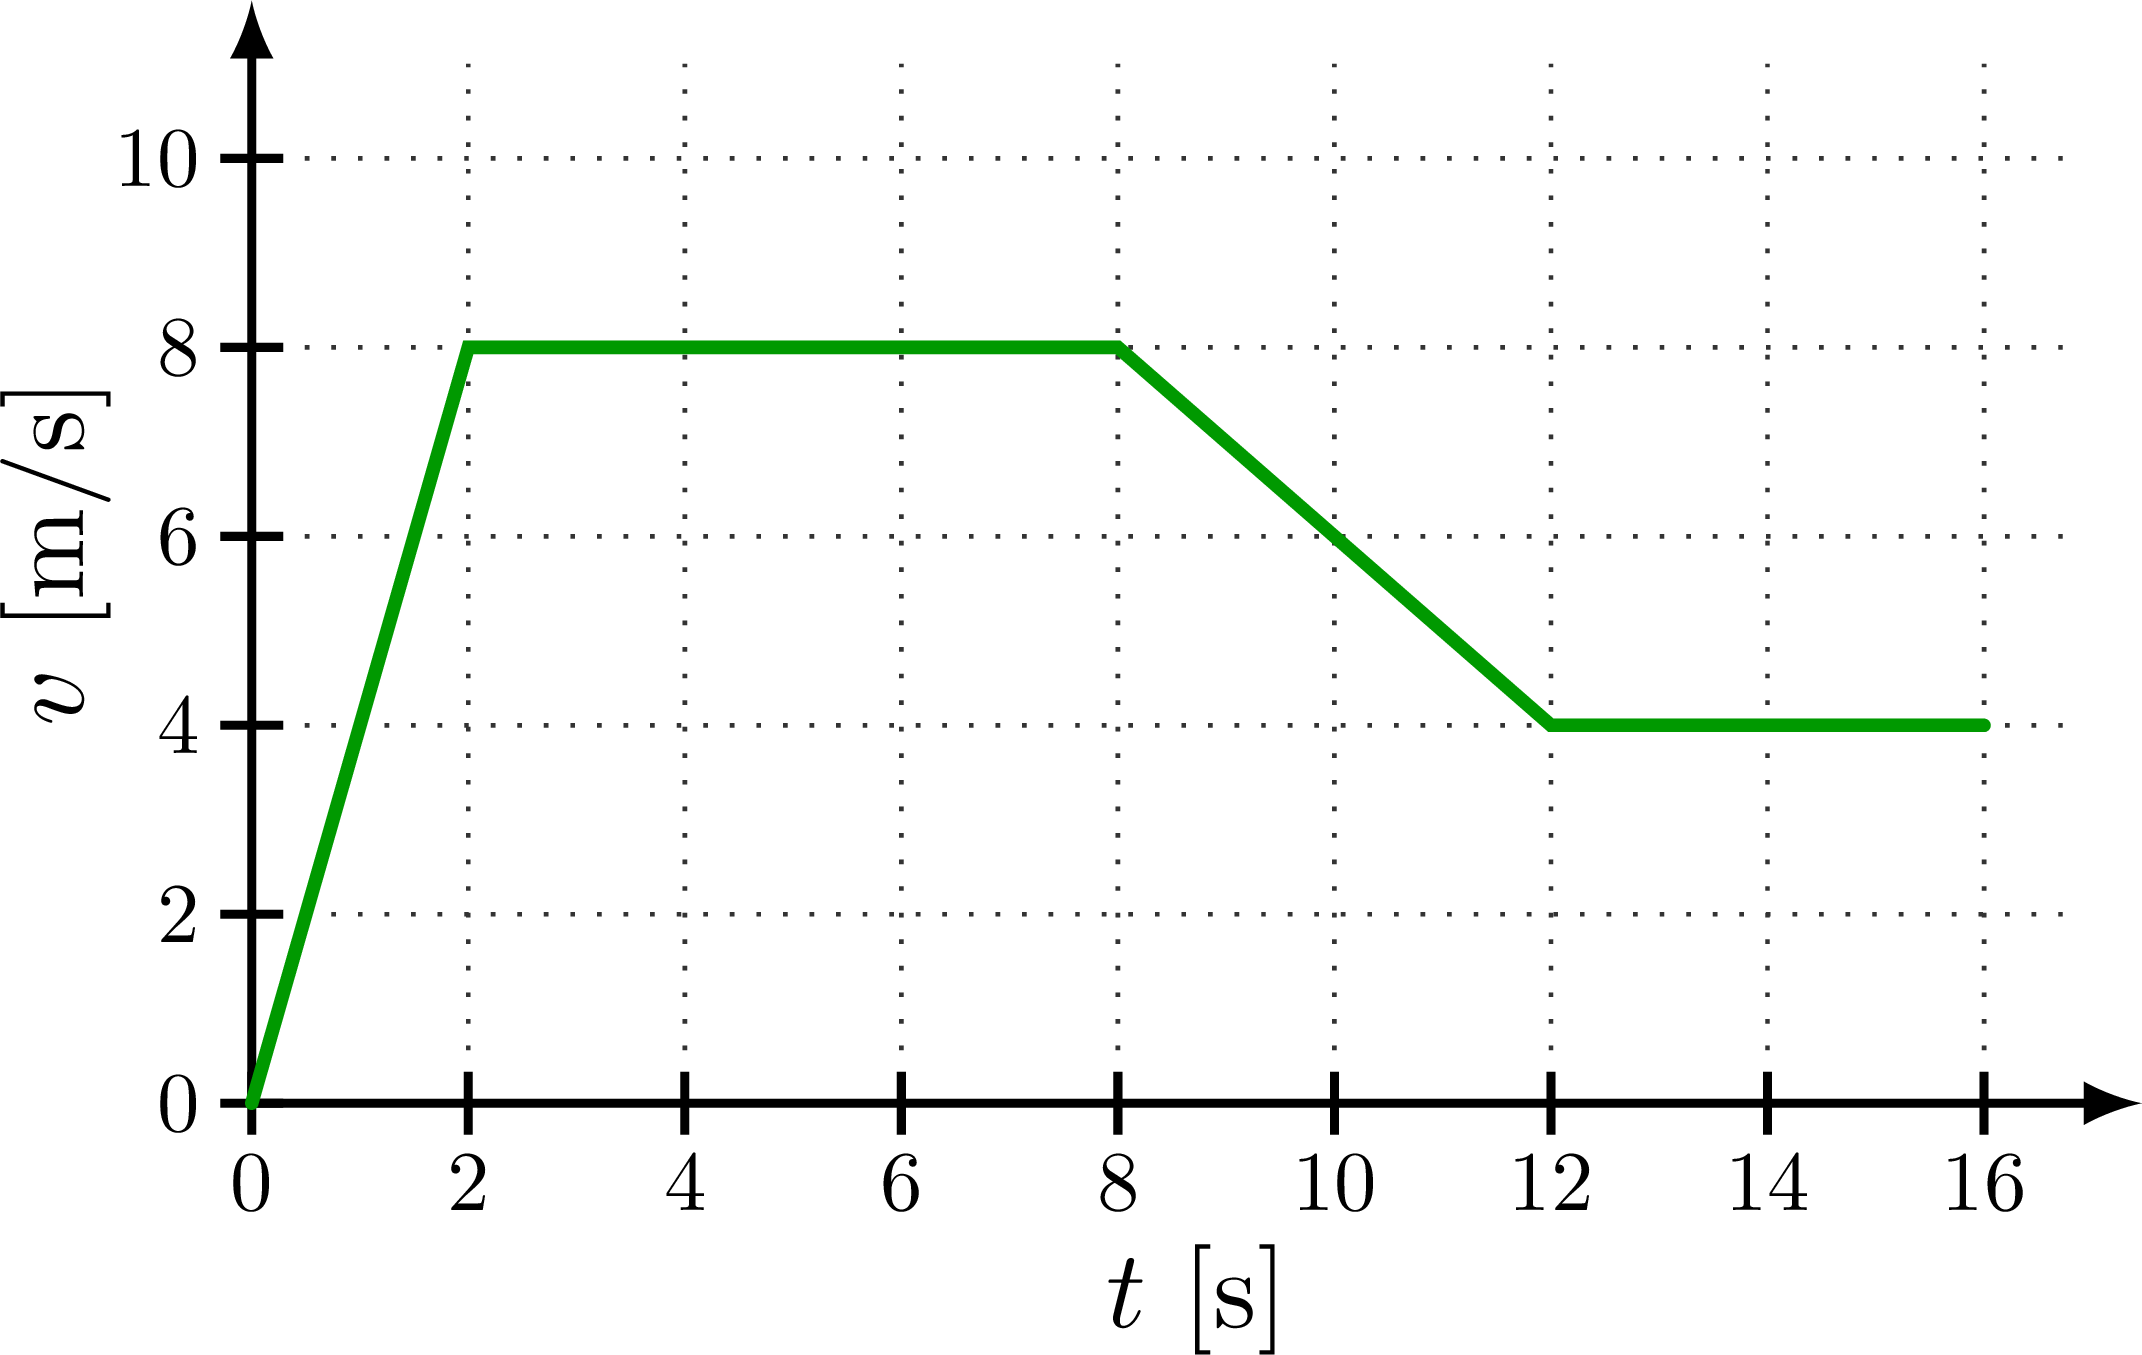
% VELOCITY
\def\xmax{5.5} % maximum x axis (time)
\def\ymax{3.0} % maximum y axis (velocity)
\def\tmax{16} % maximum time on x axis
\begin{tikzpicture}
\def\vmax{10} % maximum velocity on x axis
\def\xscale{\xmax/\tmax}
\def\yscale{\ymax/\vmax}
% GRID
\foreach \t in {0,2,...,\tmax}{
\draw[black!80,dotted] (\t*\xscale,0) --++ (0,\vmax*\yscale+0.3);
\tick{\t*\xscale,0}{90} node[below=-1,scale=0.77] {\t};
}
\foreach \v in {0,2,...,\vmax}{
\draw[black!80,dotted] (0,\v*\yscale) --++ (\tmax*\xscale+0.3,0);
\tick{0,\v*\yscale}{0} node[left=-1,scale=0.77] {\v};
}
% AXES
\draw[->,thick]
(0,0) -- (\xmax+0.5,0) node[midway,below=9] {\tlabel};
\draw[->,thick]
(0,0) -- (0,\ymax+0.5) node[midway,rotate=90,above=9] {\vlabel};
% GRAPH
\draw[vline,line cap=round,xscale=\xscale,yscale=\yscale]
(0,0) -- (2,8) -- (8,8) -- (12,4) -- (16,4);
\end{tikzpicture}
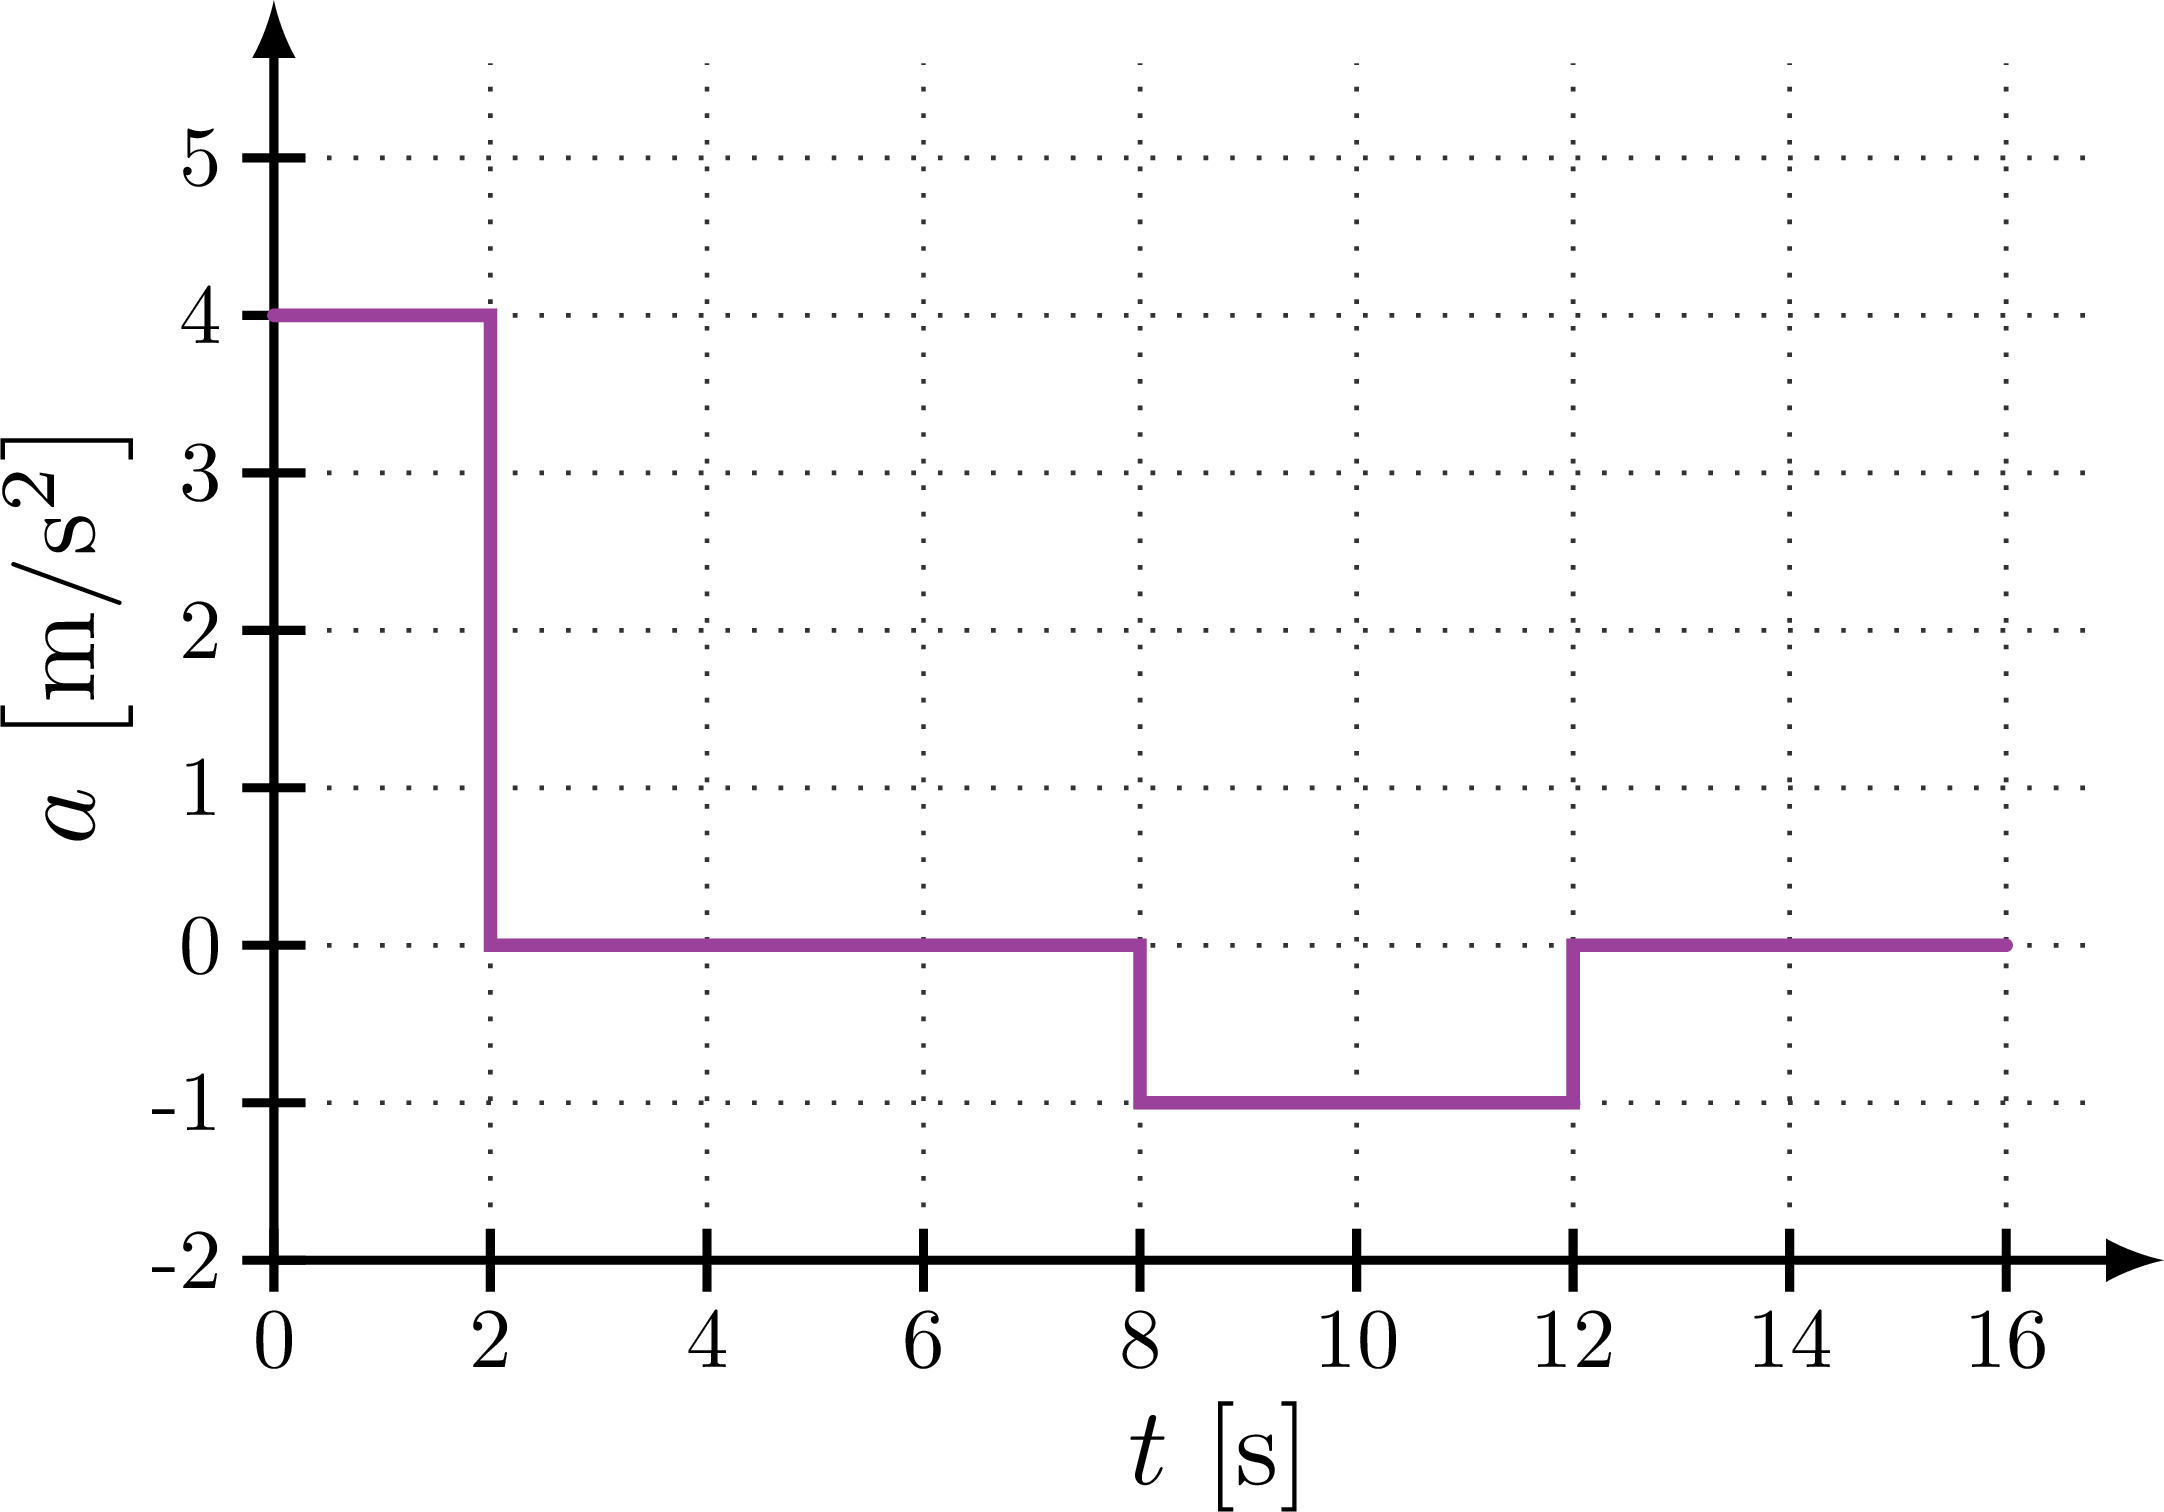
% ACCELERATION
\begin{tikzpicture}
\def\ymax{2.5} % maximum y axis (velocity)
\def\ymin{-2*\yscale}
\def\amax{5} % maximum velocity on x axis
\def\xscale{\xmax/\tmax}
\def\yscale{\ymax/\amax}
% GRID
\foreach \t in {0,2,...,\tmax}{
\draw[black!80,dotted] (\t*\xscale,\ymin) -- (\t*\xscale,\amax*\yscale+0.3);
\tick{\t*\xscale,\ymin}{90} node[below=-1,scale=0.77] {\t};
}
\foreach \a in {-2,-1,0,...,\amax}{
\draw[black!80,dotted] (0,\a*\yscale) --++ (\tmax*\xscale+0.3,0);
\tick{0,\a*\yscale}{0} node[left=-1,scale=0.77] {\a};
}
% AXES
\draw[->,thick]
(0,\ymin) --++ (\xmax+0.5,0) node[midway,below=9] {\tlabel};
\draw[->,thick]
(0,\ymin) -- (0,\ymax+0.5) node[midway,rotate=90,above=9] {\alabel};
% GRAPH
\draw[aline,line cap=round,xscale=\xscale,yscale=\yscale]
(0,4) -- (2,4) -- (2,0) -- (8,0) -- (8,-1) -- (12,-1) -- (12,0) -- (16,0);
\end{tikzpicture}
\end{document}Click to download: kinematics_graph.tex • kinematics_graph.pdf
Open in Overleaf: kinematics_graph.tex