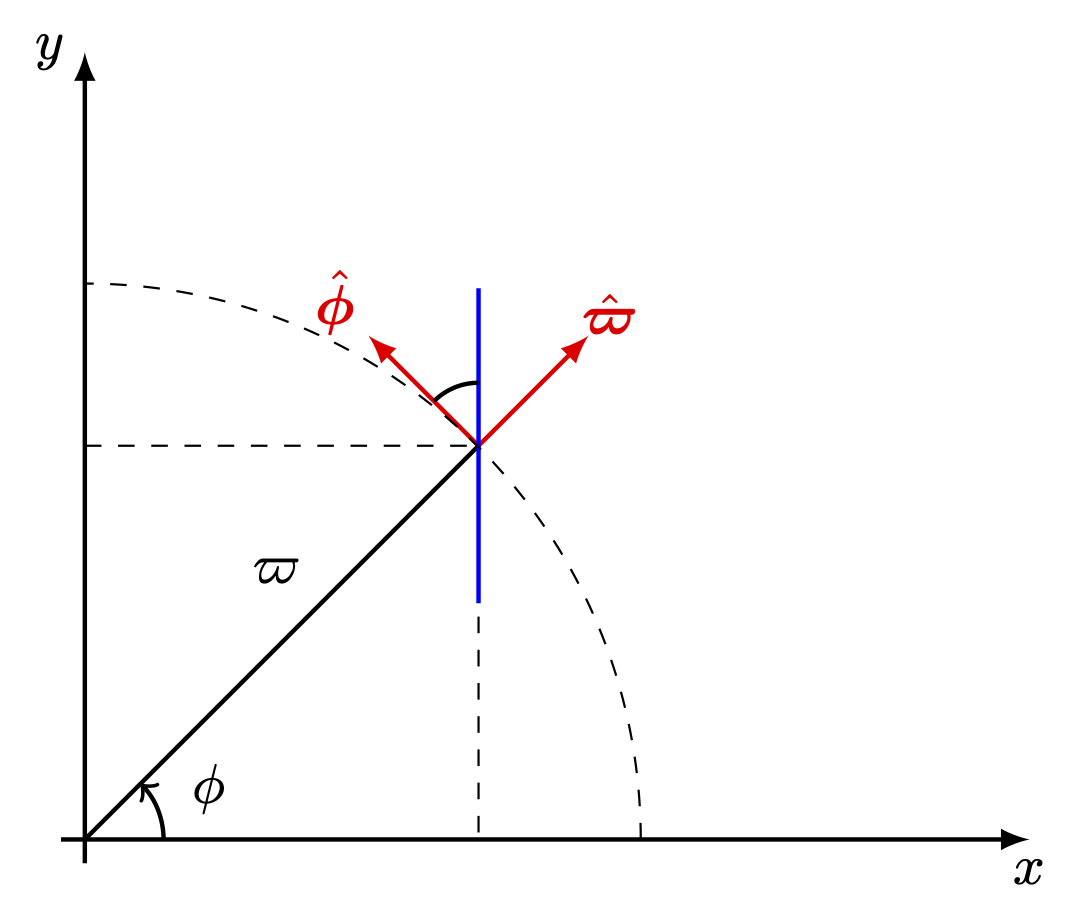
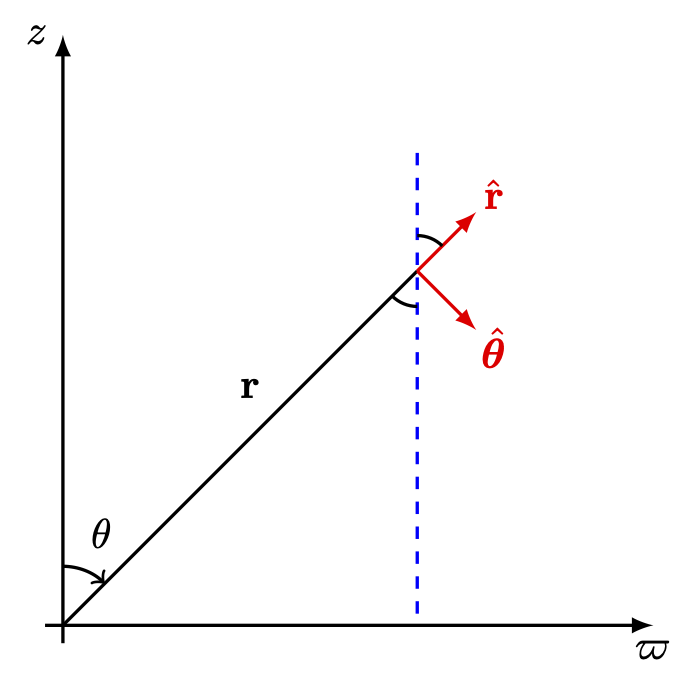
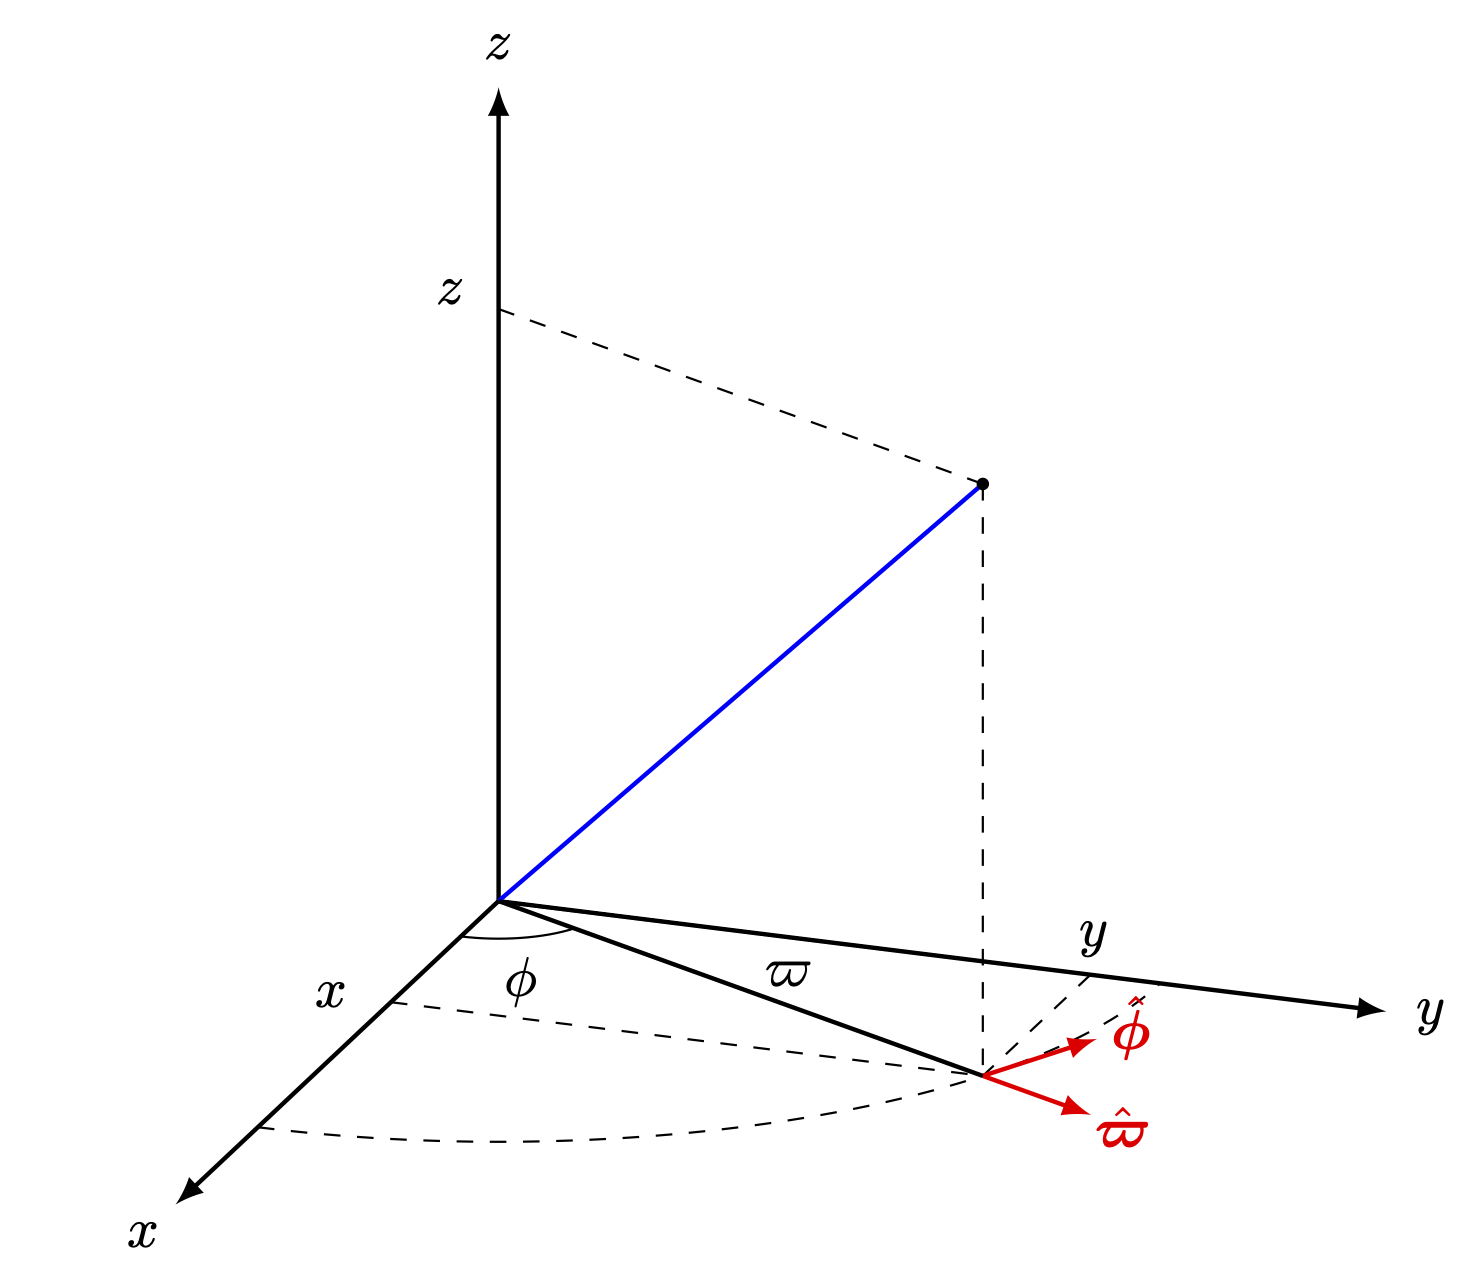
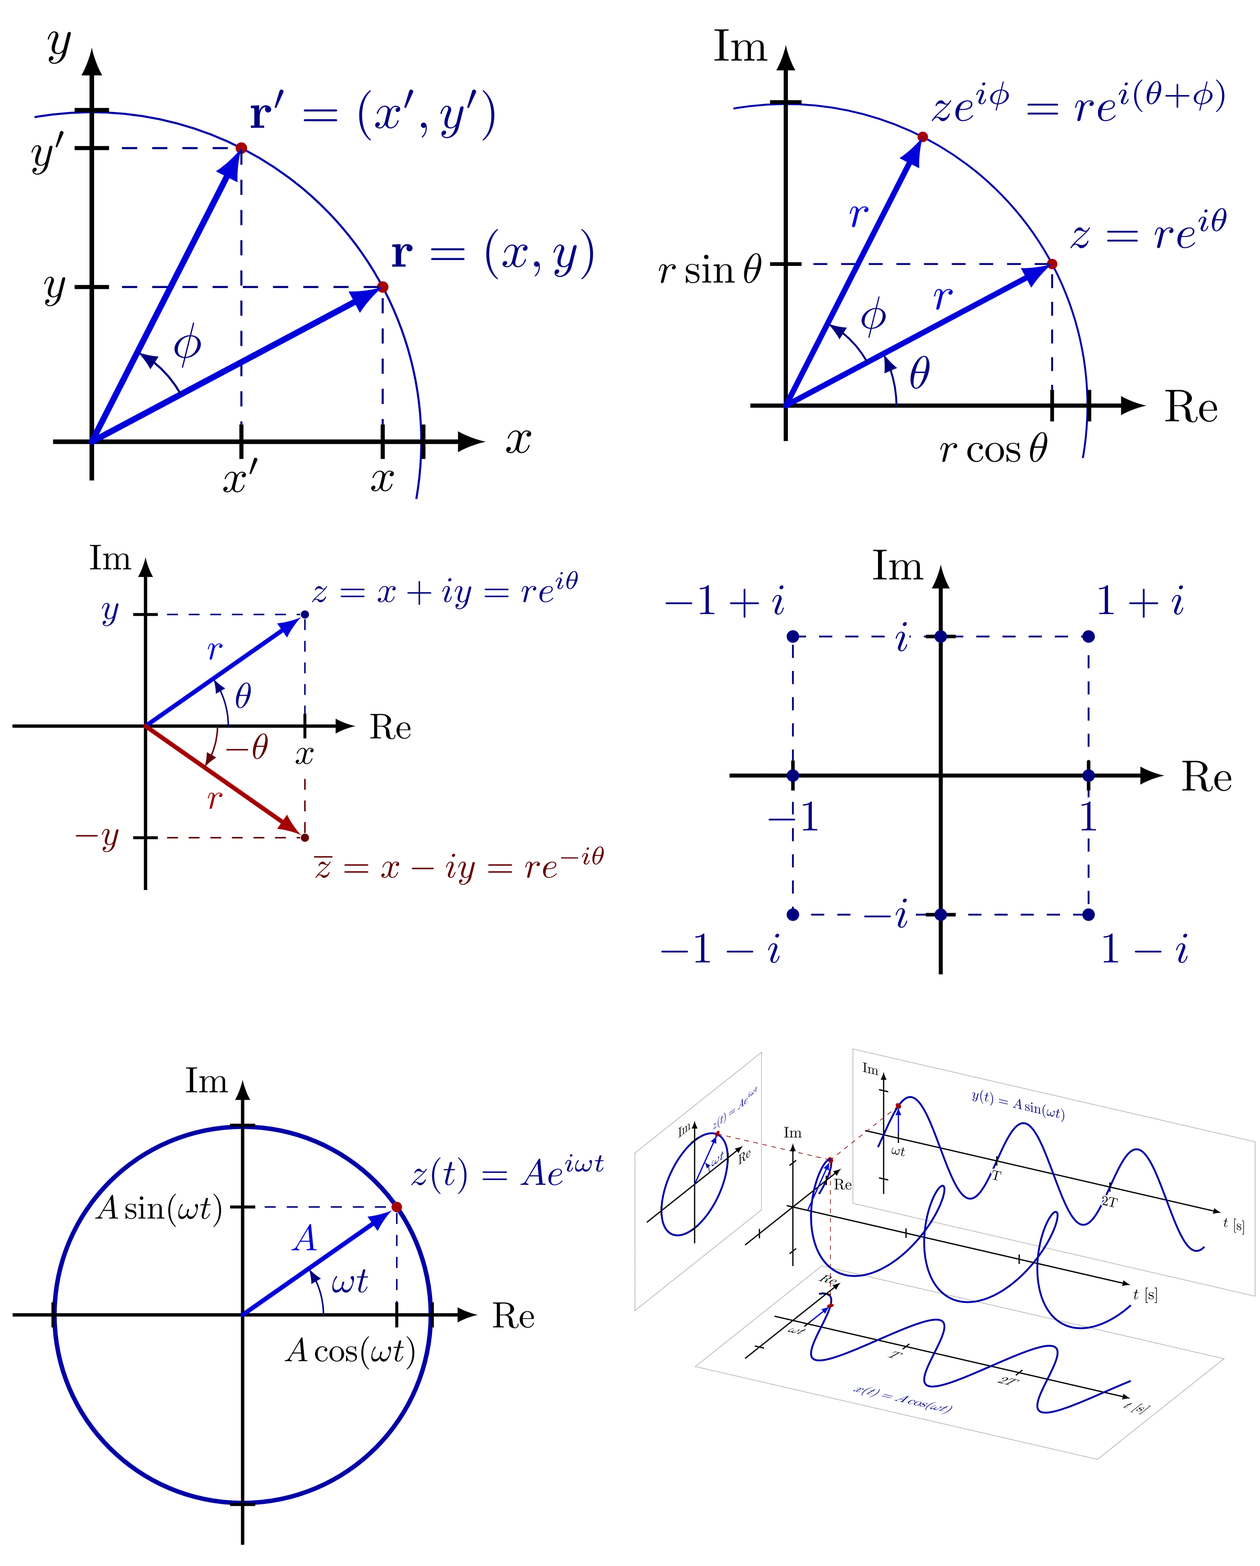
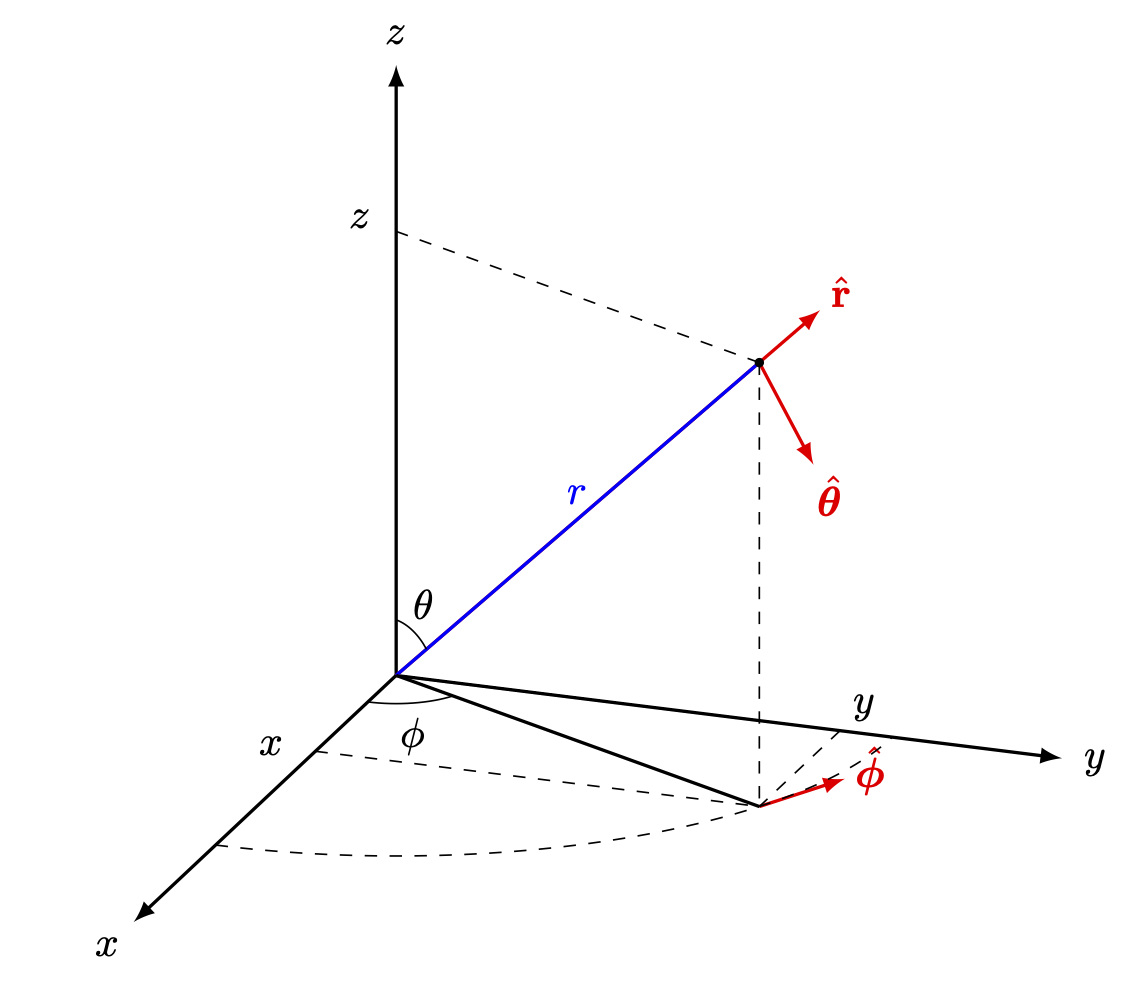
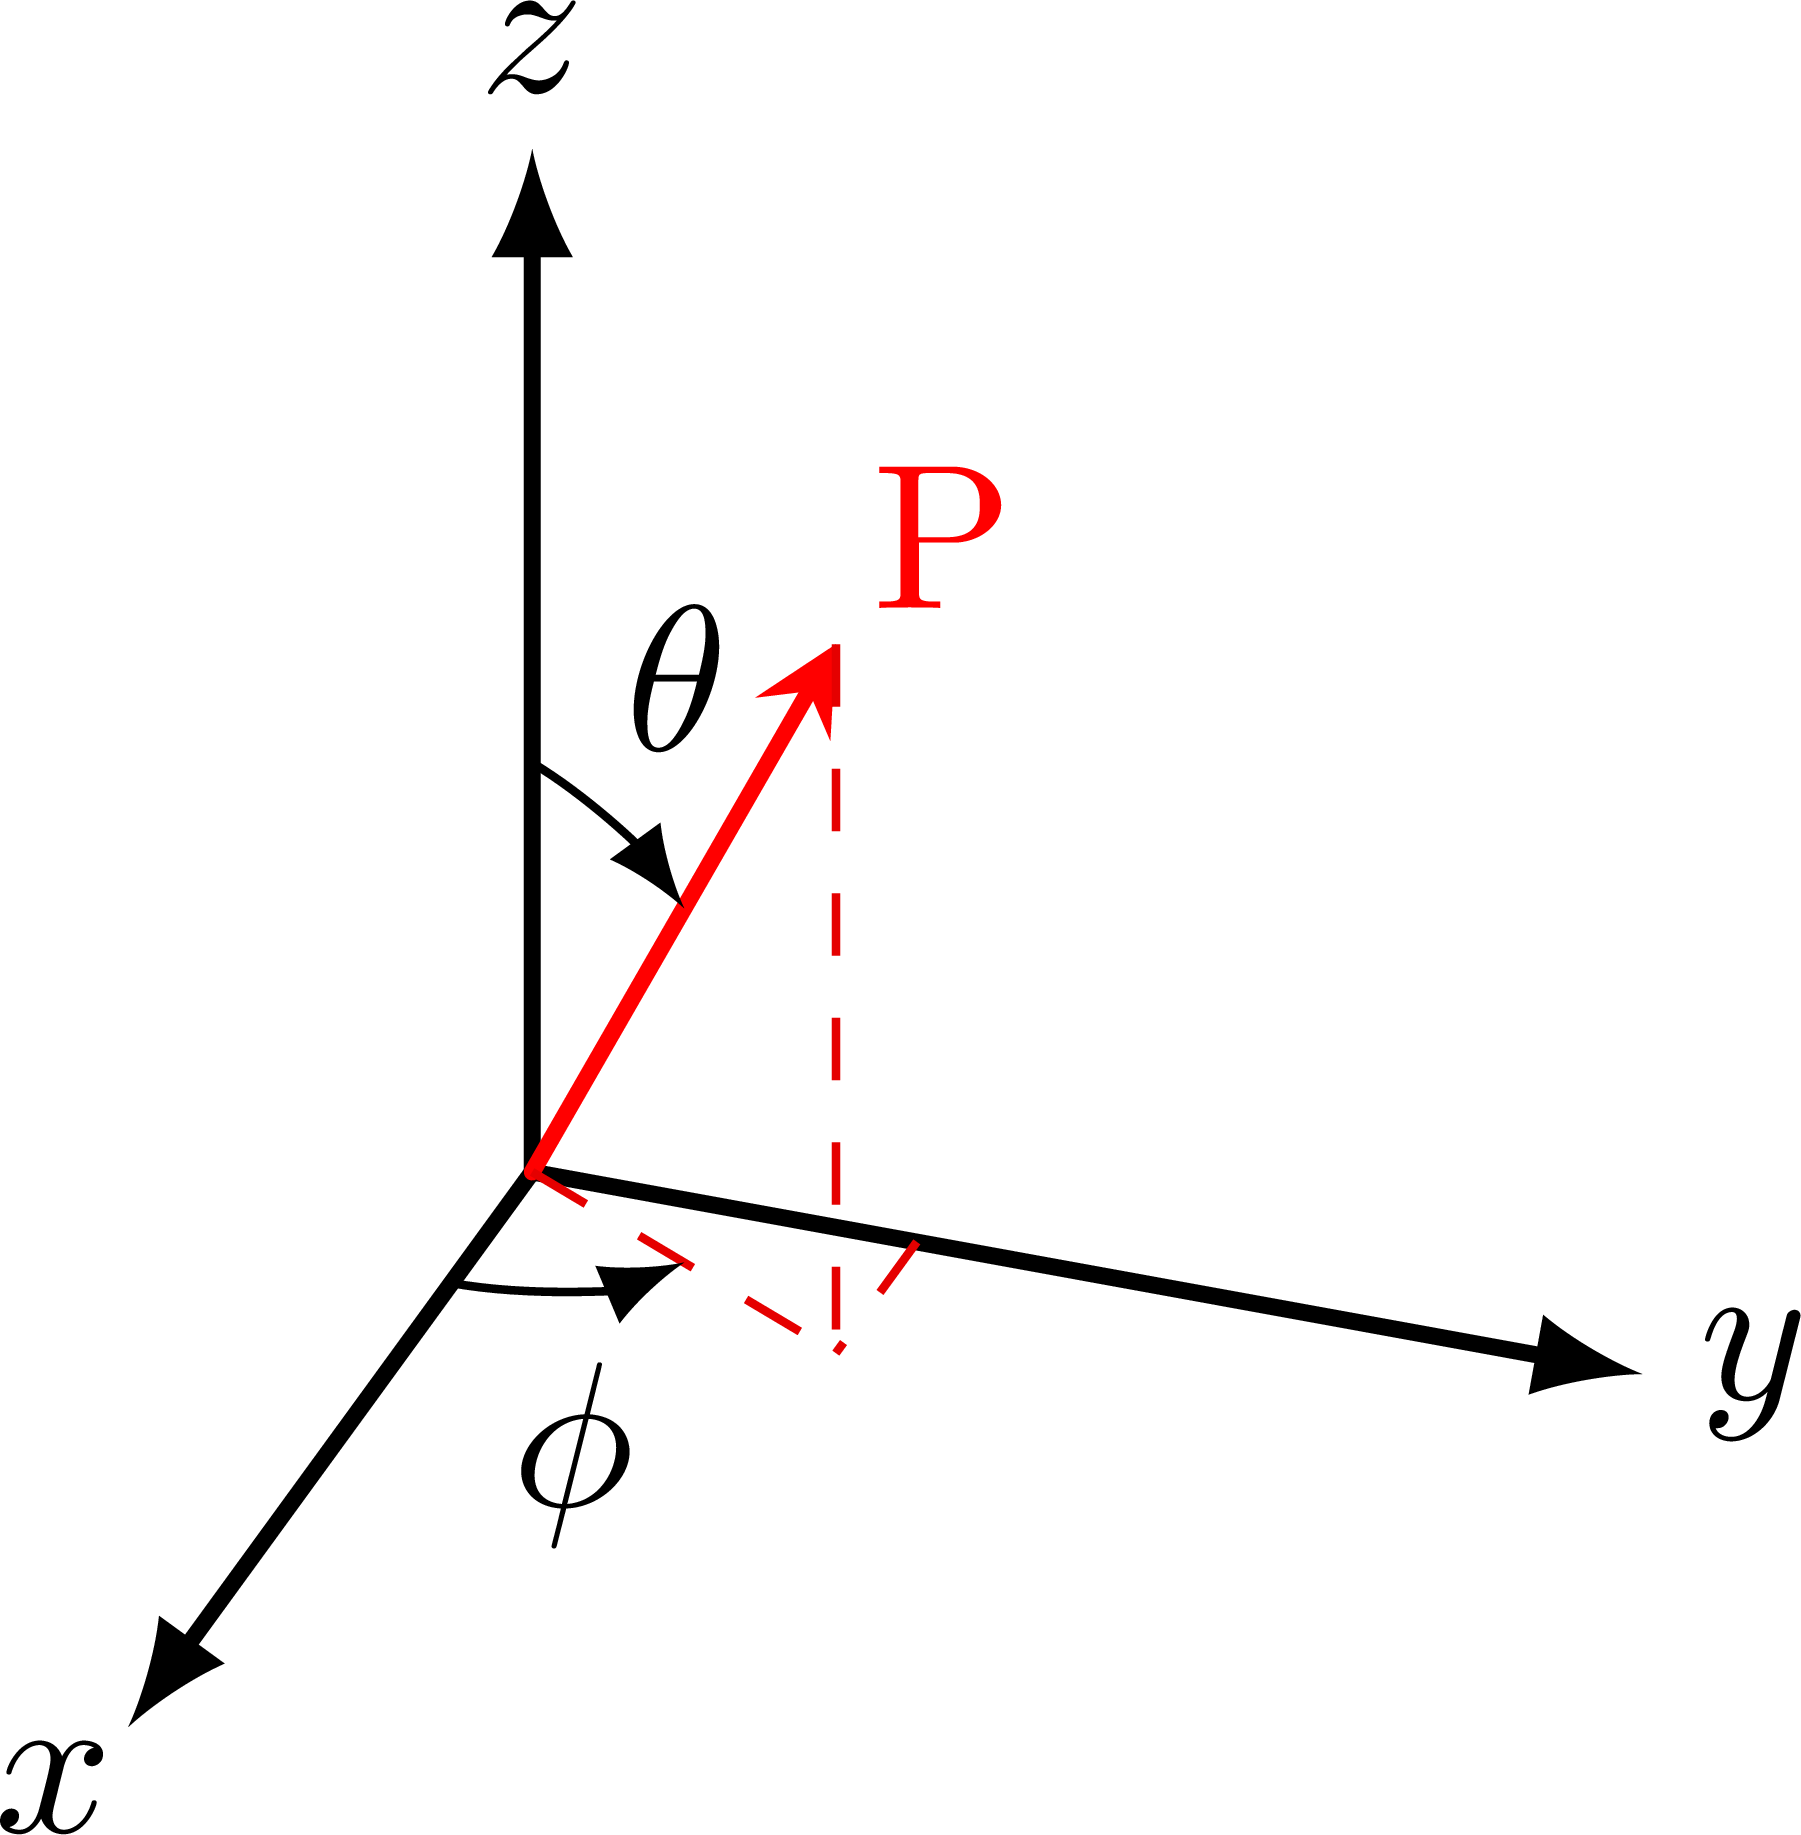
For more figures related to the definition of coordinate systems, please have a look at the “coordinates” tag.
Edit and compile if you like:
\documentclass[border=3pt]{standalone}

%Drawing
\usepackage{tikz}

%Tikz Library
\usetikzlibrary{angles, quotes, intersections}

%Notation
\usepackage{physics}
\usepackage{bm}

\begin{document}

	\begin{tikzpicture}
%		%Grid
%		\draw[thin, dotted] (0,0) grid (8,8);
%		\foreach \i in {1,...,8}
%		{
%			\node at (\i,-2ex) {\i};
%		}
%		\foreach \i in {1,...,8}
%		{
%			\node at (-2ex,\i) {\i};
%		}
%		\node at (-2ex,-2ex) {0};

		%Coordinates
		\coordinate (A) at (6,0);
		\coordinate (B) at (0,0);
		\coordinate (C) at (2.5,2.5);
		\coordinate (B') at (2.5,3.5);
		\coordinate (A') at (1.8,3.2);

		%Axis
		\draw[thick,-latex] (-1ex,0) -- (6,0) node [below] {$x$};
		\draw[thick,-latex] (0,-1ex) -- (0,5) node [left] {$y$};

		%Vectors
		\draw[thick] (0,0) -- (2.5,2.5) node[pos=0.6, above left] {$\varpi$};
		\draw[thick, red, -latex] (2.5,2.5) -- (3.2,3.2) node[pos=1.2] {$\vu*{\varpi}$};
		\draw[thick, red, -latex] (2.5,2.5) -- (1.8,3.2) node[pos=1.3] {$\vu*{\phi}$};

		%Help Lines
		\draw[dashed] (0,2.5) -- (2.5,2.5) -- (2.5,0);
		\draw[blue, thick] (2.5,3.5) -- (2.5,1.5);
		\draw[dashed] (3.53,0) arc (0:90:3.53);

		%Angle
		\pic[draw, ->, thick, "$\phi$", angle eccentricity=1.7] {angle = A--B--C};
		\pic[draw, thick, angle radius=4mm, angle eccentricity=1.7] {angle = B'--C--A'};

	\end{tikzpicture}

\end{document}
Click to download: polar_1.tex
Open in Overleaf: polar_1.tex
This file is available on GitHub.
See more on the author page of Alexandros Tsagkaropolulos.


