")


Standard Model particles plotted as mass versus lifetime to show its stability in the context of high-energy physics detectors such as the CMS detector.
Note the average decay length is given by L = γβcτ = (pc/mc2)(cτ), because β = v/c and the average distance traveled by a particle is L = v(γτ), where the lifetime is dilated due to a boost with a Lorentz factor γ = 1/sqrt(1-β2). We can write γβ = pc/mc2, because the relativistic momentum is given by p = γmv.
Mass versus proper lifetime, including the electron mass: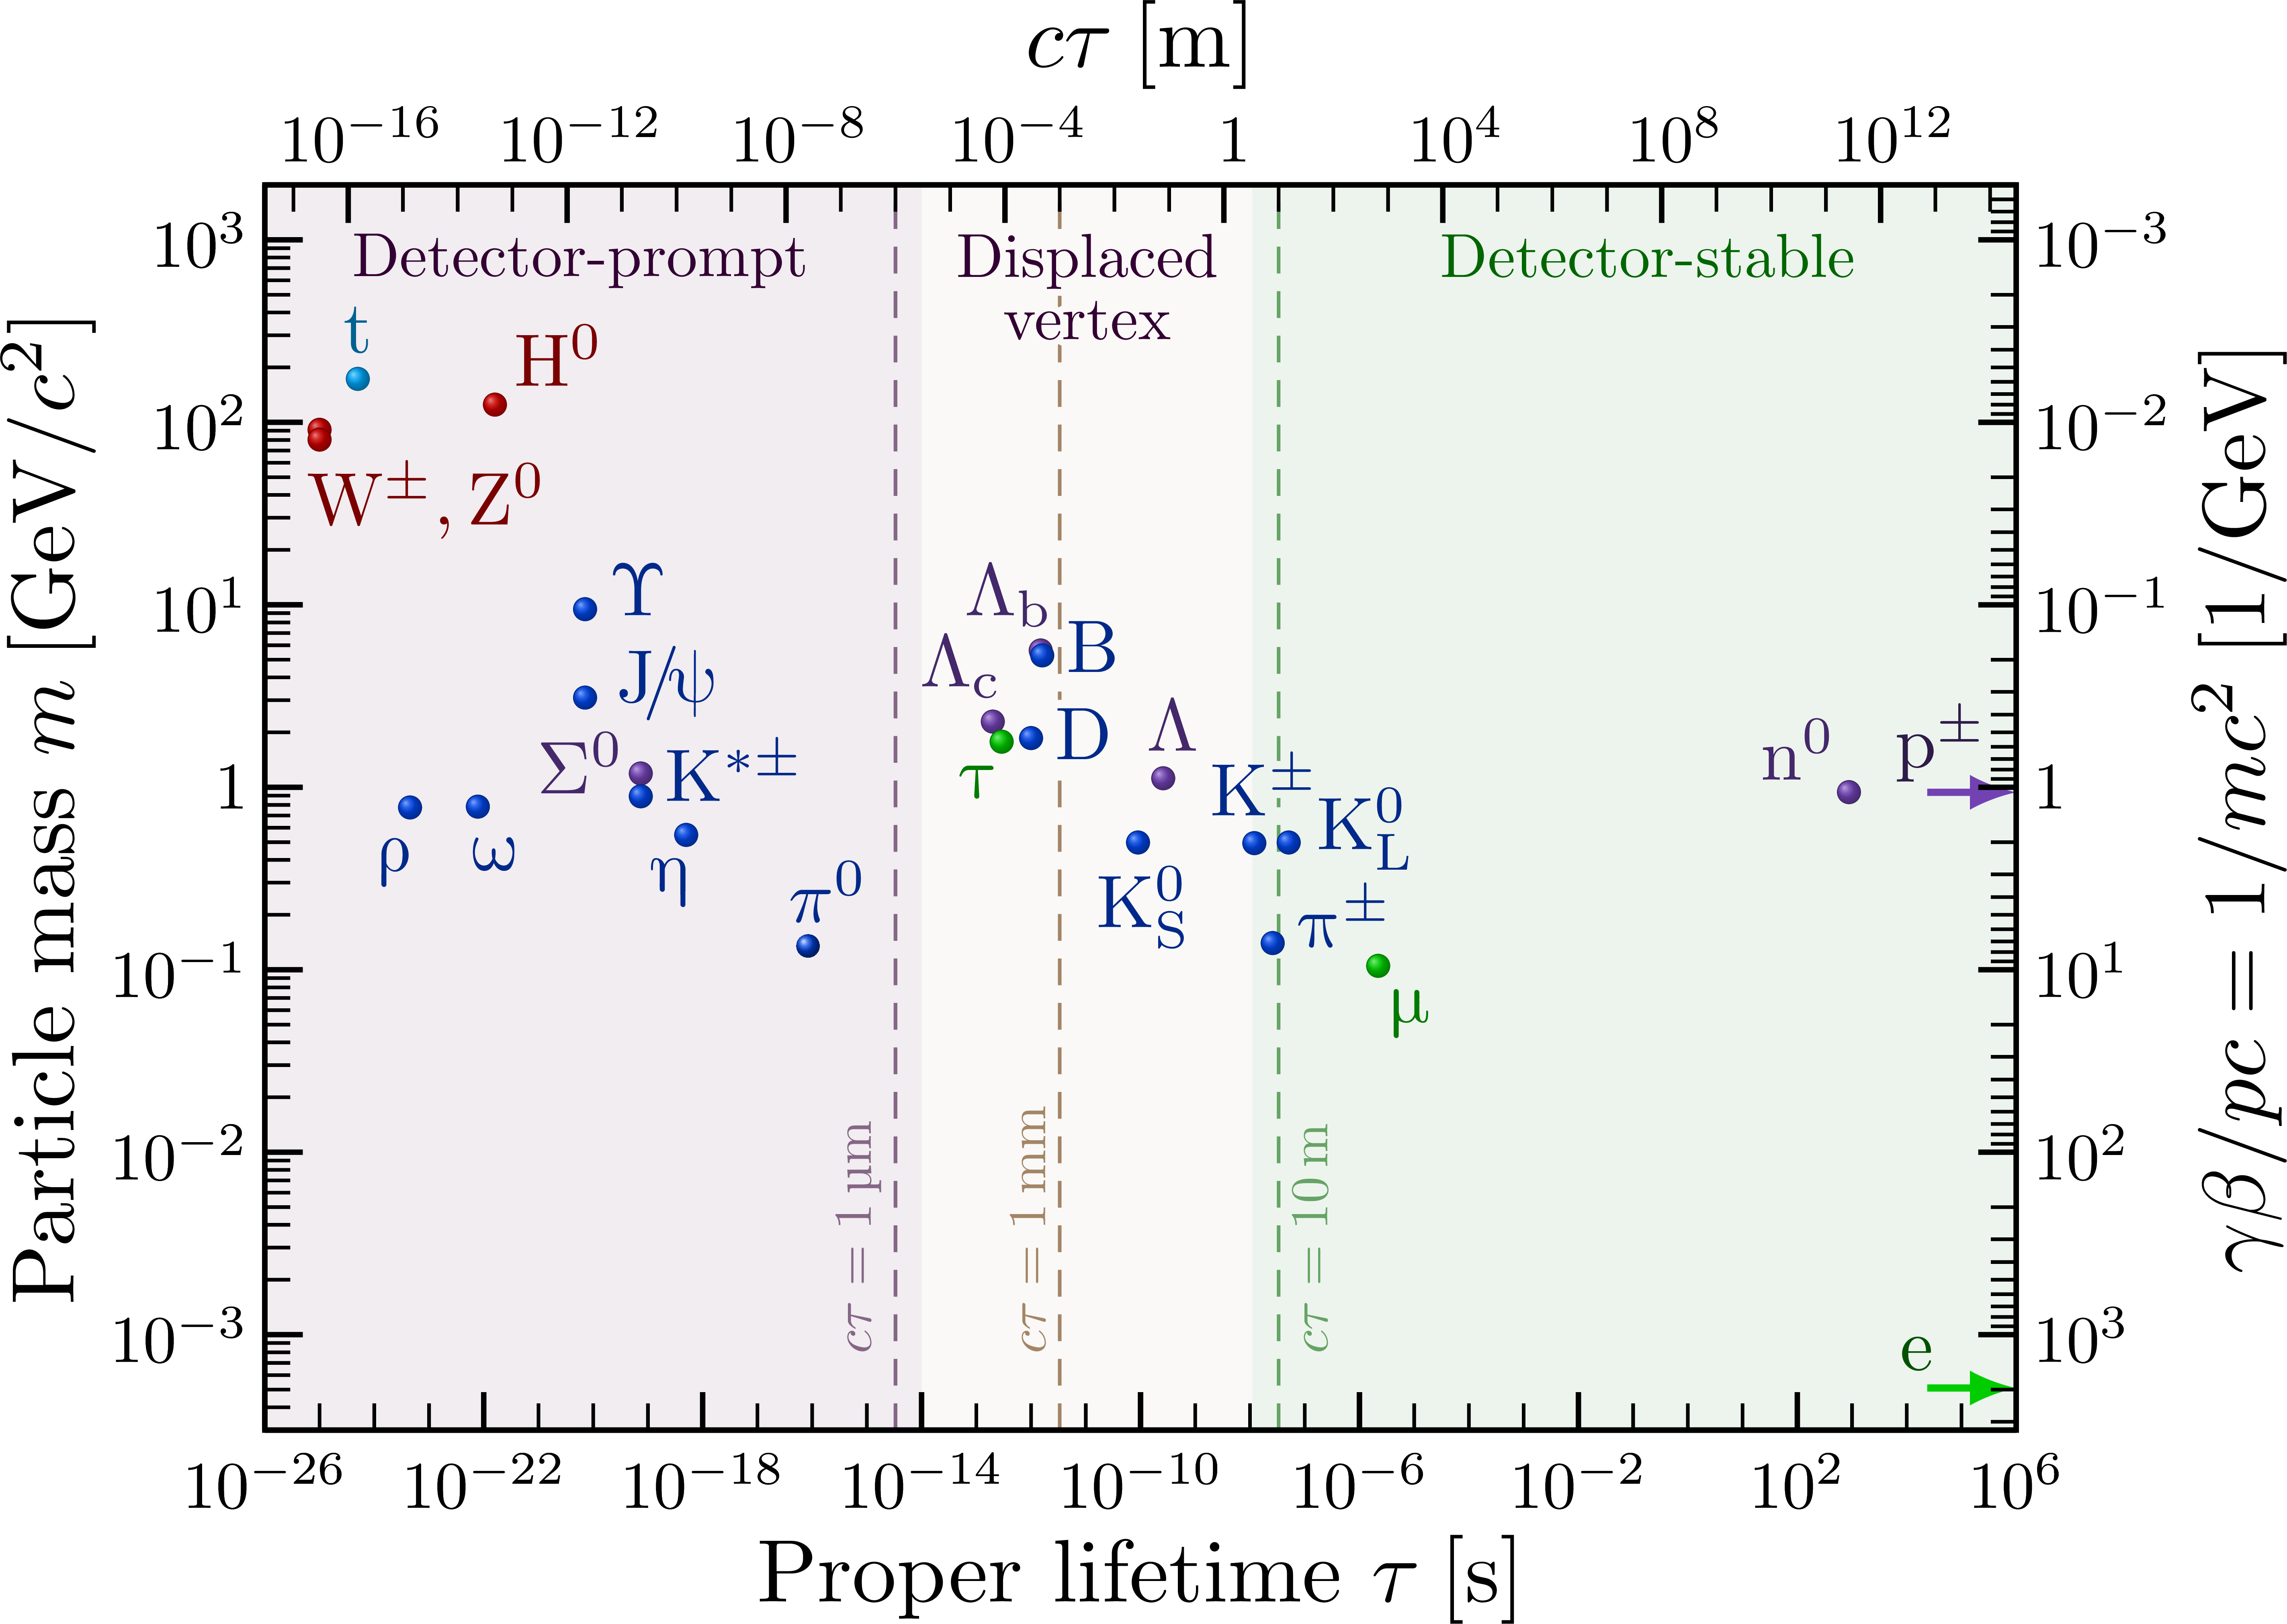 Zoomed in so the electron falls outside the mass range:
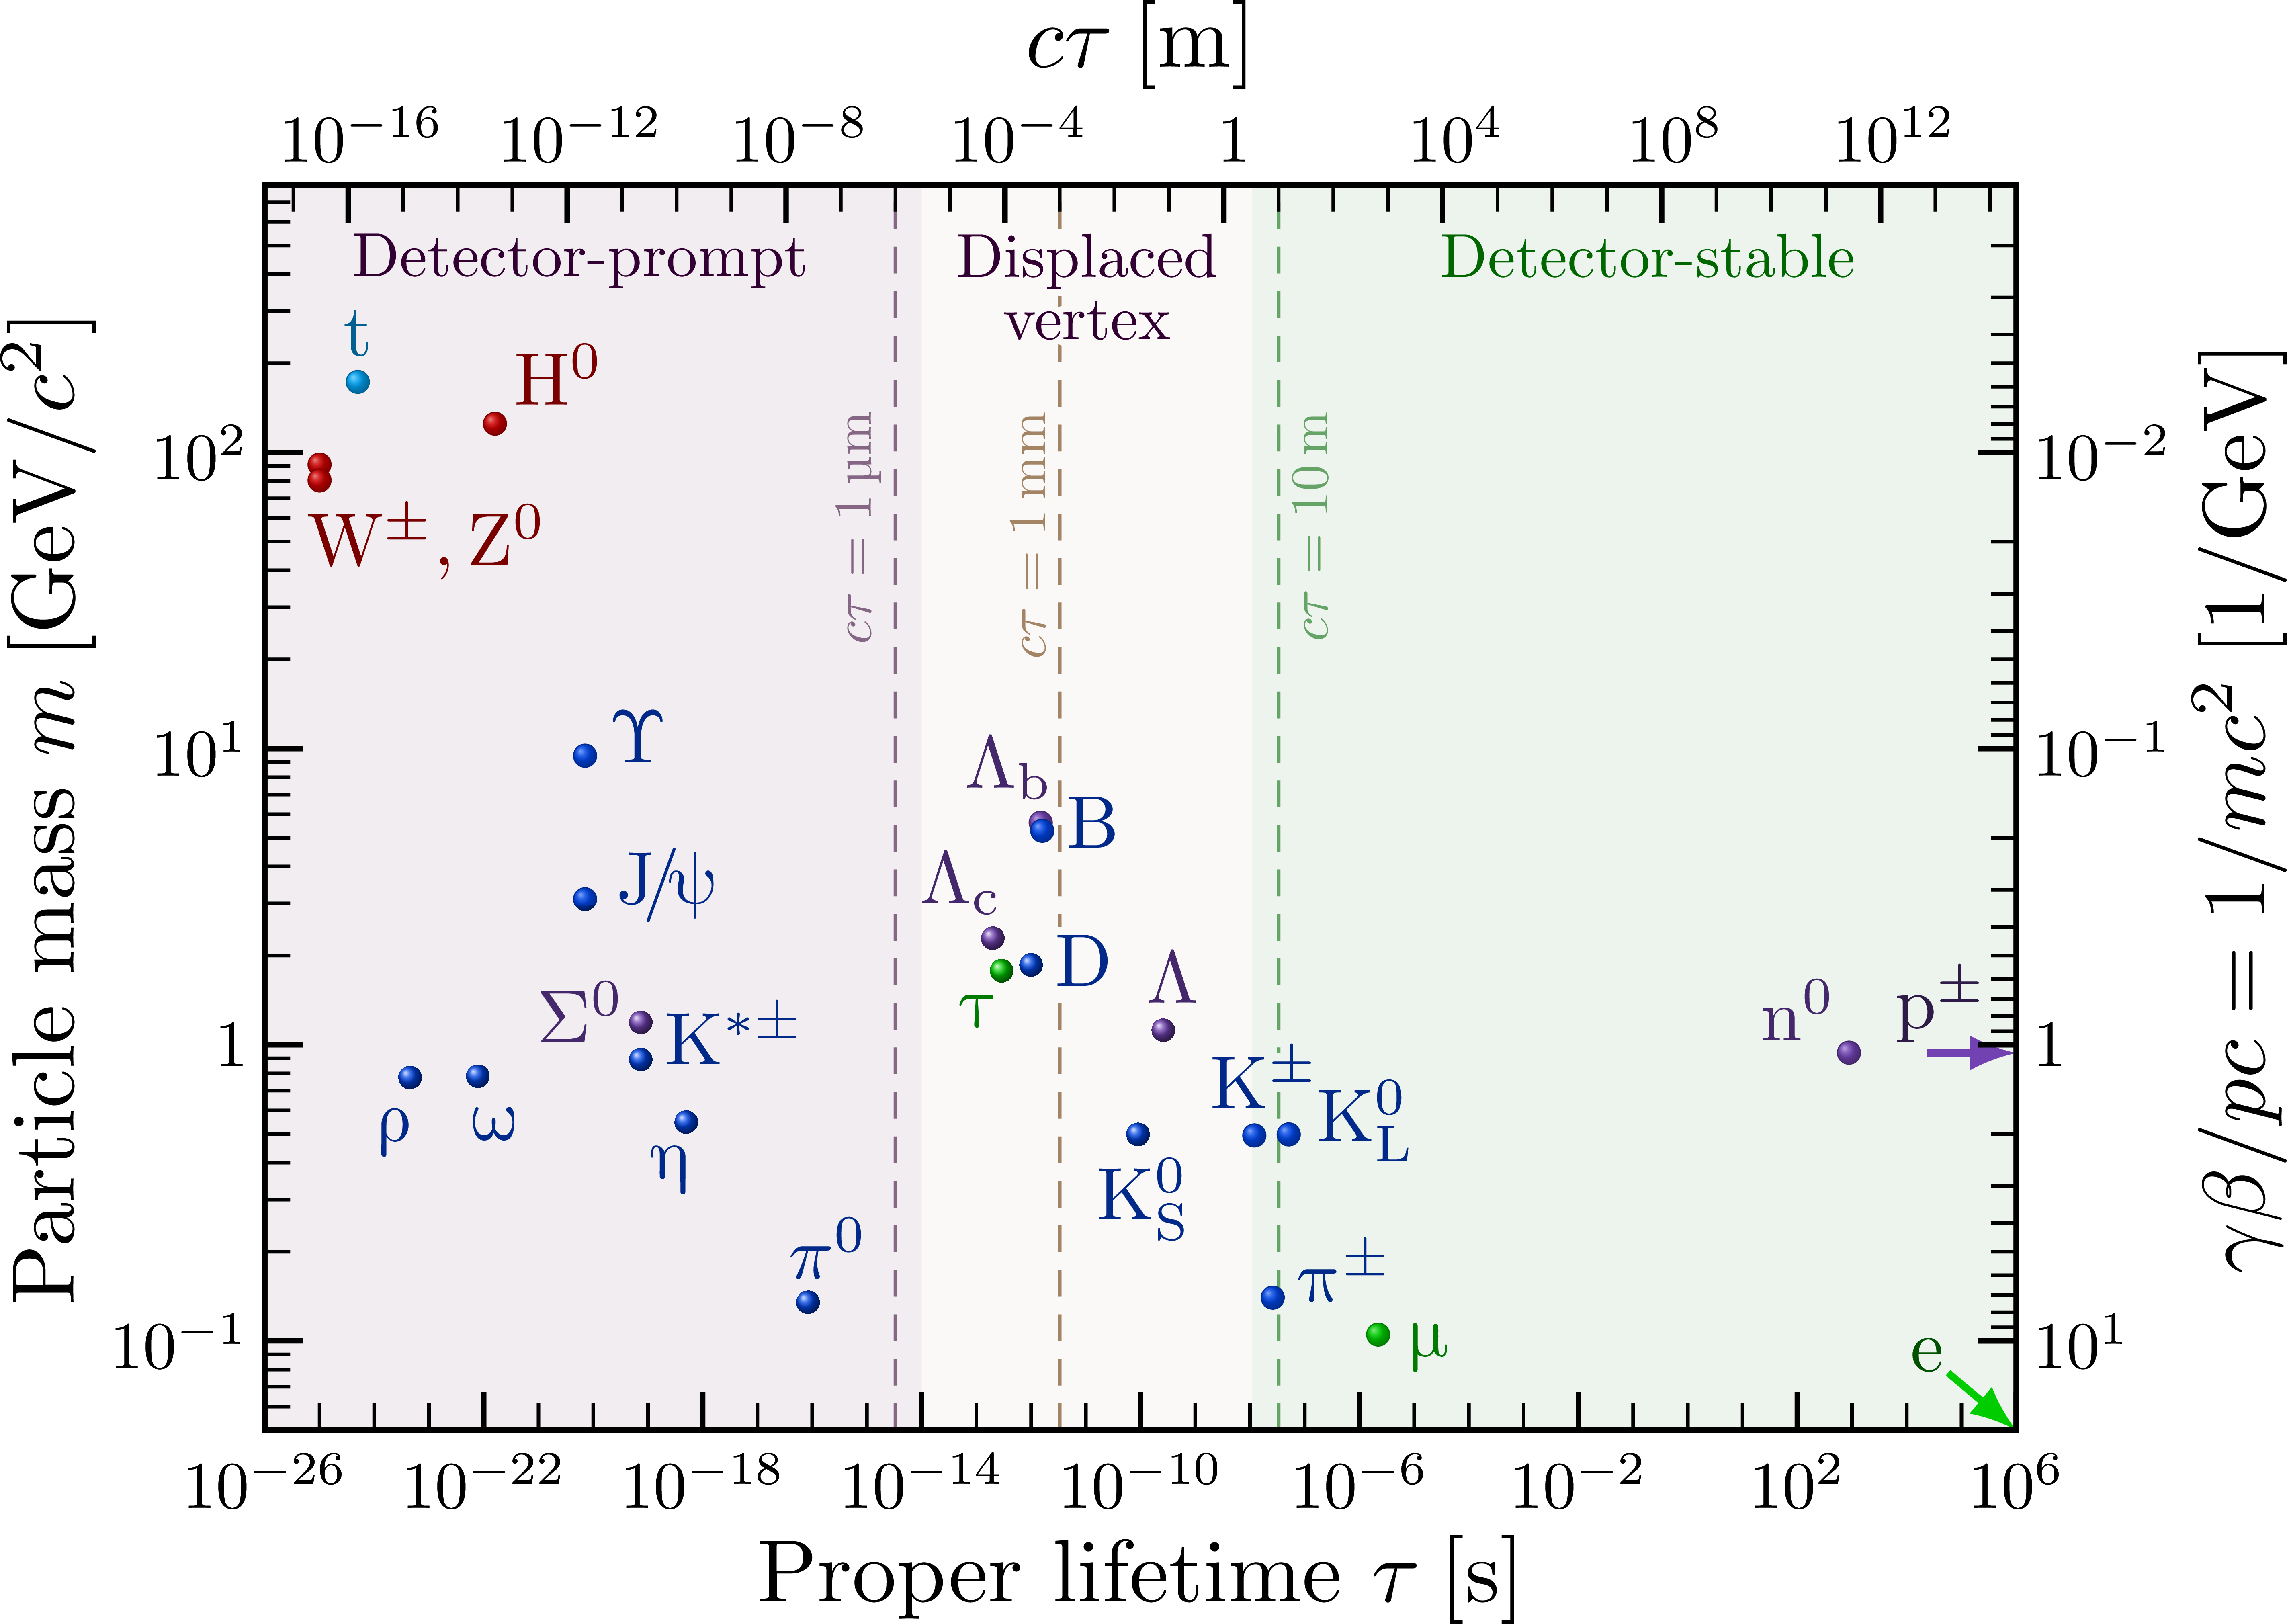 The average decay length L = γβcτ, assuming a momentum of p = 10 GeV/c:
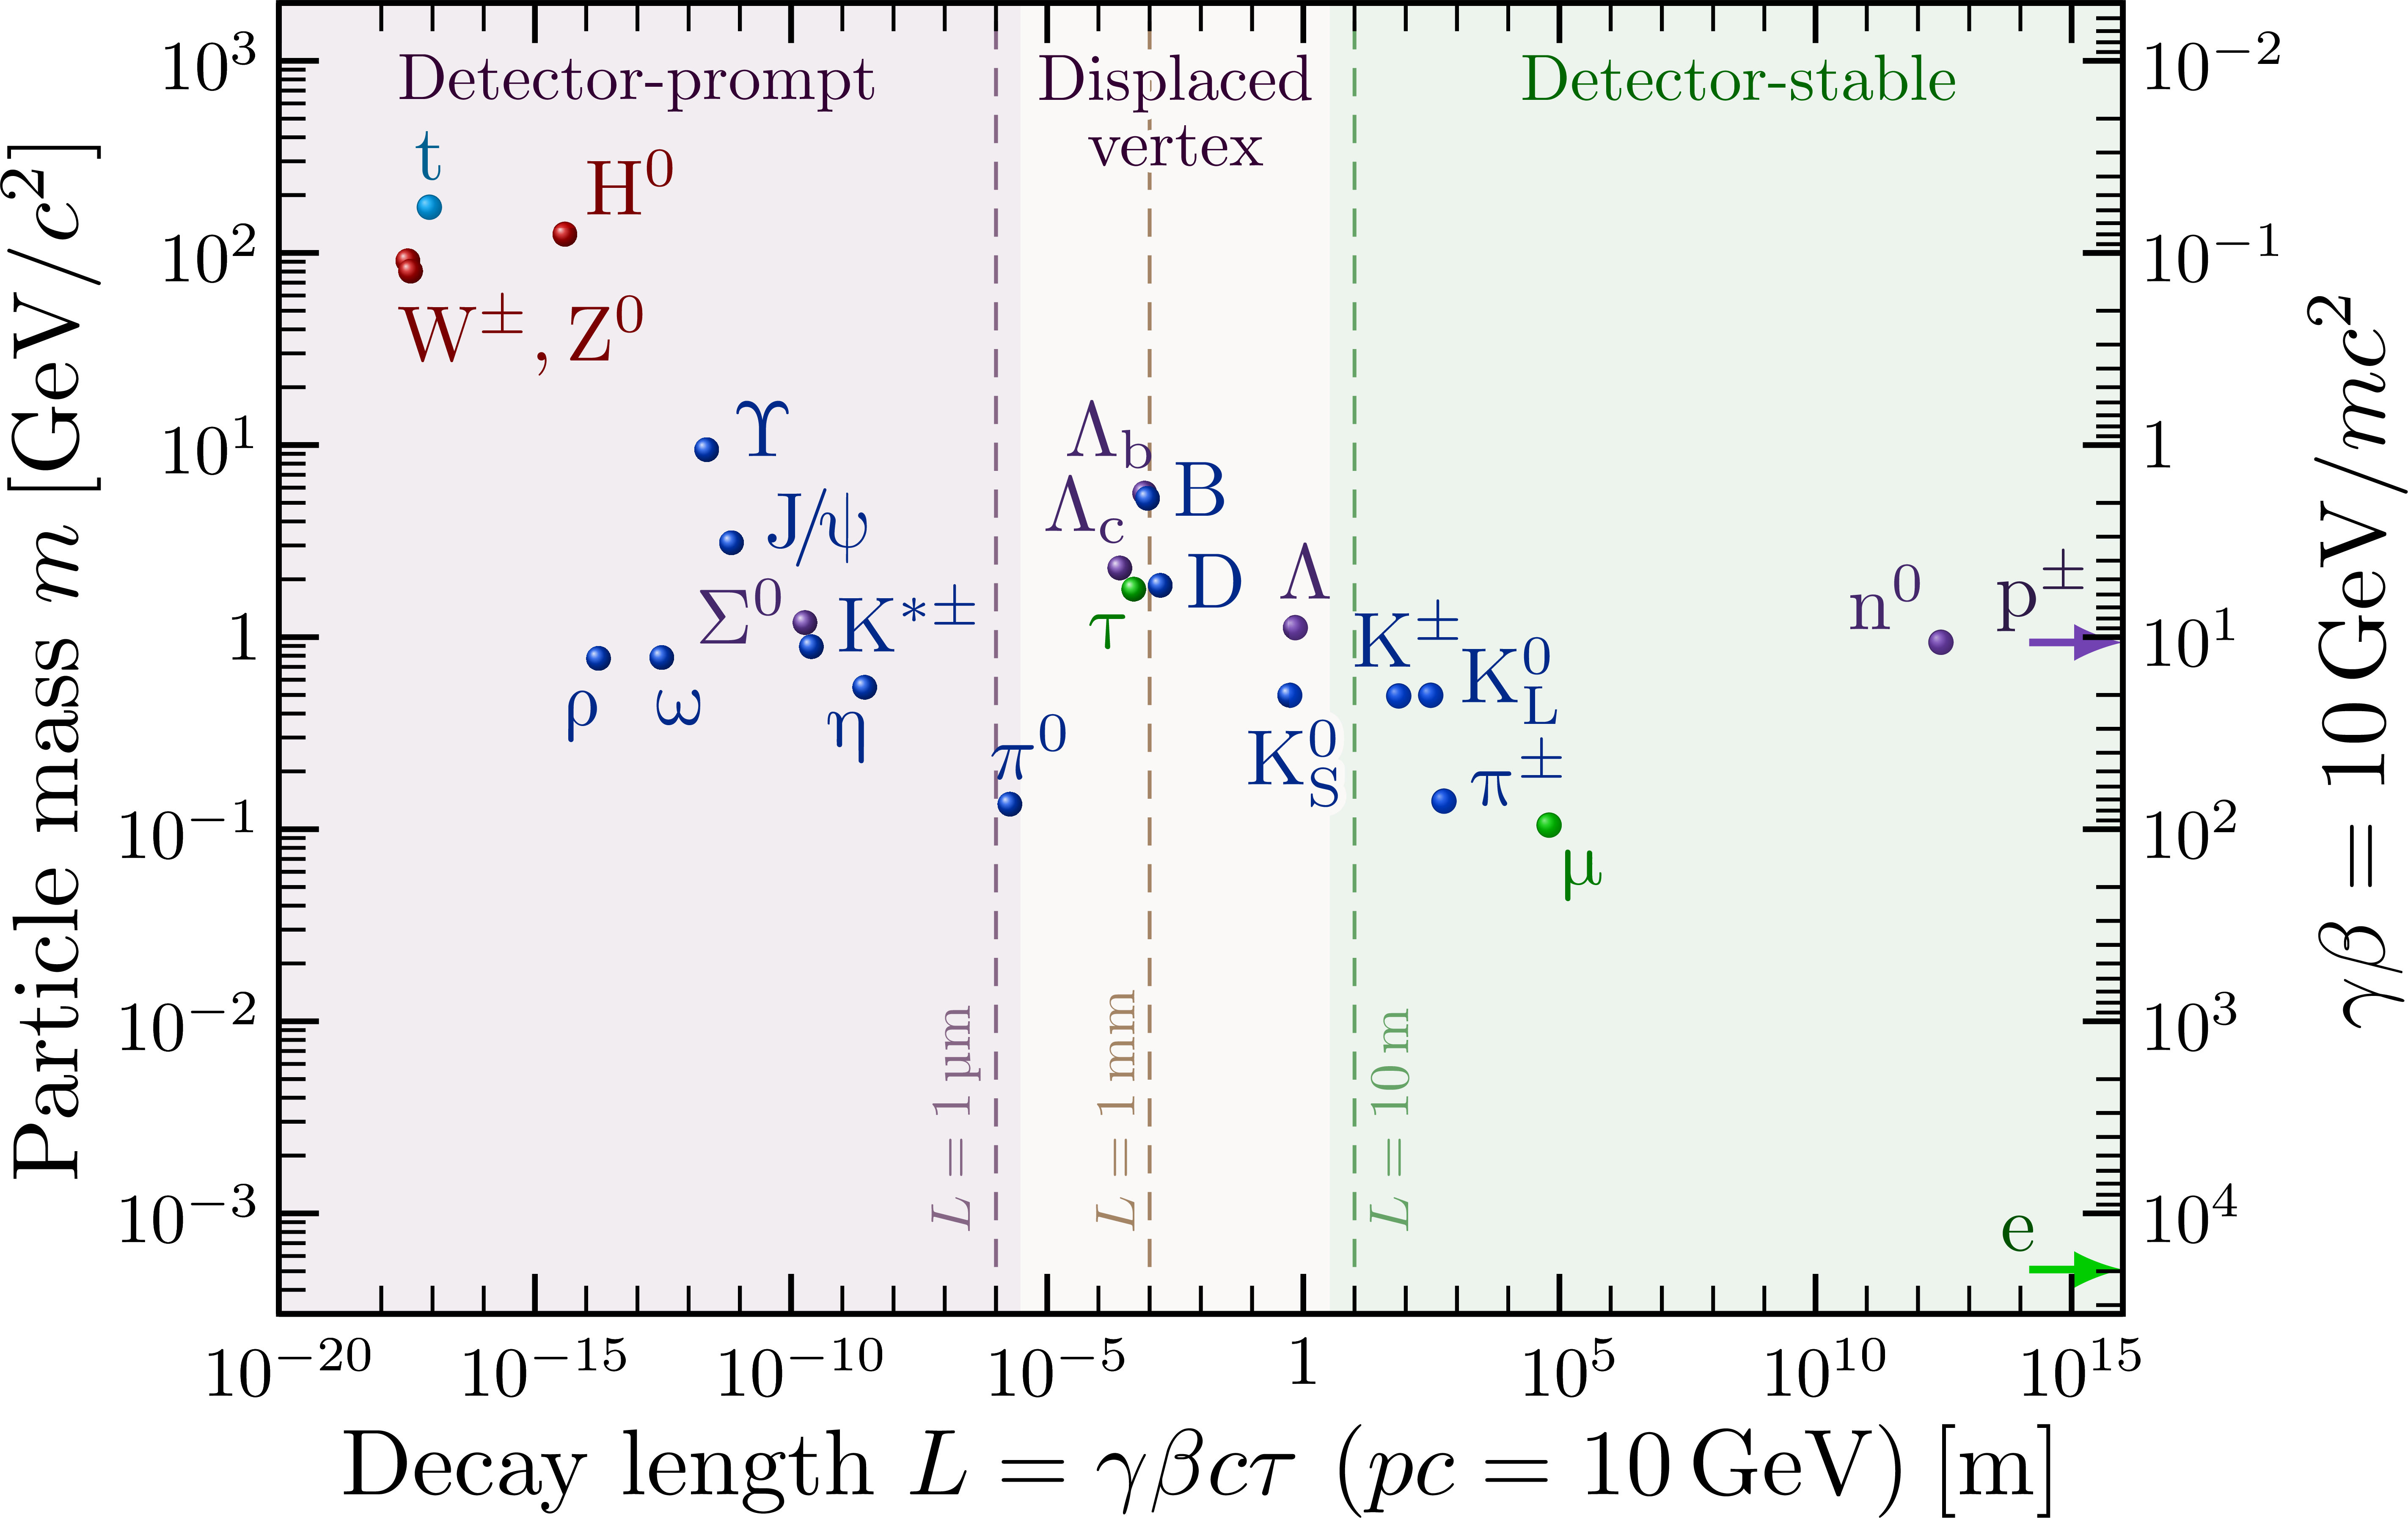 Assuming a momentum of p = 20 GeV/c:
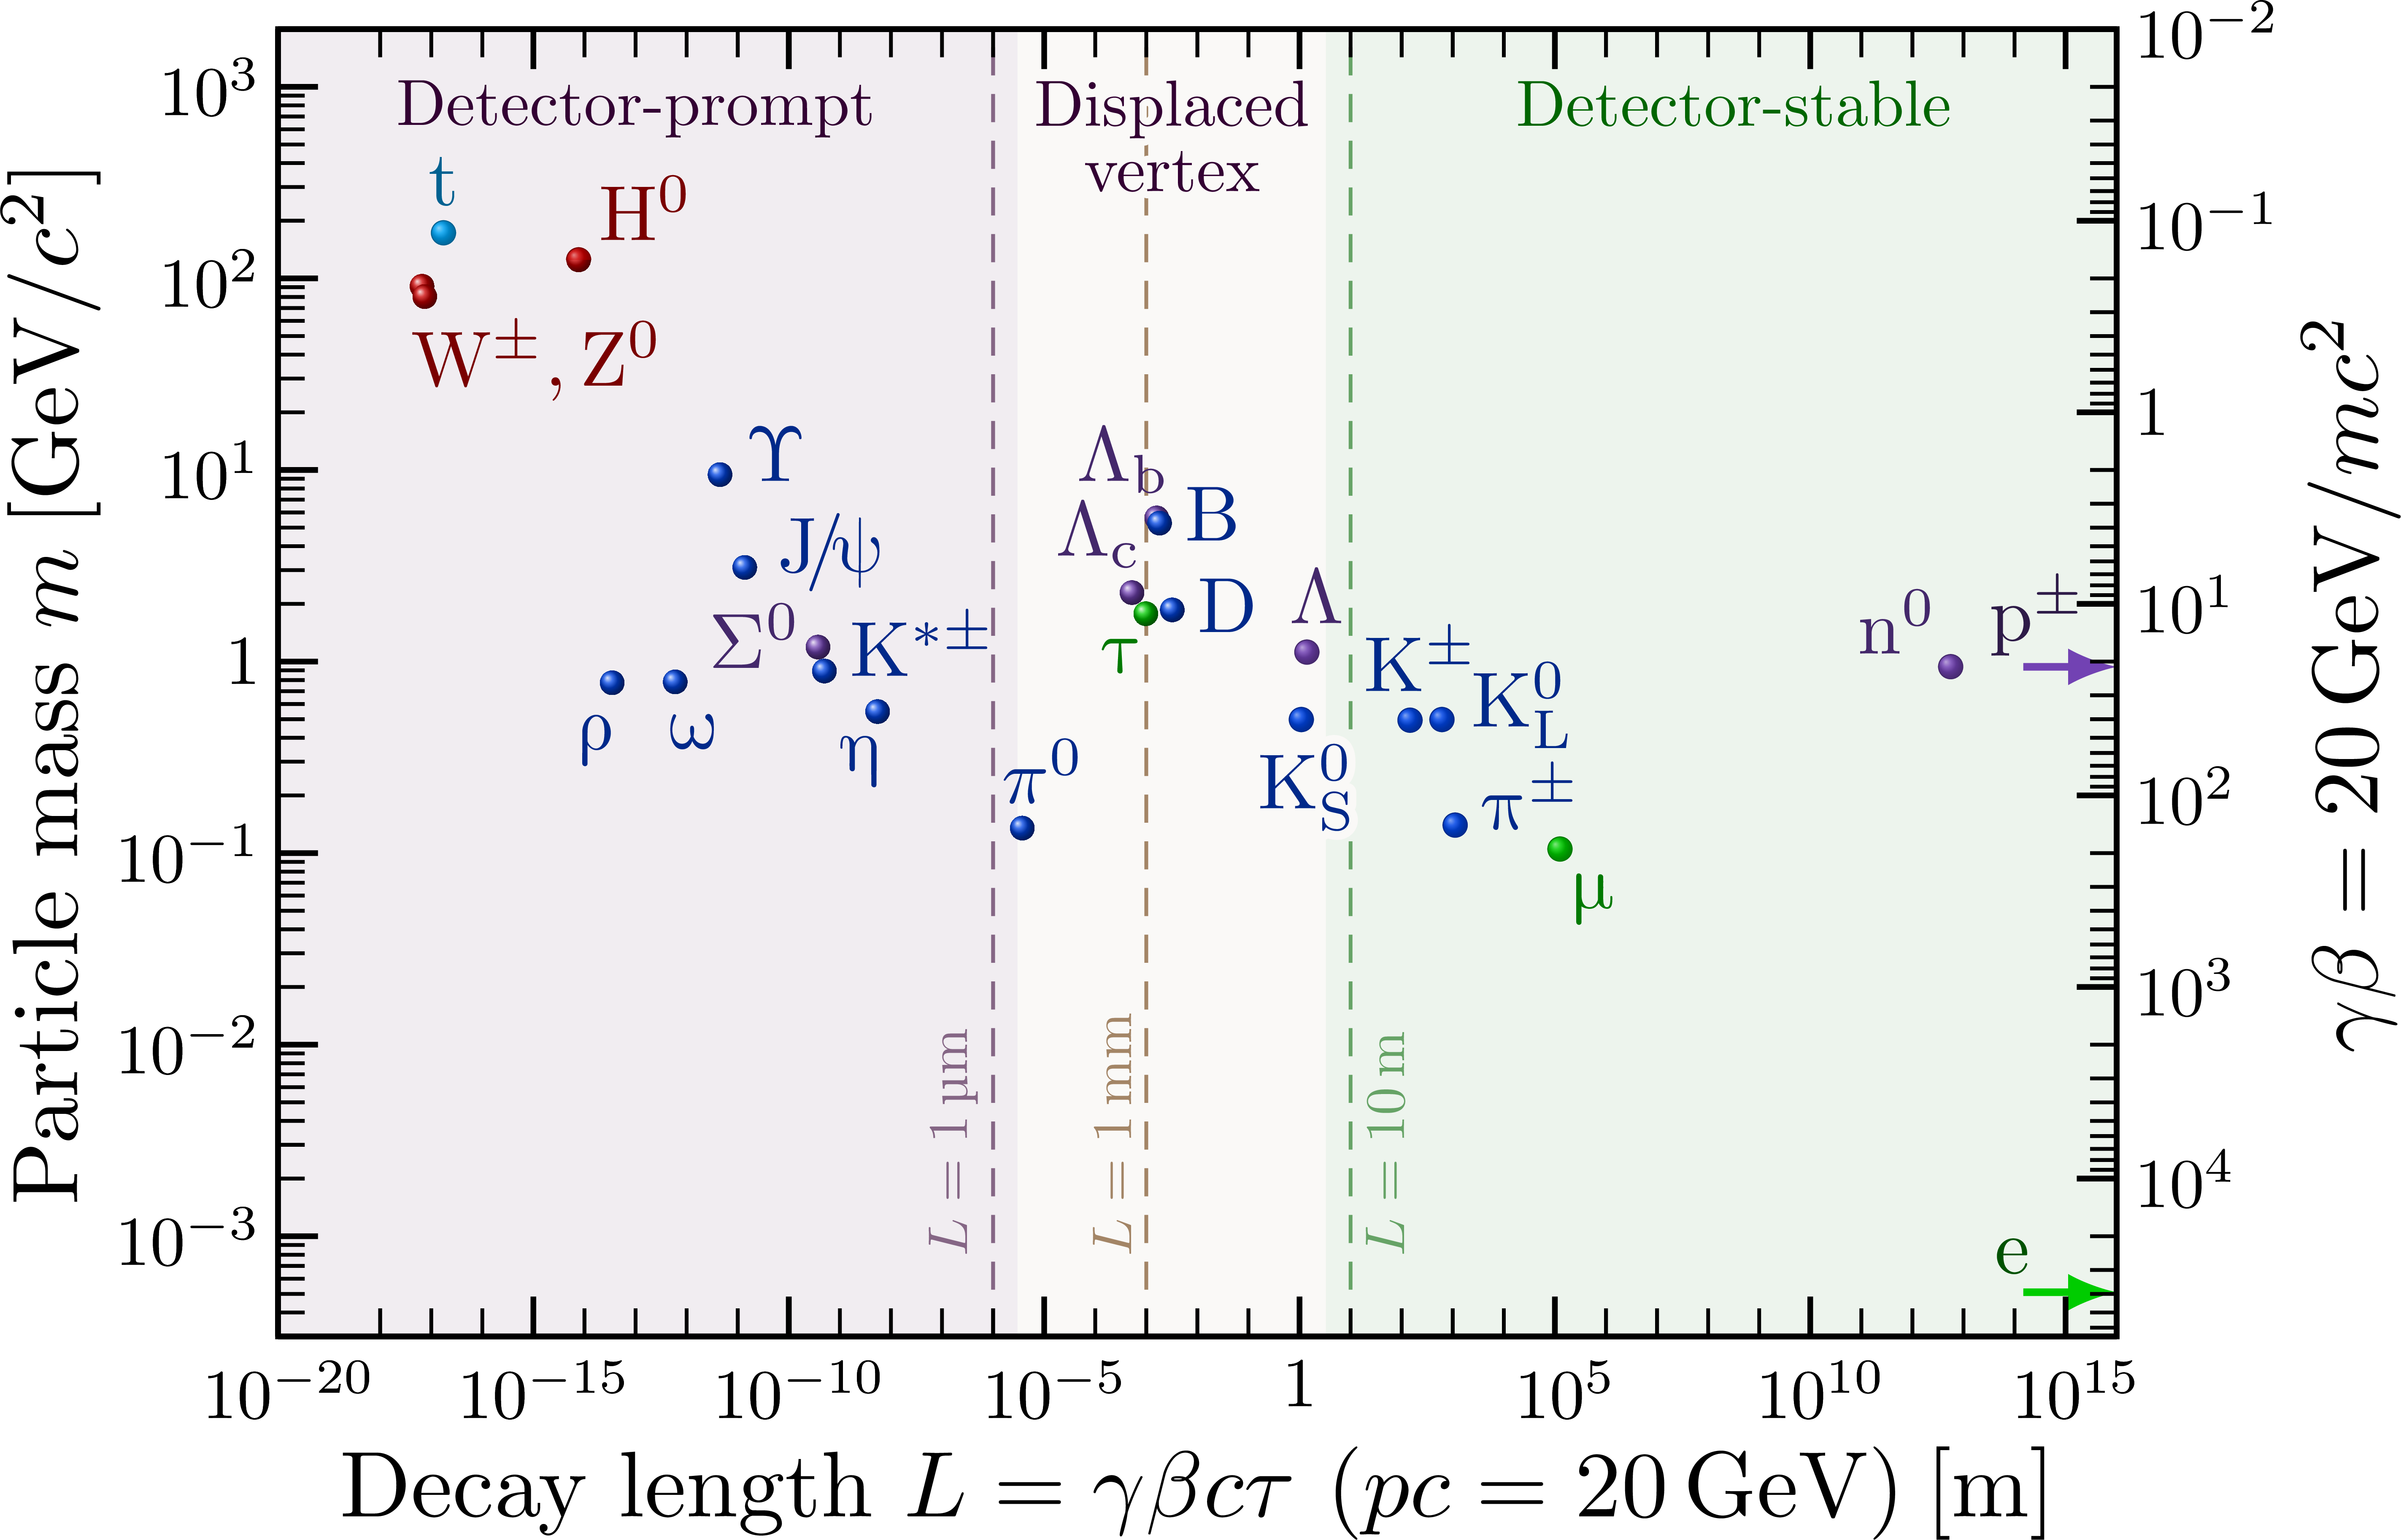 Assuming a momentum of p = 50 GeV/c:
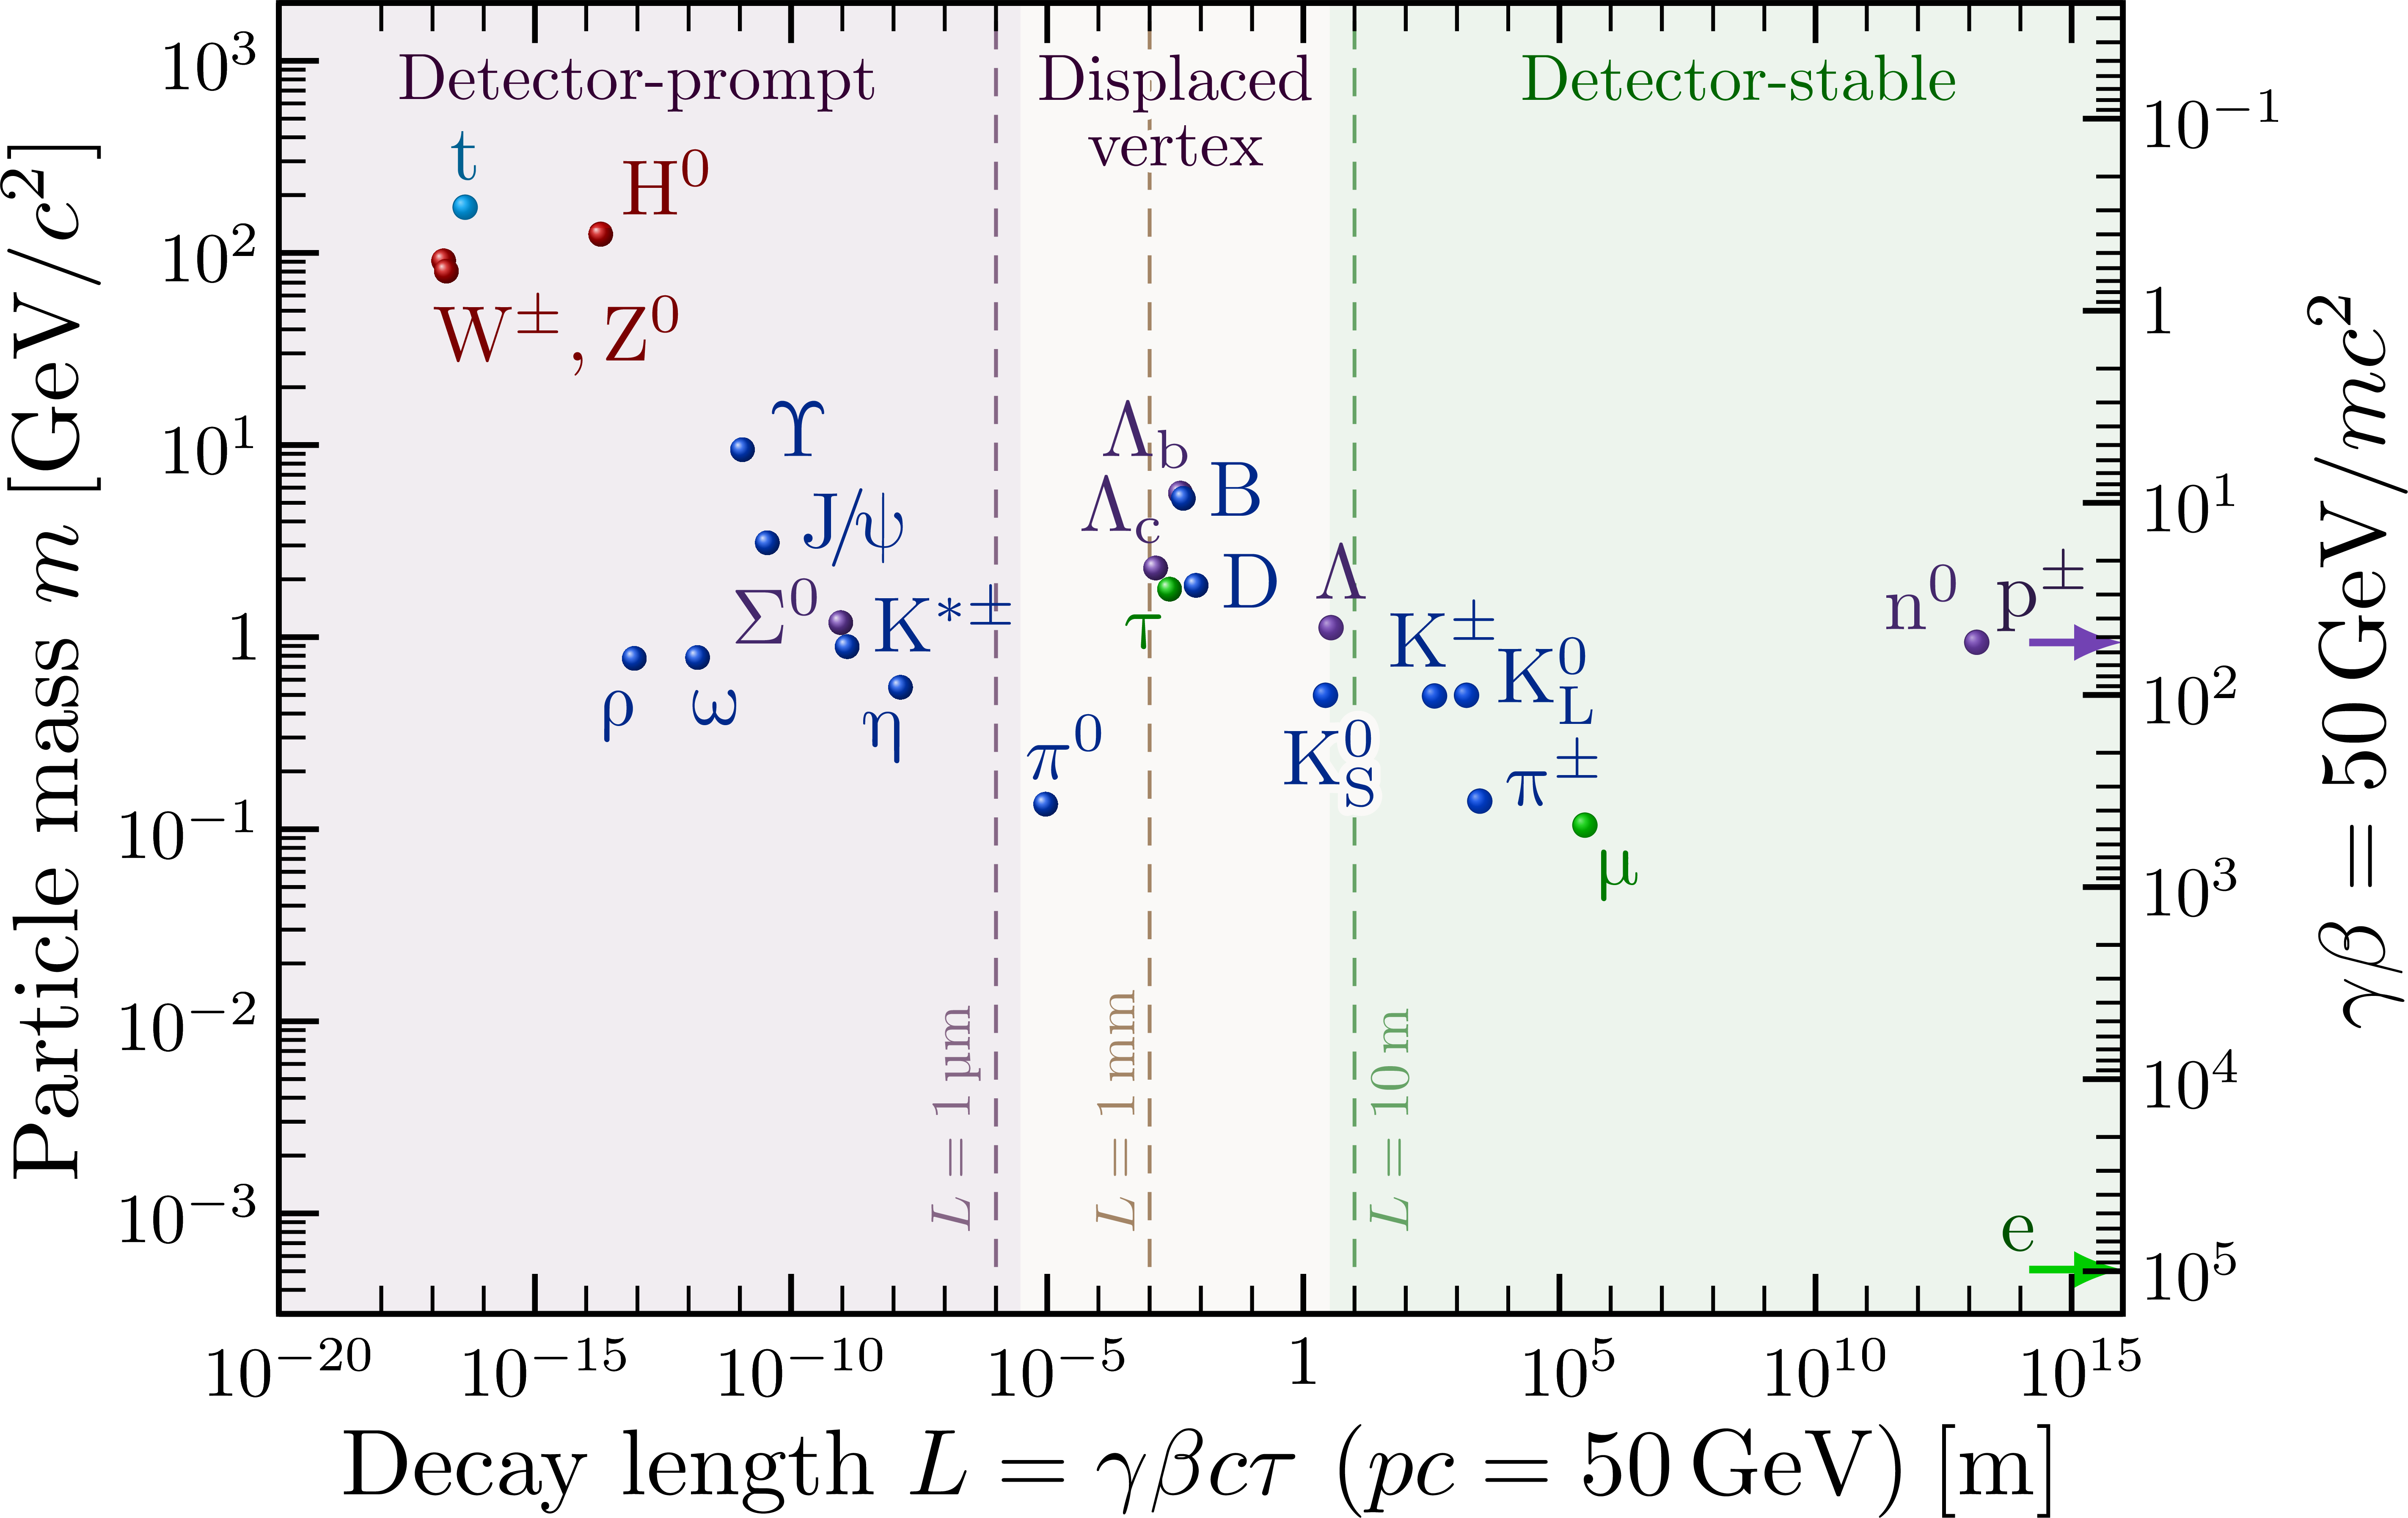 Assuming a momentum of p = 100 GeV/c:
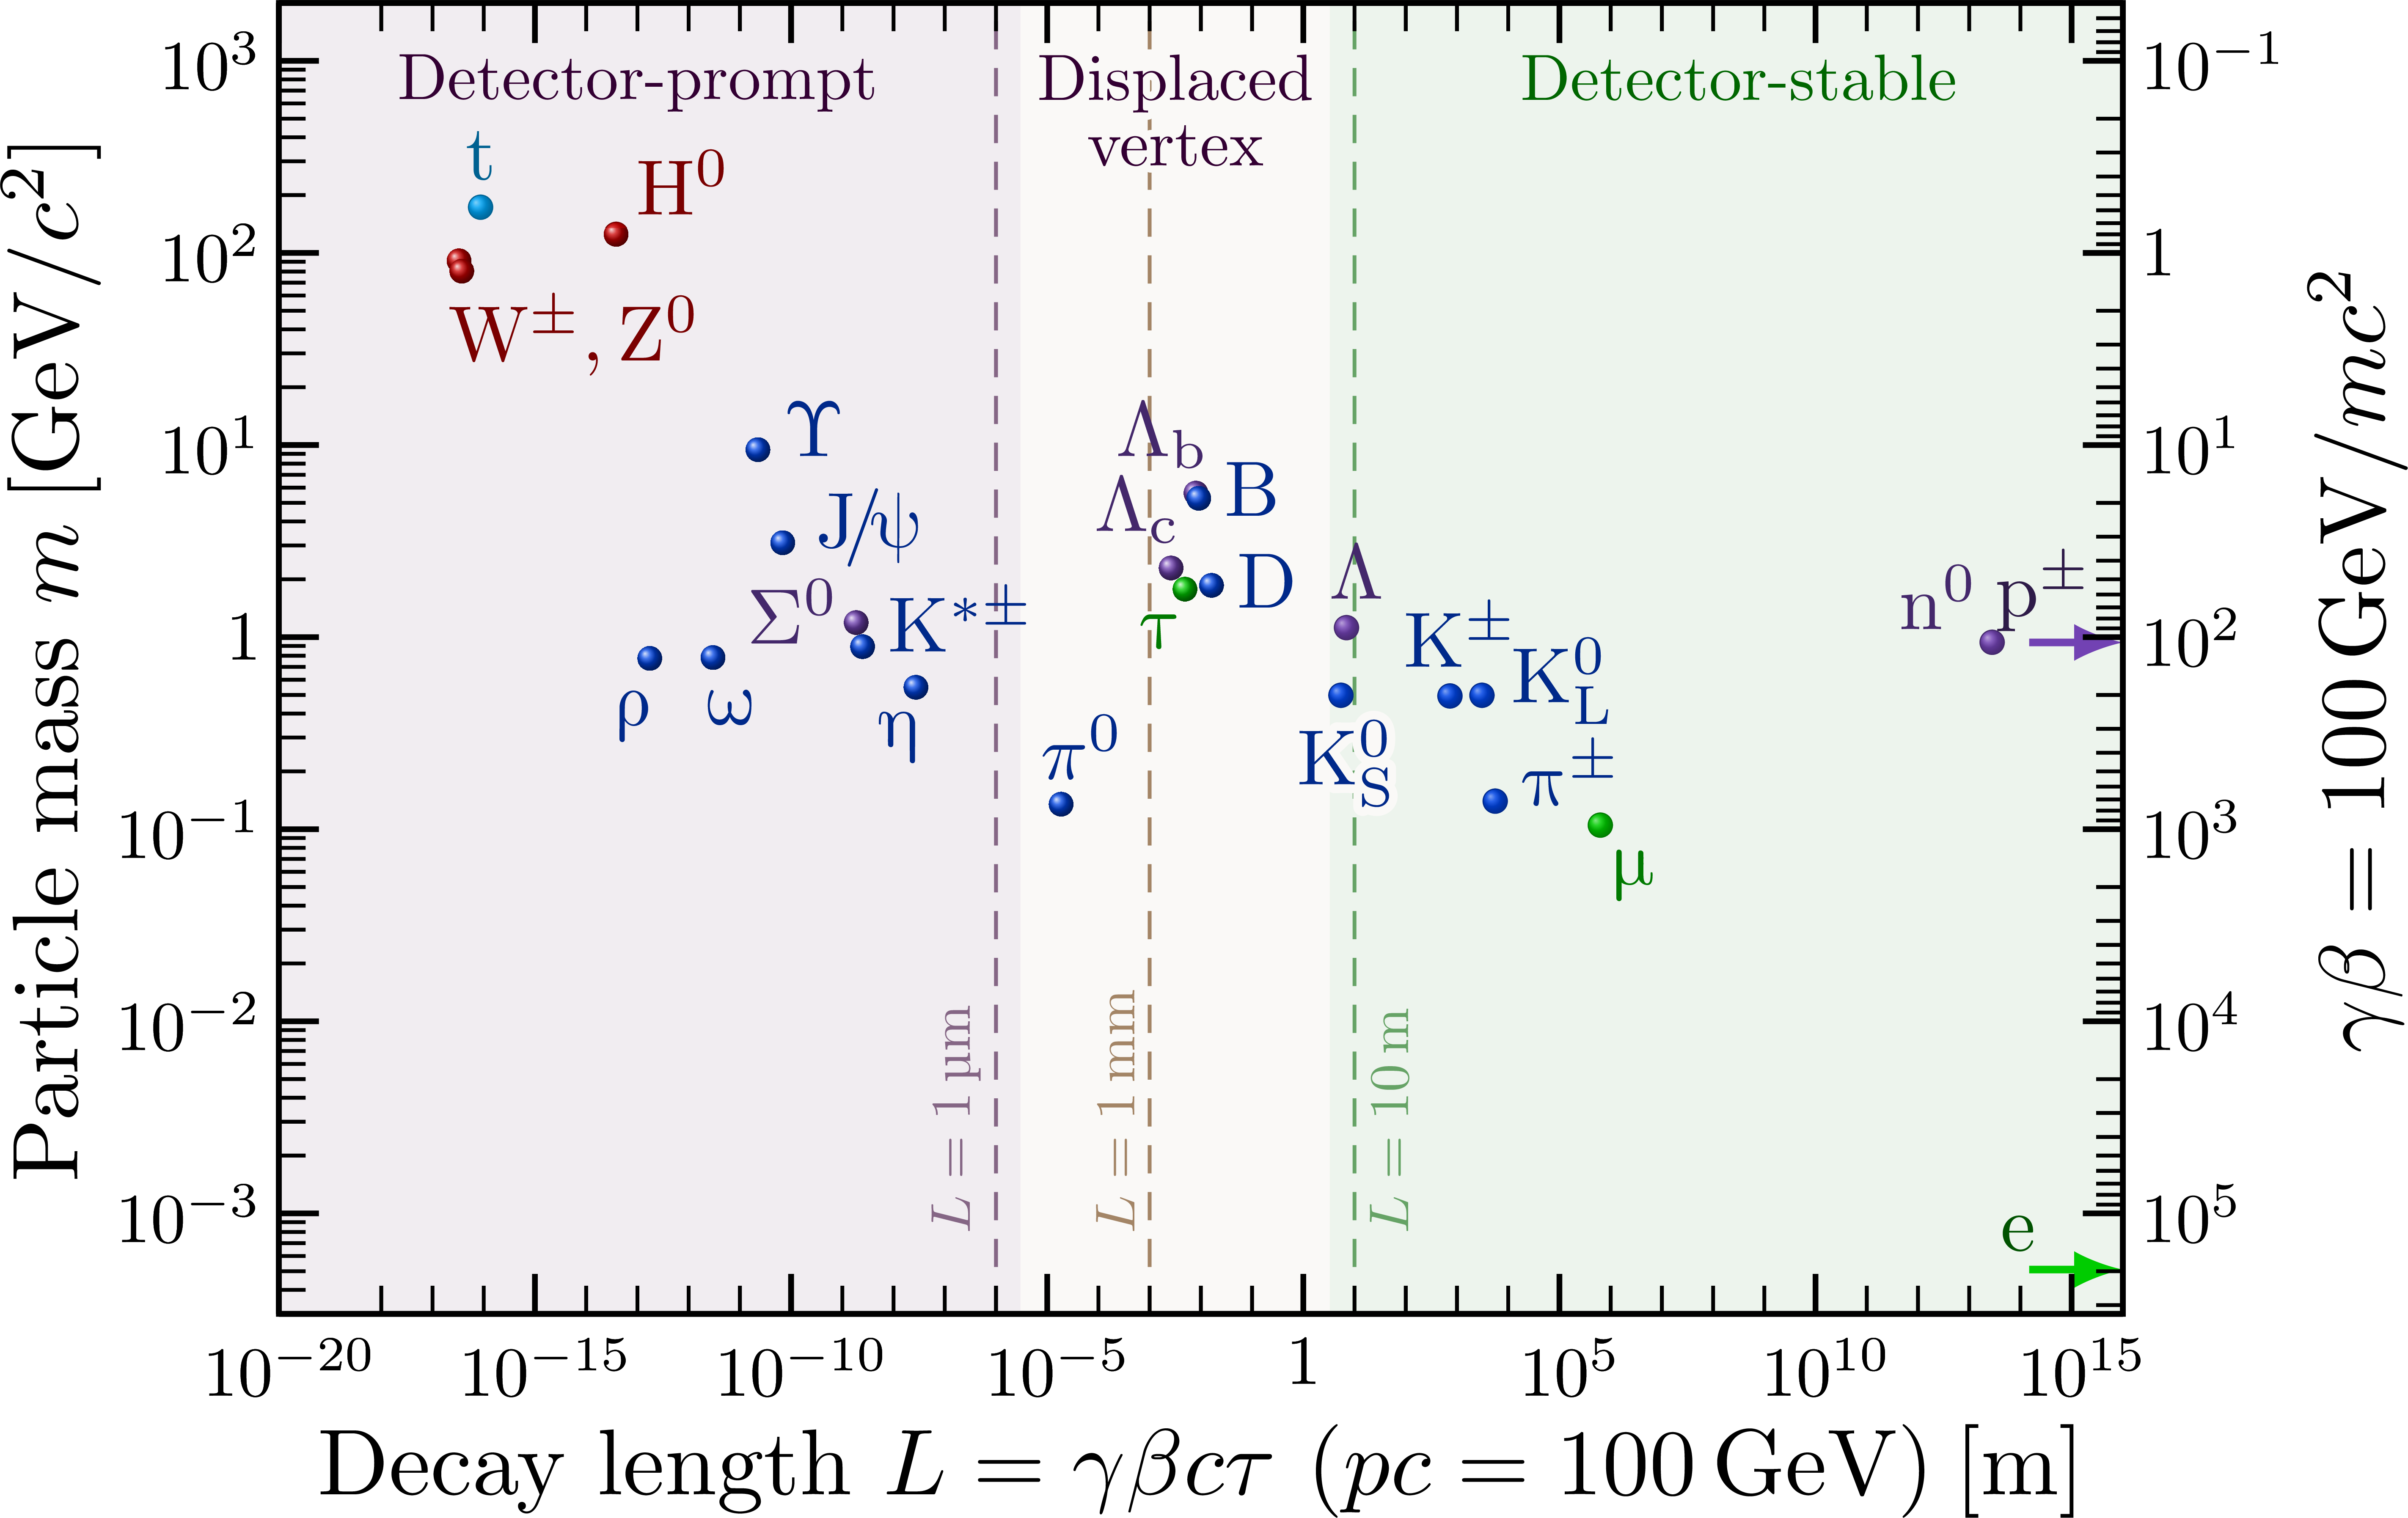 Assuming a momentum p between 1 and 50 GeV/c to show the full variation of the decay length:
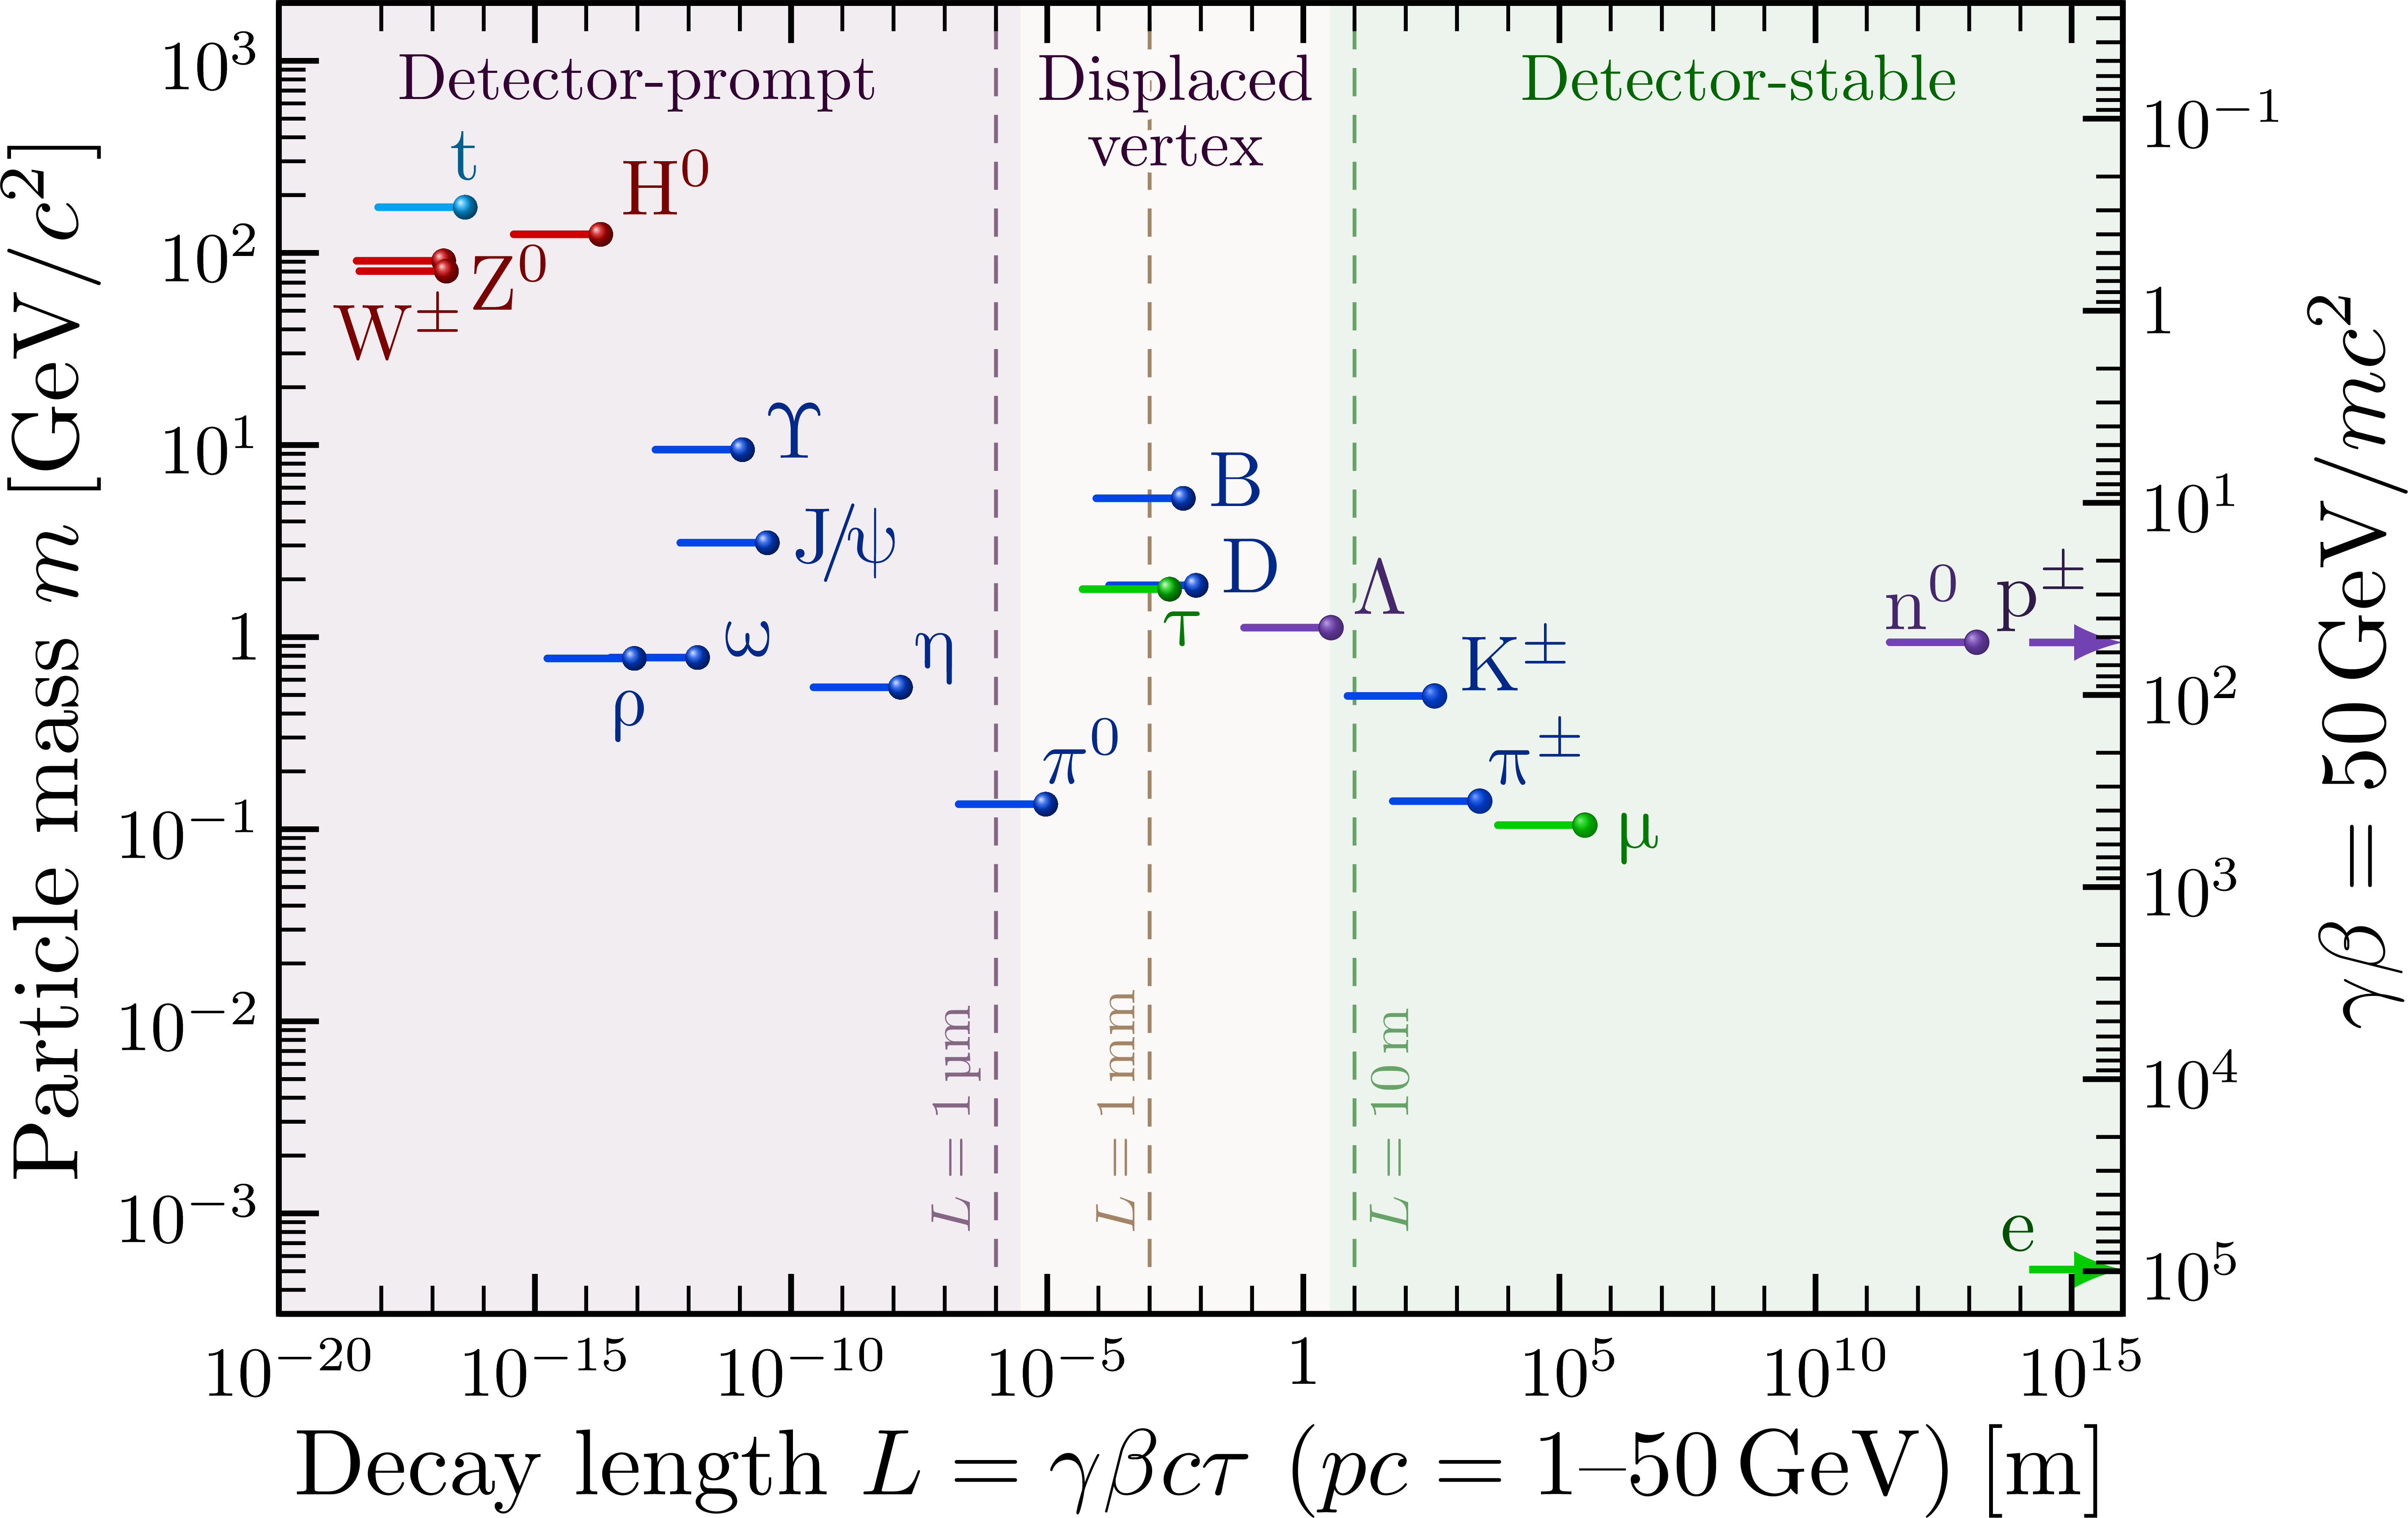
Animating the average decay length for momenta between 1 and 50 GeV/c:
Edit and compile if you like:
% Author: Izaak Neutelings (December 2022)
% Inspired by
%   https://www.sciencedirect.com/science/article/pii/S0146641019300109
%   https://iopscience.iop.org/article/10.1088/1361-6471/ab4574/pdf
\documentclass[border=3pt,tikz]{standalone}
\usepackage{siunitx}
\usepackage[outline]{contour} % glow around text
\usepackage{xfp} % needed for accuracy with \fpeval
\usepackage{pgfplots} % for the axis environment
\contourlength{1.1pt}
\tikzset{>=latex} % for LaTeX arrow head

% redraw axis on top / in front (over filled areas)
\makeatletter \newcommand{\pgfplotsdrawaxis}{\pgfplots@draw@axis} \makeatother
\pgfplotsset{axis line on top/.style={after end axis/.append code={\pgfplotsdrawaxis}}}

% UNSLANT GREEK LETTERS for particle symbols
% https://tex.stackexchange.com/questions/145926/upright-greek-font-fitting-to-computer-modern
% https://tex.stackexchange.com/questions/236915/adjust-custom-made-upright-greek-letters-when-used-in-subscripts
\usepackage{scalerel}
\newsavebox{\foobox}
\newcommand{\slantbox}[2][0]{\mbox{%
  \sbox{\foobox}{#2}%
  \hskip\wd\foobox
  \pdfsave
  \pdfsetmatrix{1 0 #1 1}%
  \llap{\usebox{\foobox}}%
  \pdfrestore
}}
\newcommand\unslant[2][-.25]{%
  \mkern1.2mu%
  \ThisStyle{\slantbox[#1]{$\SavedStyle#2$}}%
  \mkern-1.2mu%
}
\newcommand{\PJpsi}{J\!/\!$\unslant\psi$}

% COLORS
\colorlet{boscol}{red!80!black} % boson color
\colorlet{mescol}{blue!70!cyan!90!black} % meson color
\colorlet{barcol}{blue!80!cyan!65!red!85} % baryon color
\colorlet{lepcol}{green!80!black} % lepton color
\colorlet{promptcol}{violet!40!black} % prompt color
\colorlet{dispcol}{orange!40!black} % displaced color
\colorlet{stablecol}{green!40!black} % stable color

% STYLES
\tikzstyle{mytick}=[black,line width=0.6]
\tikzstyle{myminortick}=[black,line width=0.4]
\tikzstyle{particle}=[text=#1!60!black,draw=none,ball color=#1,postaction={
  fill=#1,fill opacity=0.4,draw=#1!60!black,line width=0.1}]
\tikzset{
  particle/.default=lepcol
}
\pgfplotsset{
  compat=1.13,
  width=8.5cm, height=6.5cm,
  axis line style={mytick},
  tick style={mytick},
  minor tick style={myminortick},
  ticklabel style={scale=0.75}
}

% MACROS
\def\tmin{1e-26} % minimum lifetime (tau)
\def\tmax{1e6}   % maximum lifetime (tau)
\def\mmin{3e-4}  % minimum mass
\def\mmax{2e3}   % maximum mass
%\def\ctmin{3e-18} % \tmin/3e8 = 1e-26*3e8
%\def\ctmax{3e14} % \tmax/3e8 = 1e6*3e8
\pgfmathsetmacro\ctmin{\fpeval{\tmin*3e8}} % minimum ctau
\pgfmathsetmacro\ctmax{\fpeval{\tmax*3e8}} % maximum ctau
\def\Lmin{1e-20}  % minimum decay length (L)
\def\Lmax{1e16}   % maximum decay length (L)
\def\xprompt{1e-6} % prompt decay in detector (ctau = 1e-6 m)
\def\xdisp{  1e-3} % displaced vertex (ctau = 1e-3 m)
\def\xstable{10}   % stable in detector (ctau = 10 m)
\def\r{1.3pt}
\def\part[#1](#2){ % draw particle ball
  \draw[particle=#1] (#2) circle(\r)
}
\def\partDL[#1](#2,#3){ % draw particle ball for average decay length
  % calculate average decay length as L = (pc/mc^2)*ct
  \draw[particle=#1] ({\pc/(#3)*(3e8*#2)},#3) circle(\r)
}
\def\partlineDL[#1](#2,#3){ % draw particle ball for average decay length
  \draw[#1,thick,line cap=round]
    ({\pcmin/(#3)*(3e8*#2)},#3) -- ({\pcmax/(#3)*(3e8*#2)},#3);
  \draw[particle=#1] ({\pcmax/(#3)*(3e8*#2)},#3) circle(\r)
}

\begin{document}


% LOG-LOG: Mass (m) vs. lifetime (tau)
\begin{tikzpicture}
  \message{^^JLog-log plot: mass vs. lifetime}
  \begin{loglogaxis}[
    xmin=\tmin, xmax=\tmax,
    ymin=\mmin, ymax=\mmax,
    log basis x=10,
    log basis y=10,
    yticklabel={% % format 10^0 as 1
      \pgfmathsetmacro\t{int(\tick)} \ifnum\t=0 $1$ \else $10^{\t}$ \fi%
    },
    %ytick={0.0001,0.001,0.01,0.1,1,10,100,1000},
    max space between ticks=25,
    yminorticks=true,
    %xminorticks=true,
    xlabel={Proper lifetime $\tau$\:[s]},
    ylabel={Particle mass $m$\:[$\text{GeV}/c^2$]},
    xlabel style={below=-3pt},
    ylabel style={above=-7pt},
    yticklabel style={left=-1pt},
    axis x line*=bottom,
    axis y line*=left,
    axis line on top, % redraw axis on top/in front
  ]

    % BANDS
    \pgfmathsetmacro\tprompt{\fpeval{\xprompt/3e8}} % prompt decay in detector (tau = 1e-6/3e8)
    \pgfmathsetmacro\tdisp{  \fpeval{\xdisp/3e8}}   % displaced vertex (tau = 1e-3/3e8)
    \pgfmathsetmacro\tstable{\fpeval{\xstable/3e8}} % stable in detector (tau = 10/3e-8)
    \fill[dispcol!3] (\tstable,\mmin) rectangle (\tprompt,\mmax);
    \fill[promptcol!7] (\tmin,\mmin) rectangle (3*\tprompt,\mmax);
    \fill[stablecol!7] (0.33*\tstable,\mmin) rectangle (\tmax,\mmax);
    \draw[densely dashed,promptcol!60] (\tprompt,\mmin) -- (\tprompt,\mmax)
      node[pos=0.05,rotate=90,above right=-0.5pt,scale=0.6] {$c\tau = \SI{1}{\micro m}$};
    \draw[densely dashed,dispcol!60] (\tdisp,\mmin) -- (\tdisp,\mmax)
      node[pos=0.05,rotate=90,above right=-0.5pt,scale=0.6] {$c\tau = \SI{1}{mm}$};
    \draw[densely dashed,stablecol!60] (\tstable,\mmin) -- (\tstable,\mmax)
      node[pos=0.05,rotate=90,below right=-0.5pt,scale=0.6] {$c\tau = \SI{10}{m}$};
    \node[below=3,scale=0.7,promptcol] at ({\tmin*10^(log10(\tprompt/\tmin)/2)},\mmax)
      {Detector-prompt};
    \node[below=3,scale=0.7,promptcol,align=center] at ({\tprompt*10^(log10(\tstable/\tprompt)/2)},\mmax) %,fill=dispcol!3
      {\contour{dispcol!3}{Displaced}\\[-2pt]\contour{dispcol!3}{vertex}};
    \node[below=3,scale=0.7,stablecol] at ({\tstable*10^(log10(\tmax/\tstable)/2)},\mmax)
      {Detector-stable};

    \begin{scope}[every node/.style={scale=0.84}]

      % PARTICLES: QUARKS
      \part[mescol!50!cyan](5e-25,173) node[above=0pt] {t};

      % PARTICLES: BARYONS
      % https://en.wikipedia.org/wiki/List_of_baryons#JP_=_1/2+_baryons
      % https://en.wikipedia.org/wiki/Lambda_baryon#Types_of_lambda_baryons
      \part[barcol](879,940e-3) node[anchor=-40,inner sep=1.6pt] {n$^0$};
      \draw[<-,thick,barcol] (\tmax,938e-3) --++ (-10pt,0pt)
        node[pos=0.85,barcol!40!black,anchor=-90,inner sep=1pt] {p$^\pm$};
      %\part[barcol](8.0e-11,1.190) node[anchor=-105,inner sep=3.5pt] {$\Sigma^+$};
      \part[barcol](7.4e-20,1.190) node[anchor=-10,inner sep=2pt] {$\Sigma^0$};
      \part[barcol](2.6e-10,1.120) node[anchor=-100,inner sep=3.5pt] {$\Lambda$};
      \part[barcol](2.0e-13,2.290) node[anchor=-60,inner sep=3pt] {$\Lambda_\mathrm{c}$};
      \part[barcol](1.5e-12,5.620) node[anchor=-60,inner sep=3pt] {$\Lambda_\mathrm{b}$};

      % PARTICLES: MESONS
      % https://en.wikipedia.org/wiki/Meson#List
      % https://en.wikipedia.org/wiki/B_meson#List_of_B_mesons
      \part[mescol](8.4e-17,135e-3) node[anchor=-110,inner sep=3pt] {$\pi^0$};
      \part[mescol](4.5e-24,775e-3) node[anchor=70,inner sep=4pt] {$\unslant\rho$}; %^{\pm,0}
      \part[mescol](7.8e-23,783e-3) node[anchor=110,inner sep=4pt] {$\unslant\omega$};
      \part[mescol](5.0e-19,548e-3) node[anchor=70,inner sep=3pt] {$\unslant\eta$};
      \part[mescol](2.6e-8,140e-3) node[anchor=-160,inner sep=3pt] {$\unslant\pi^\pm$};
      \part[mescol](1.2e-8,494e-3) node[anchor=-100,inner sep=3.5pt] {K\contour{stablecol!7}{$^\pm$}};
      %\part[mescol](1.2e-8,494e-3) node[anchor=35,inner sep=1pt] {K$^\pm$};
      %\part[mescol](9.0e-11,498e-3) node[anchor=35,inner sep=2pt] {\contour{dispcol!3}{K$_\mathrm{S}^0$}};
      \part[mescol](9.0e-11,498e-3) node[anchor=95,inner sep=3pt] {\contour{dispcol!3}{K$_\mathrm{S}^0$}};
      \part[mescol](5.1e-8,498e-3) node[anchor=190,inner sep=3.5pt] {K$_\mathrm{L}^0$};
      \part[mescol](7.4e-20,892e-3) node[anchor=-165,inner sep=3pt] {K$^{*\pm}$};
      \part[mescol](7.1e-21,3.10) node[anchor=190,inner sep=4pt] {\PJpsi};
      \part[mescol](7.1e-21,9.46) node[anchor=200,inner sep=3pt] {$\Upsilon$};
      \part[mescol](1e-12,1.86)
        node[anchor=-175,inner sep=3pt] {\contour{dispcol!3}{D}}; %$^{\pm,0}$,\,D$^0$
      \part[mescol](1.6e-12,5.28)
        node[anchor=-170,inner sep=3pt] {B}; %$^{\pm,0}$,\,B$^0$

      % PARTICLES: LEPTONS
      % https://en.wikipedia.org/wiki/Particle_decay#Table_of_some_elementary_and_composite_particle_lifetimes
      % https://www.researchgate.net/figure/Conversion-of-21-particle-lifetimes-and-masses-to-US9_tbl1_282305954
      \part[lepcol](2.2e-6,105e-3) node[anchor=120,inner sep=3pt] {$\unslant\mu$};
      \part[lepcol](2.9e-13,1.777) node[anchor=60,inner sep=3pt] {$\unslant\tau$};
      \draw[<-,thick,lepcol] (\tmax,510e-6) --++ (-10pt,0pt)
        node[pos=0.8,lepcol!40!black,anchor=-50,inner sep=2pt] {e};

      % PARTICLES: BOSONS
      \part[boscol](1e-25,91.0); %node[above right=-1pt] {W$^\pm$};
      \part[boscol](1e-25,80.4) node[anchor=150,inner sep=3pt] {W$^\pm$,\,Z$^0$};
      \part[boscol](1.6e-22,125) node[above right=-1pt] {H$^0$};

    \end{scope}

    % MINOR X TICKS for every decade
    \pgfplotsinvokeforeach{-26,...,6}{
      \draw[myminortick] ({10^(#1)},{\mmin}) --++ (0pt,3.0pt);
    }

  \end{loglogaxis}
  \draw[red,mytick] % draw frame for pointed corners
    (current axis.south west) rectangle (current axis.north east);

  % TOP & RIGHT AXIS (pc/mc^2 vs. ctau)
  \begin{loglogaxis}[
    xmin=\ctmin, xmax=\ctmax,
    ymin=\mmax, ymax=\mmin, % reversed for 1/x!
    log basis x=10,
    log basis y=10,
    max space between ticks=32,
    xtick={1e-16,1e-12,1e-8,1e-4,1,1e4,1e8,1e12},
    %xtick={1e-15,1e-12,1e-9,1e-6,1e-3,1,1e3,1e6,1e9,1e12},
    xticklabel={% % format 10^0 as 1
      \pgfmathsetmacro\t{int(\tick)}\ifnum\t=0 $\hspace{3pt}1$ \else $\hspace{4pt}10^{\t}$ \fi%
    },
    yticklabel={% % format 10^0 as 1
      \pgfmathsetmacro\t{int(\tick)}\hspace{-1pt}\ifnum\t=0 $1$ \else $10^{\t}$ \fi%
    },
    xlabel={$c\tau$\:[m]},
    ylabel={$\gamma\beta/pc = 1/mc^2$\:[$1/\text{GeV}$]},
    xlabel style={above=-4pt},
    ylabel style={above=-14pt},
    ymajorticks=true,
    yminorticks=true,
    %scaled ticks=false,
    y coord trafo/.code={\pgfmathparse{\fpeval{1/(#1)}}}, % 1/x for tick position
    %y coord inv trafo/.code={\pgfmathparse{#1}\pgfmathresult}, % 1/x for tick labels
    y dir=reverse,
    axis x line*=top,
    axis y line*=right
  ]

    % MINOR X TICKS every decade
    \pgfplotsinvokeforeach{-18,...,16}{
      \draw[myminortick] ({10^(#1)},{\mmax}) --++ (0pt,-3.0pt);
    }

  \end{loglogaxis}

\end{tikzpicture}


% LOG-LOG: Mass (m) vs. lifetime (tau), zoomed-in
\begin{tikzpicture}
  \message{^^JLog-log plot: mass vs. lifetime}
  \def\mmin{5e-2} % minimum lifetime (tau)
  \def\mmax{8e2} % maximum lifetime (tau)
  \begin{loglogaxis}[
    xmin=\tmin, xmax=\tmax,
    ymin=\mmin, ymax=\mmax,
    log basis x=10,
    log basis y=10,
    yticklabel={% % format 10^0 as 1
      \pgfmathsetmacro\t{int(\tick)} \ifnum\t=0 $1$ \else $10^{\t}$ \fi%
    },
    %ytick={0.0001,0.001,0.01,0.1,1,10,100,1000},
    max space between ticks=25,
    yminorticks=true,
    %xminorticks=true,
    xlabel={Proper lifetime $\tau$\:[s]},
    ylabel={Particle mass $m$\:[$\text{GeV}/c^2$]},
    xlabel style={below=-3pt},
    ylabel style={above=-7pt},
    yticklabel style={left=-1pt},
    axis x line*=bottom,
    axis y line*=left,
    axis line on top, % redraw axis on top/in front
  ]

    % BANDS
    \pgfmathsetmacro\tprompt{\fpeval{\xprompt/3e8}} % prompt decay in detector (tau = 1e-6/3e8)
    \pgfmathsetmacro\tdisp{  \fpeval{\xdisp/3e8}}   % displaced vertex (tau = 1e-3/3e8)
    \pgfmathsetmacro\tstable{\fpeval{\xstable/3e8}} % stable in detector (tau = 10/3e-8)
    \fill[dispcol!3] (\tstable,\mmin) rectangle (\tprompt,\mmax);
    \fill[promptcol!7] (\tmin,\mmin) rectangle (3*\tprompt,\mmax);
    \fill[stablecol!7] (0.33*\tstable,\mmin) rectangle (\tmax,\mmax);
    \draw[densely dashed,promptcol!60] (\tprompt,\mmin) -- (\tprompt,\mmax)
      node[pos=0.83,rotate=90,above left=-0.5pt,scale=0.6] {$c\tau = \SI{1}{\micro m}$};
    \draw[densely dashed,dispcol!60] (\tdisp,\mmin) -- (\tdisp,\mmax)
      node[pos=0.83,rotate=90,above left=-0.5pt,scale=0.6] {$c\tau = \SI{1}{mm}$};
    \draw[densely dashed,stablecol!60] (\tstable,\mmin) -- (\tstable,\mmax)
      node[pos=0.83,rotate=90,below left=-0.5pt,scale=0.6] {$c\tau = \SI{10}{m}$};
    \node[below=3,scale=0.7,promptcol] at ({\tmin*10^(log10(\tprompt/\tmin)/2)},\mmax)
      {Detector-prompt};
    \node[below=3,scale=0.7,promptcol,align=center] at ({\tprompt*10^(log10(\tstable/\tprompt)/2)},\mmax)
      {\contour{dispcol!3}{Displaced}\\[-2pt]\contour{dispcol!3}{vertex}};
    \node[below=3,scale=0.7,stablecol] at ({\tstable*10^(log10(\tmax/\tstable)/2)},\mmax)
      {Detector-stable};

    \begin{scope}[every node/.style={scale=0.84}]

      % PARTICLES: QUARKS
      \part[mescol!50!cyan](5e-25,173) node[above=0pt] {t};

      % PARTICLES: BARYONS
      % https://en.wikipedia.org/wiki/List_of_baryons#JP_=_1/2+_baryons
      % https://en.wikipedia.org/wiki/Lambda_baryon#Types_of_lambda_baryons
      \part[barcol](879,940e-3) node[anchor=-40,inner sep=1.6pt] {n$^0$};
      \draw[<-,thick,barcol] (\tmax,938e-3) --++ (-10pt,0pt)
        node[pos=0.85,barcol!40!black,anchor=-90,inner sep=1pt] {p$^\pm$};
      %\part[barcol](8.0e-11,1.190) node[anchor=-105,inner sep=3.5pt] {$\Sigma^+$};
      \part[barcol](7.4e-20,1.190) node[anchor=-10,inner sep=2pt] {$\Sigma^0$};
      \part[barcol](2.6e-10,1.120) node[anchor=-100,inner sep=3.5pt] {$\Lambda$};
      \part[barcol](2.0e-13,2.290) node[anchor=-60,inner sep=3pt] {$\Lambda_\mathrm{c}$};
      \part[barcol](1.5e-12,5.620) node[anchor=-60,inner sep=3pt] {$\Lambda_\mathrm{b}$};

      % PARTICLES: MESONS
      % https://en.wikipedia.org/wiki/Meson#List
      % https://en.wikipedia.org/wiki/B_meson#List_of_B_mesons
      \part[mescol](8.4e-17,135e-3) node[anchor=-110,inner sep=3pt] {$\pi^0$};
      \part[mescol](4.5e-24,775e-3) node[anchor=70,inner sep=4pt] {$\unslant\rho$}; %^{\pm,0}
      \part[mescol](7.8e-23,783e-3) node[anchor=110,inner sep=4pt] {$\unslant\omega$};
      \part[mescol](5.0e-19,548e-3) node[anchor=70,inner sep=3pt] {$\unslant\eta$};
      \part[mescol](2.6e-8,140e-3) node[anchor=-160,inner sep=3pt] {$\unslant\pi^\pm$};
      \part[mescol](1.2e-8,494e-3) node[anchor=-100,inner sep=3.5pt] {K\contour{stablecol!7}{$^\pm$}};
      %\part[mescol](1.2e-8,494e-3) node[anchor=35,inner sep=1pt] {K$^\pm$};
      %\part[mescol](9.0e-11,498e-3) node[anchor=35,inner sep=2pt] {\contour{dispcol!3}{K$_\mathrm{S}^0$}};
      \part[mescol](9.0e-11,498e-3) node[anchor=95,inner sep=3pt] {\contour{dispcol!3}{K$_\mathrm{S}^0$}};
      \part[mescol](5.1e-8,498e-3) node[anchor=190,inner sep=3.5pt] {K$_\mathrm{L}^0$};
      \part[mescol](7.4e-20,892e-3) node[anchor=-165,inner sep=3pt] {K$^{*\pm}$};
      \part[mescol](7.1e-21,3.10) node[anchor=190,inner sep=4pt] {\PJpsi};
      \part[mescol](7.1e-21,9.46) node[anchor=200,inner sep=3pt] {$\Upsilon$};
      \part[mescol](1e-12,1.86)
        node[anchor=-175,inner sep=3pt] {\contour{dispcol!3}{D}}; %$^{\pm,0}$,\,D$^0$
      \part[mescol](1.6e-12,5.28)
        node[anchor=-170,inner sep=3pt] {B}; %$^{\pm,0}$,\,B$^0$

      % PARTICLES: LEPTONS
      % https://en.wikipedia.org/wiki/Particle_decay#Table_of_some_elementary_and_composite_particle_lifetimes
      % https://www.researchgate.net/figure/Conversion-of-21-particle-lifetimes-and-masses-to-US9_tbl1_282305954
      \part[lepcol](2.2e-6,105e-3) node[anchor=165,inner sep=3pt] {$\unslant\mu$};
      \part[lepcol](2.9e-13,1.777) node[anchor=60,inner sep=3pt] {$\unslant\tau$};
      \draw[<-,thick,lepcol] (\tmax,\mmin) --++ (140:10pt)
        node[pos=0.8,lepcol!40!black,anchor=-40,inner sep=2pt] {e};

      % PARTICLES: BOSONS
      \part[boscol](1e-25,91.0); %node[above right=-1pt] {W$^\pm$};
      \part[boscol](1e-25,80.4) node[anchor=150,inner sep=3pt] {W$^\pm$,\,Z$^0$};
      \part[boscol](1.6e-22,125) node[above right=-1pt] {H$^0$};

    \end{scope}

    % MINOR X TICKS for every decade
    \pgfplotsinvokeforeach{-26,...,6}{
      \draw[myminortick] ({10^(#1)},{\mmin}) --++ (0pt,3.0pt);
    }

  \end{loglogaxis}
  \draw[red,mytick] % draw frame for pointed corners
    (current axis.south west) rectangle (current axis.north east);

  % TOP & RIGHT AXIS (pc/mc^2 vs. ctau)
  \begin{loglogaxis}[
    xmin=\ctmin, xmax=\ctmax,
    ymin=\mmax, ymax=\mmin, % reversed for 1/x!
    log basis x=10,
    log basis y=10,
    max space between ticks=32,
    xtick={1e-16,1e-12,1e-8,1e-4,1,1e4,1e8,1e12},
    %xtick={1e-15,1e-12,1e-9,1e-6,1e-3,1,1e3,1e6,1e9,1e12},
    xticklabel={% % format 10^0 as 1
      \pgfmathsetmacro\t{int(\tick)}\ifnum\t=0 $\hspace{3pt}1$ \else $\hspace{4pt}10^{\t}$ \fi%
    },
    yticklabel={% % format 10^0 as 1
      \pgfmathsetmacro\t{int(\tick)}\hspace{-1pt}\ifnum\t=0 $1$ \else $10^{\t}$ \fi%
    },
    xlabel={$c\tau$\:[m]},
    ylabel={$\gamma\beta/pc = 1/mc^2$\:[$1/\text{GeV}$]},
    xlabel style={above=-4pt},
    ylabel style={above=-14pt},
    ymajorticks=true,
    yminorticks=true,
    %scaled ticks=false,
    y coord trafo/.code={\pgfmathparse{\fpeval{1/(#1)}}}, % 1/x for tick position
    %y coord inv trafo/.code={\pgfmathparse{#1}\pgfmathresult}, % 1/x for tick labels
    y dir=reverse,
    axis x line*=top,
    axis y line*=right
  ]

    % MINOR X TICKS every decade
    \pgfplotsinvokeforeach{-18,...,16}{
      \draw[myminortick] ({10^(#1)},{\mmax}) --++ (0pt,-3.0pt);
    }

  \end{loglogaxis}

\end{tikzpicture}


% LOG-LOG: Mass (m) vs. average decay length (L)
\pgfplotsinvokeforeach{10,20,50,100}{
%\pgfplotsinvokeforeach{1,...,50}{ % for animation
\edef\pc{#1}
\begin{tikzpicture}
  \message{^^JLog-log plot mass vs. decay length for pc=\pc}
  \begin{loglogaxis}[
    xmin=\Lmin, xmax=\Lmax,
    ymin=\mmin, ymax=\mmax,
    log basis x=10,
    log basis y=10,
    %xtick={1e-16,1e-12,1e-8,1e-4,1,1e4,1e8,1e12},
    xticklabel={% % format 10^0 as 1
      \pgfmathsetmacro\t{int(\tick)}\ifnum\t=0 $1$ \else $\hspace{3pt}10^{\t}$ \fi%
    },
    yticklabel={% % format 10^0 as 1
      \pgfmathsetmacro\t{int(\tick)} \ifnum\t=0 $1$ \else $10^{\t}$ \fi%
    },
    %ytick={0.0001,0.001,0.01,0.1,1,10,100,1000},
    max space between ticks=25,
    yminorticks=true,
    %xminorticks=true,
    xlabel={Decay length $L=\gamma\beta c\tau$ ($pc=\pc\,\text{GeV}$)\:[m]},
    ylabel={Particle mass $m$\:[$\text{GeV}/c^2$]},
    xlabel style={below=-3pt},
    ylabel style={above=-7pt},
    yticklabel style={left=-1pt},
    axis y line*=left,
    axis line on top % redraw axis on top/in front
  ]

    % BANDS
    \fill[dispcol!3] (\xstable,\mmin) rectangle (\xprompt,\mmax);
    \fill[promptcol!7] (\Lmin,\mmin) rectangle (3*\xprompt,\mmax);
    \fill[stablecol!7] (0.33*\xstable,\mmin) rectangle (\Lmax,\mmax);
    \draw[densely dashed,promptcol!60] (\xprompt,\mmin) -- (\xprompt,\mmax)
      node[pos=0.05,rotate=90,above right=-0.5pt,scale=0.6] {$L = \SI{1}{\micro m}$};
    \draw[densely dashed,dispcol!60] (\xdisp,\mmin) -- (\xdisp,\mmax)
      node[pos=0.05,rotate=90,above right=-0.5pt,scale=0.6] {$L = \SI{1}{mm}$};
    \draw[densely dashed,stablecol!60] (\xstable,\mmin) -- (\xstable,\mmax)
      node[pos=0.05,rotate=90,below right=-0.5pt,scale=0.6] {$L = \SI{10}{m}$};
    \node[below=3,scale=0.7,promptcol] at ({\Lmin*10^(log10(\xprompt/\Lmin)/2)},\mmax)
      {Detector-prompt};
    \node[below=3,scale=0.7,promptcol,align=center] at ({\xprompt*10^(log10(\xstable/\xprompt)/2)},\mmax)
      {\contour{dispcol!3}{Displaced}\\[-2pt]\contour{dispcol!3}{vertex}};
    \node[below=3,scale=0.7,stablecol] at ({\xstable*10^(log10(\Lmax/\xstable)/2)},\mmax)
      {Detector-stable};

    \begin{scope}[every node/.style={scale=0.84}]

      % PARTICLES: QUARKS
      \partDL[mescol!50!cyan](5e-25,173) node[above=0pt] {t};

      % PARTICLES: BARYONS
      % https://en.wikipedia.org/wiki/List_of_baryons#JP_=_1/2+_baryons
      % https://en.wikipedia.org/wiki/Lambda_baryon#Types_of_lambda_baryons
      \partDL[barcol](879,940e-3) node[anchor=-40,inner sep=1.6pt] {n$^0$};
      \draw[<-,thick,barcol] (\Lmax,938e-3) --++ (-10pt,0pt)
        node[pos=0.85,barcol!40!black,anchor=-90,inner sep=1pt] {p$^\pm$};
      %\partDL[barcol](8.0e-11,1.190) node[anchor=-105,inner sep=3.5pt] {$\Sigma^+$};
      \partDL[barcol](7.4e-20,1.190) node[anchor=-10,inner sep=2pt] {$\Sigma^0$};
      \partDL[barcol](2.6e-10,1.120) node[anchor=-100,inner sep=3.5pt] {$\Lambda$};
      \partDL[barcol](2.0e-13,2.290) node[anchor=-60,inner sep=3pt] {$\Lambda_\mathrm{c}$};
      \partDL[barcol](1.5e-12,5.620) node[anchor=-60,inner sep=3pt] {$\Lambda_\mathrm{b}$};

      % PARTICLES: MESONS
      % https://en.wikipedia.org/wiki/Meson#List
      % https://en.wikipedia.org/wiki/B_meson#List_of_B_mesons
      \partDL[mescol](8.4e-17,135e-3) node[anchor=-110,inner sep=3pt] {$\pi^0$};
      \partDL[mescol](4.5e-24,775e-3) node[anchor=70,inner sep=4pt] {$\unslant\rho$}; %^{\pm,0}
      \partDL[mescol](7.8e-23,783e-3) node[anchor=110,inner sep=4pt] {$\unslant\omega$};
      \partDL[mescol](5.0e-19,548e-3) node[anchor=70,inner sep=3pt] {$\unslant\eta$};
      \partDL[mescol](2.6e-8,140e-3) node[anchor=-160,inner sep=3pt] {$\unslant\pi^\pm$};
      \partDL[mescol](1.2e-8,494e-3) node[anchor=-100,inner sep=3.5pt] {K\contour{stablecol!7}{$^\pm$}};
      %\partDL[mescol](1.2e-8,494e-3) node[anchor=35,inner sep=1pt] {K$^\pm$};
      %\partDL[mescol](9.0e-11,498e-3) node[anchor=35,inner sep=2pt] {\contour{dispcol!3}{K$_\mathrm{S}^0$}};
      \partDL[mescol](9.0e-11,498e-3) node[anchor=95,inner sep=3pt] {\contour{dispcol!3}{K$_\mathrm{S}^0$}};
      \partDL[mescol](5.1e-8,498e-3) node[anchor=190,inner sep=3.5pt] {K$_\mathrm{L}^0$};
      \partDL[mescol](7.4e-20,892e-3) node[anchor=-165,inner sep=3pt] {K$^{*\pm}$};
      \partDL[mescol](7.1e-21,3.10) node[anchor=190,inner sep=4pt] {\PJpsi};
      \partDL[mescol](7.1e-21,9.46) node[anchor=200,inner sep=3pt] {$\Upsilon$};
      \partDL[mescol](1e-12,1.86)
        node[anchor=-175,inner sep=3pt] {\contour{dispcol!3}{D}}; %$^{\pm,0}$,\,D$^0$
      \partDL[mescol](1.6e-12,5.28)
        node[anchor=-170,inner sep=3pt] {B}; %$^{\pm,0}$,\,B$^0$

      % PARTICLES: LEPTONS
      % https://en.wikipedia.org/wiki/Particle_decay#Table_of_some_elementary_and_composite_particle_lifetimes
      % https://www.researchgate.net/figure/Conversion-of-21-particle-lifetimes-and-masses-to-US9_tbl1_282305954
      \partDL[lepcol](2.2e-6,105e-3) node[anchor=120,inner sep=3pt] {$\unslant\mu$};
      \partDL[lepcol](2.9e-13,1.777) node[anchor=60,inner sep=3pt] {$\unslant\tau$};
      \draw[<-,thick,lepcol] (\Lmax,510e-6) --++ (-10pt,0pt)
        node[pos=0.8,lepcol!40!black,anchor=-50,inner sep=2pt] {e};

      % PARTICLES: BOSONS
      \partDL[boscol](1e-25,91.0); %node[above right=-1pt] {W$^\pm$};
      \partDL[boscol](1e-25,80.4) node[anchor=150,inner sep=3pt] {W$^\pm$,\,Z$^0$};
      \partDL[boscol](1.6e-22,125) node[above right=-1pt] {H$^0$};

    \end{scope}

    % MINOR X TICKS for every decade
    \pgfplotsinvokeforeach{-18,...,18}{
      \draw[myminortick] ({10^(##1)},{\mmin}) --++ (0pt,3.0pt);
      \draw[myminortick] ({10^(##1)},{\mmax}) --++ (0pt,-3.0pt);
    }

  \end{loglogaxis}
  \draw[red,mytick] % draw frame for pointed corners
    (current axis.south west) rectangle (current axis.north east);

  % TOP & RIGHT AXIS (pc/mc^2 vs. ctau)
  \begin{loglogaxis}[
    xmin=\Lmin, xmax=\Lmax,
    ymin=\mmax, ymax=\mmin, % reversed for 1/x!
    log basis y=10,
    axis line style={mytick},
    x axis line style={draw=none},
    x tick style={draw=none},
    max space between ticks=32,
    xticklabel=\empty,
    yticklabel={% % format 10^0 as 1
      \pgfmathsetmacro\t{int(\tick)}\hspace{-1pt}\ifnum\t=0 $1$ \else $10^{\t}$ \fi%
    },
    ylabel={$\gamma\beta = \pc\,\text{GeV}/mc^2$},
    ylabel style={above=-14pt},
    xtick=false,
    ymajorticks=true,
    yminorticks=true,
    y coord trafo/.code={\pgfmathparse{\fpeval{\pc/(##1)}}}, % 1/x for tick position
    %y coord inv trafo/.code={\pgfmathparse{#1}\pgfmathresult}, % 1/x for tick labels
    y dir=reverse,
    axis y line*=right
  ]
  \end{loglogaxis}
  \clip (-0.5cm,-0.5cm) rectangle++ (8cm,5.6cm); % to ensure unifrom height

\end{tikzpicture}} % end \pgfplotsinvokeforeach


% LOG-LOG: Mass (m) vs. average decay length (L)
\def\pcmin{1}
\def\pcmax{50}
\begin{tikzpicture}
  \message{^^JLog-log plot mass vs. decay length for pcmin=\pcmin, pcmax=\pcmax}
  \begin{loglogaxis}[
    xmin=\Lmin, xmax=\Lmax,
    ymin=\mmin, ymax=\mmax,
    log basis x=10,
    log basis y=10,
    xticklabel={% % format 10^0 as 1
      \pgfmathsetmacro\t{int(\tick)}\ifnum\t=0 $1$ \else $\hspace{3pt}10^{\t}$ \fi%
    },
    yticklabel={% % format 10^0 as 1
      \pgfmathsetmacro\t{int(\tick)} \ifnum \t = 0 $1$ \else $10^{\t}$ \fi%
    },
    %ytick={0.0001,0.001,0.01,0.1,1,10,100,1000},
    max space between ticks=25,
    yminorticks=true,
    %xminorticks=true,
    xlabel={Decay length $L=\gamma\beta c\tau$ ($pc=\pcmin$--$\pcmax\,\text{GeV}$)\:[m]},
    ylabel={Particle mass $m$\:[$\text{GeV}/c^2$]},
    xlabel style={below=-3pt},
    ylabel style={above=-7pt},
    yticklabel style={left=-1pt},
    axis y line*=left,
    axis line on top % redraw axis on top/in front
  ]

    % BANDS
    \fill[dispcol!3] (\xstable,\mmin) rectangle (\xprompt,\mmax);
    \fill[promptcol!7] (\Lmin,\mmin) rectangle (3*\xprompt,\mmax);
    \fill[stablecol!7] (0.33*\xstable,\mmin) rectangle (\Lmax,\mmax);
    \draw[densely dashed,promptcol!60] (\xprompt,\mmin) -- (\xprompt,\mmax)
      node[pos=0.05,rotate=90,above right=-0.5pt,scale=0.6] {$L = \SI{1}{\micro m}$};
    \draw[densely dashed,dispcol!60] (\xdisp,\mmin) -- (\xdisp,\mmax)
      node[pos=0.05,rotate=90,above right=-0.5pt,scale=0.6] {$L = \SI{1}{mm}$};
    \draw[densely dashed,stablecol!60] (\xstable,\mmin) -- (\xstable,\mmax)
      node[pos=0.05,rotate=90,below right=-0.5pt,scale=0.6] {$L = \SI{10}{m}$};
    \node[below=3,scale=0.7,promptcol] at ({\Lmin*10^(log10(\xprompt/\Lmin)/2)},\mmax)
      {Detector-prompt};
    \node[below=3,scale=0.7,promptcol,align=center] at ({\xprompt*10^(log10(\xstable/\xprompt)/2)},\mmax)
      {\contour{dispcol!3}{Displaced}\\[-2pt]\contour{dispcol!3}{vertex}};
    \node[below=3,scale=0.7,stablecol] at ({\xstable*10^(log10(\Lmax/\xstable)/2)},\mmax)
      {Detector-stable};

    \begin{scope}[every node/.style={scale=0.84}]

      % PARTICLES: QUARKS
      \partlineDL[mescol!50!cyan](5e-25,173) node[above=0pt] {t};

      % PARTICLES: BARYONS
      % https://en.wikipedia.org/wiki/List_of_baryons#JP_=_1/2+_baryons
      % https://en.wikipedia.org/wiki/Lambda_baryon#Types_of_lambda_baryons
      \partlineDL[barcol](879,940e-3) node[anchor=-40,inner sep=1.6pt] {n$^0$};
      \draw[<-,thick,barcol] (\Lmax,938e-3) --++ (-10pt,0pt)
        node[pos=0.85,barcol!40!black,anchor=-90,inner sep=1pt] {p$^\pm$};
      %\partlineDL[barcol](8.0e-11,1.190) node[anchor=-105,inner sep=3.5pt] {$\Sigma^+$};
      %\partlineDL[barcol](7.4e-20,1.190) node[anchor=-10,inner sep=2pt] {$\Sigma^0$};
      \partlineDL[barcol](2.6e-10,1.120)
        node[anchor=-140,inner sep=2.5pt] {\contour{stablecol!7}{$\Lambda$}};
      %\partlineDL[barcol](2.0e-13,2.290) node[anchor=-60,inner sep=3pt] {$\Lambda_\mathrm{c}$};
      %\partlineDL[barcol](1.5e-12,5.620) node[anchor=-60,inner sep=3pt] {$\Lambda_\mathrm{b}$};

      % PARTICLES: MESONS
      % https://en.wikipedia.org/wiki/Meson#List
      % https://en.wikipedia.org/wiki/B_meson#List_of_B_mesons
      \partlineDL[mescol](8.4e-17,135e-3) node[anchor=-125,inner sep=2.5pt] {$\pi^0$};
      \partlineDL[mescol](7.8e-23,783e-3) node[anchor=-160,inner sep=3pt] {$\unslant\omega$};
      \partlineDL[mescol](4.5e-24,775e-3) node[anchor=80,inner sep=4pt] {$\unslant\rho$}; %^{\pm,0}
      \partlineDL[mescol](5.0e-19,548e-3) node[anchor=-140,inner sep=1.5pt] {$\unslant\eta$};
      \partlineDL[mescol](2.6e-8,140e-3) node[anchor=-140,inner sep=2pt] {$\unslant\pi^\pm$};
      \partlineDL[mescol](1.2e-8,494e-3) node[anchor=-156,inner sep=3pt] {K$^\pm$};
      %\partlineDL[mescol](1.2e-8,494e-3) node[anchor=35,inner sep=1pt] {K$^\pm$};
      %\partlineDL[mescol](9.0e-11,498e-3) node[anchor=35,inner sep=2pt] {\contour{dispcol!3}{K$_\mathrm{S}^0$}};
      %\partlineDL[mescol](9.0e-11,498e-3) node[anchor=95,inner sep=3pt] {\contour{dispcol!3}{K$_\mathrm{S}^0$}};
      %\partlineDL[mescol](5.1e-8,498e-3) node[anchor=190,inner sep=3.5pt] {K$_\mathrm{L}^0$};
      %\partlineDL[mescol](7.4e-20,892e-3) node[anchor=-165,inner sep=3pt] {K$^{*\pm}$};
      \partlineDL[mescol](7.1e-21,3.10) node[anchor=180,inner sep=3pt] {\PJpsi};
      \partlineDL[mescol](7.1e-21,9.46) node[anchor=200,inner sep=2.5pt] {$\Upsilon$};
      \partlineDL[mescol](1e-12,1.86)
        node[anchor=-160,inner sep=3pt] {\contour{dispcol!3}{D}}; %$^{\pm,0}$,\,D$^0$
      \partlineDL[mescol](1.6e-12,5.28)
        node[anchor=-160,inner sep=3pt] {B}; %$^{\pm,0}$,\,B$^0$

      % PARTICLES: LEPTONS
      % https://en.wikipedia.org/wiki/Particle_decay#Table_of_some_elementary_and_composite_particle_lifetimes
      % https://www.researchgate.net/figure/Conversion-of-21-particle-lifetimes-and-masses-to-US9_tbl1_282305954
      \partlineDL[lepcol](2.2e-6,105e-3) node[anchor=165,inner sep=3pt] {$\unslant\mu$};
      \partlineDL[lepcol](2.9e-13,1.777) node[anchor=110,inner sep=2.6pt] {$\unslant\tau$};
      \draw[<-,thick,lepcol] (\Lmax,510e-6) --++ (-10pt,0pt)
        node[pos=0.8,lepcol!40!black,anchor=-50,inner sep=2pt] {e};

      % PARTICLES: BOSONS
      \partlineDL[boscol](1e-25,91.0) node[anchor=166,inner sep=3pt] {Z$^0$};
      \partlineDL[boscol](1e-25,80.4) node[anchor=50,inner sep=3pt] {W$^\pm$}; %,\,Z$^0$
      \partlineDL[boscol](1.6e-22,125) node[above right=-1pt] {H$^0$};

    \end{scope}

    % MINOR X TICKS for every decade
    \pgfplotsinvokeforeach{-18,...,18}{
      \draw[myminortick] ({10^(#1)},{\mmin}) --++ (0pt,3.0pt);
      \draw[myminortick] ({10^(#1)},{\mmax}) --++ (0pt,-3.0pt);
    }

  \end{loglogaxis}
  \draw[red,mytick] % draw frame for pointed corners
    (current axis.south west) rectangle (current axis.north east);

  % TOP & RIGHT AXIS (pc/mc^2 vs. ctau)
  \begin{loglogaxis}[
    xmin=\Lmin, xmax=\Lmax,
    ymin=\mmax, ymax=\mmin, % reversed for 1/x!
    log basis y=10,
    axis line style={mytick},
    x axis line style={draw=none},
    x tick style={draw=none},
    max space between ticks=32,
    xticklabel=\empty,
    yticklabel={% % format 10^0 as 1
      \pgfmathsetmacro\t{int(\tick)}\hspace{-1pt}\ifnum\t=0 $1$ \else $10^{\t}$ \fi%
    },
    ylabel={$\gamma\beta = \pcmax\,\text{GeV}/mc^2$},
    ylabel style={above=-14pt},
    xtick=false,
    ymajorticks=true,
    yminorticks=true,
    y coord trafo/.code={\pgfmathparse{\fpeval{\pcmax/(#1)}}}, % 1/x for tick position
    y dir=reverse,
    axis y line*=right
  ]
  \end{loglogaxis}

\end{tikzpicture}


\end{document}
Click to download: SM_particles_masses.tex • SM_particles_masses.pdf
Open in Overleaf: SM_particles_masses.tex


