")


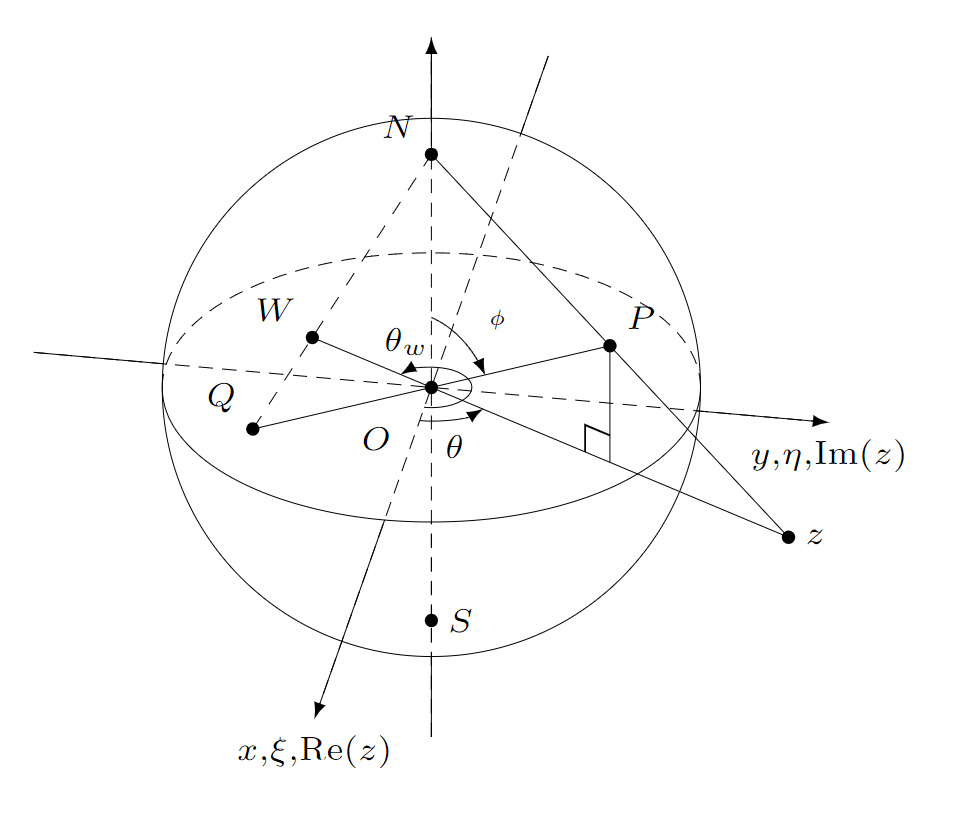
The stereographic projection of two antipodal points:
\documentclass[
    tikz
    ,border = 3.14mm
]{standalone}
\usepackage{tikz-3dplot}
\usetikzlibrary{
    arrows.meta
    ,angles
}
\pgfmathdeclarefunction{sphereX}{2}{%
    % #1  - longitude
    % #1  - latitude
    \pgfmathparse{cos(#2) * cos(#1)}%
}
\pgfmathdeclarefunction{sphereY}{2}{%
    \pgfmathparse{cos(#2) * sin(#1)}%
}
\pgfmathdeclarefunction{sphereZ}{2}{%
    \pgfmathparse{sin(#2)}%
}
\pgfmathdeclarefunction{stereographicprojection}{2}{%
    \pgfmathparse{#1 / (1 - #2)}%
}
\pgfmathsetmacro{\azimuth}{100}
\pgfmathsetmacro{\elevation}{30}
\pgfmathsetmacro{\longitude}{60}
\pgfmathsetmacro{\latitude}{30}
\begin{document}
    \pgfmathsetmacro{\scale}{2}
    \tdplotsetmaincoords{90-\elevation}{\azimuth}
    \begin{tikzpicture}[tdplot_main_coords,very thin]
        % x, y and z axes (pre-clip)
        \draw[-latex]
            (-2.5*\scale,0,0) -- (2.5*\scale,0,0)
            node[pos=1,below]
            {$\scriptstyle x,\xi,\mbox{\scriptsize Re}(z)$};
        \draw[-latex]
            (0,-1.5*\scale,0) -- (0,1.5*\scale,0);
        \draw[-latex]
            (0,0,-1.5*\scale) -- (0,0,1.5*\scale);
        \begin{scope}
            % clip and blank out sphere
            \clip[
                tdplot_screen_coords
                ,postaction = {
                    %tdplot_screen_coords
                    ,fill
                    ,white
                }
            ] (0,0) circle [radius = {1*\scale}];
            % x, y and z axes (post-clip)
            \draw[densely dashed]
                (-2.5*\scale,0,0) -- (1*\scale,0,0);
            \draw[densely dashed]
                (0,-1.5*\scale,0) -- (0,1*\scale,0);
            \draw[densely dashed]
                (0,0,-1.5*\scale) -- (0,0,1*\scale);
            % outer circle
            \draw[tdplot_screen_coords]
                (0,0) circle [radius = {1*\scale}];
            \draw[densely dashed]
                (\azimuth:1*\scale) arc [
                    start angle = {\azimuth}
                    ,end angle = {\azimuth+180}
                    ,radius = {1*\scale}
                ];
            \draw (\azimuth:1*\scale) arc [
                    start angle = {\azimuth}
                    ,end angle = {\azimuth-180}
                    ,radius = {1*\scale}
                ];
                % origin
                \coordinate (O) at (0,0);
                % point on sphere
                \coordinate (P) at
                    (
                        {sphereX(\longitude,\latitude)*\scale}
                        ,{sphereY(\longitude,\latitude)*\scale}
                        ,{sphereZ(\longitude,\latitude)*\scale}
                    );
                % stereographic projection
                % of point on sphere
                \coordinate (P') at
                    (
                        {
                            stereographicprojection(
                            sphereX(\longitude,\latitude)
                            ,sphereZ(\longitude,\latitude)
                            )*\scale
                        }
                        ,{
                            stereographicprojection(
                            sphereY(\longitude,\latitude)
                            ,sphereZ(\longitude,\latitude)
                            )*\scale
                        }
                        ,{0}
                    );
                % north pole
                \coordinate (N) at (0,0,1*\scale);
                % south pole
                \coordinate (S) at (0,0,-1*\scale);
                % point opposite from P
                \coordinate (Q) at
                    (
                        {-sphereX(\longitude,\latitude)*\scale}
                        ,{-sphereY(\longitude,\latitude)*\scale}
                        ,{-sphereZ(\longitude,\latitude)*\scale}
                    );
                % stereographic projection of
                % point opposite from P
                \coordinate (Q') at
                    (
                        {
                            stereographicprojection(
                            -sphereX(\longitude,\latitude)
                            ,-sphereZ(\longitude,\latitude)
                            )*\scale
                        }
                        ,{
                            stereographicprojection(
                            -sphereY(\longitude,\latitude)
                            ,-sphereZ(\longitude,\latitude)
                            )*\scale
                        }
                        ,{0}
                    );
                % orthogonal projection of
                % P onto the xy plane
                \coordinate (projP) at
                    (
                        {sphereX(\longitude,\latitude)*\scale}
                        ,{sphereY(\longitude,\latitude)*\scale}
                        ,{0}
                    );
                % constructions which don't exceed the clip
                \draw
                    (P) -- (Q)
                    (N) -- (0,0,1.5*\scale)
                    (1*\scale,0,0) -- (2.5*\scale,0,0)
                    (0,1*\scale,0) -- (0,1.5*\scale,0)
                    (P) -- (projP)
                    ;
                \draw[densely dashed]
                    (N) -- (Q);
        \end{scope}
        % constructions which exceed the clip
        \draw
            (N) -- (P')
            (Q') -- (P')
            ;
        % points
        \pgfmathsetmacro{\pointradius}{0.025*\scale}
        \begin{scope}[tdplot_screen_coords]
            \fill
                (O) circle[radius = \pointradius]
                node[below left=5pt]{$\scriptstyle O$};
            \fill
                (P) circle[radius = \pointradius]
                node[above right]{$\scriptstyle P$};
            \fill
                (P') circle[radius = \pointradius]
                node[right]{$\scriptstyle z$};
            \fill
                (N) circle[radius = \pointradius]
                node[above left]{$\scriptstyle N$};
            \fill
                (S) circle[radius = \pointradius]
                node[right]{$\scriptstyle S$};
            \fill
                (Q) circle[radius = \pointradius]
                node[above left]{$\scriptstyle Q$};
            \fill
                (Q') circle[radius = \pointradius]
                node[above left]{$\scriptstyle W$};
        \end{scope}
        % angles
        \draw[-latex]
            (0.25*\scale,0) arc [
                start angle = {0}
                ,end angle = {\longitude}
                ,radius = {0.25*\scale}
            ]
            node [
                pos = {0.5}
                ,below
            ] {$\scriptstyle\theta$};
        \draw[-latex]
            (0.15*\scale,0) arc [
                start angle = {0}
                ,end angle = {\longitude + 180}
                ,radius = {0.15*\scale}
            ] node [
                pos = 0.95
                ,above
            ]{$\scriptstyle\theta_{w}$};
        \draw[
            smooth
            ,domain = {90:\latitude}
            ,variable = {\latitude}
            ,-latex
        ] plot (
             {0.3*sphereX(\longitude,\latitude)*\scale}
             ,{0.3*sphereY(\longitude,\latitude)*\scale}
             ,{0.3*sphereZ(\longitude,\latitude)*\scale}
        ) node [
            pos = {0}
            ,above right = {5pt}
        ]{$\scriptstyle\phi$};
            \draw pic [
                draw
                ,-
                ,angle eccentricity = {1.4}
                ,angle radius = {0.2cm}
            ]{right angle=O--projP--P};
    \end{tikzpicture}
\end{document}