")


Thermodynamic functions, like resistance, isochores and isotherms.
For more figures related to thermodynamics, see the “thermodynamics” category.


Edit and compile if you like:
\documentclass[border=3pt,tikz]{standalone}
\usepackage{amsmath,amssymb}
\usepackage{tikz}
\tikzset{>=latex}
\colorlet{myblue}{black!50!blue}
\colorlet{mygreen}{black!50!green}
\colorlet{myred}{black!50!red}
\begin{document}
% RESISTANCE vs. TEMPERATURE
\begin{tikzpicture}
\def\N{20}
\def\xmin{-0.1} \def\xmax{1.6}
\def\ymin{-0.1} \def\ymax{1.6}
\draw[->,thick]
(\xmin,0) -- (1.1*\xmax,0) node[right] {$T$};
\draw[->,thick]
(0,\ymin) -- (0,1.1*\ymax) node[above=5pt,below left,align=center] {$R$\\ or $\rho$};
\draw[thick,myblue,variable=\x,domain=0:\xmax,samples=\N,smooth]
plot (\x,0.3+\x*\x/2);
\end{tikzpicture}
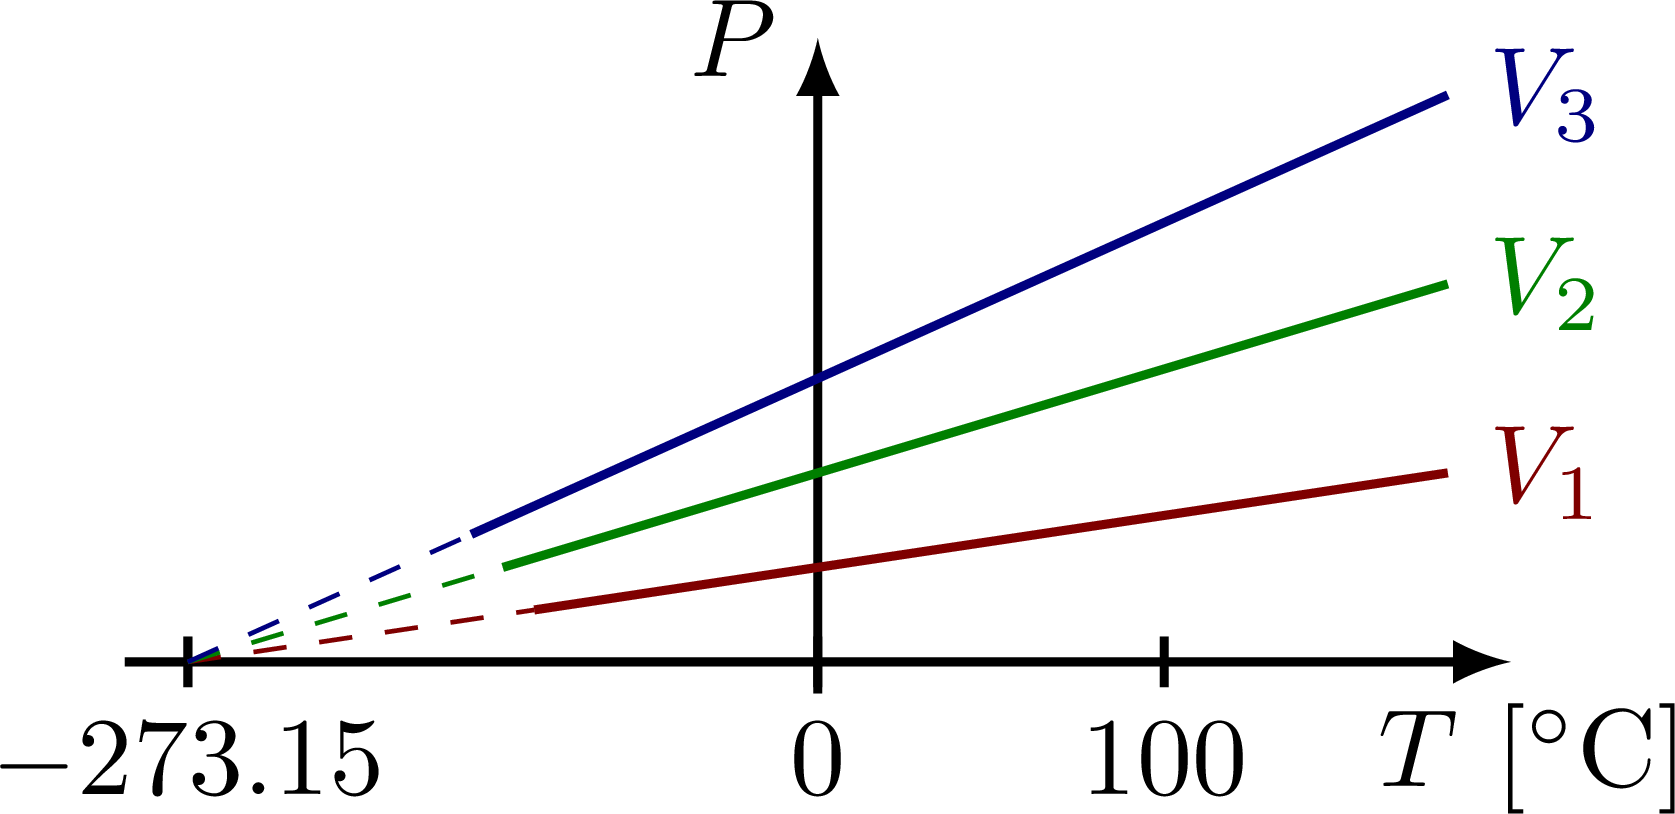
% PRESSURE vs. TEMPERATURE
\begin{tikzpicture}
\def\xmin{-2.0} \def\xmax{2.0}
\def\ymin{-0.1} \def\ymax{1.8}
\def\tick#1#2{\draw[thick] (#1+.08) --++ (0,-.16) node[below=-.5pt] {#2};}
\def\ym#1#2{#1*\xmin,{#2*(#1*\xmin-\xmin)/(\xmax-\xmin)}}
% AXIS
\draw[->,thick]
(1.1*\xmin,0) -- (1.1*\xmax,0) node[right=2,below] {$T$ [$^\circ$C]};
\draw[->,thick]
(0,\ymin) -- (0,1.1*\ymax) node[left,align=center] {$P$};
% TICK
\tick{\xmin,0}{$-273.15$}
\tick{0,0}{0}
\tick{1.1,0}{100}
% GAS LINE
\draw[thin,myred,dashed] (\xmin,0) -- (\ym{0.45}{0.6}) coordinate (V1);
\draw[thick,myred] (V1) -- (\xmax,0.6) node[right] {$V_1$};
\draw[thin,mygreen,dashed] (\xmin,0) -- (\ym{0.50}{1.2}) coordinate (V2);
\draw[thick,mygreen] (V2) -- (\xmax,1.2) node[right] {$V_2$};
\draw[thin,myblue,dashed] (\xmin,0) -- (\ym{0.55}{1.8}) coordinate (V3);
\draw[thick,myblue] (V3) -- (\xmax,1.8) node[right] {$V_3$};
\end{tikzpicture}
% PRESSURE vs. VOLUME
\begin{tikzpicture}
\def\N{20}
\def\nRTr{1.5}
\def\nRTg{0.9}
\def\nRTb{0.3}
\def\xmax{2.2}
\def\ymax{1.8}
\def\tick#1#2{\draw[thick] (#1+.08) --++ (0,-.16) node[below=-.5pt] {#2};}
% AXIS
\draw[->,thick]
(-0.1*\xmax,0) -- (1.1*\xmax,0) node[below] {$V$}; % [$\text{m}^3$]};
\draw[->,thick]
(0,-0.1*\xmax) -- (0,1.1*\ymax) node[left,align=center] {$P$};
\node[below left=-1] at (0,0) {0};
% ISOTHERMS
\draw[thick,myred,variable=\x,domain=\nRTr/\ymax:0.94*\xmax,samples=\N,smooth]
plot (\x,\nRTr/\x) node[above=1,right=-1,scale=0.84] {$T_1$};
\draw[thick,mygreen,variable=\x,domain=\nRTg/\ymax:0.94*\xmax,samples=\N,smooth]
plot (\x,\nRTg/\x) node[above=1,right=-1,scale=0.84] {$T_2$};
\draw[thick,myblue,variable=\x,domain=\nRTb/\ymax:0.94*\xmax,samples=\N,smooth]
plot (\x,\nRTb/\x) node[above=1,right=-1,scale=0.84] {$T_3$};
\end{tikzpicture}
\end{document}
Click to download: thermodynamics_functions.tex • thermodynamics_functions.pdf
Open in Overleaf: thermodynamics_functions.tex