")


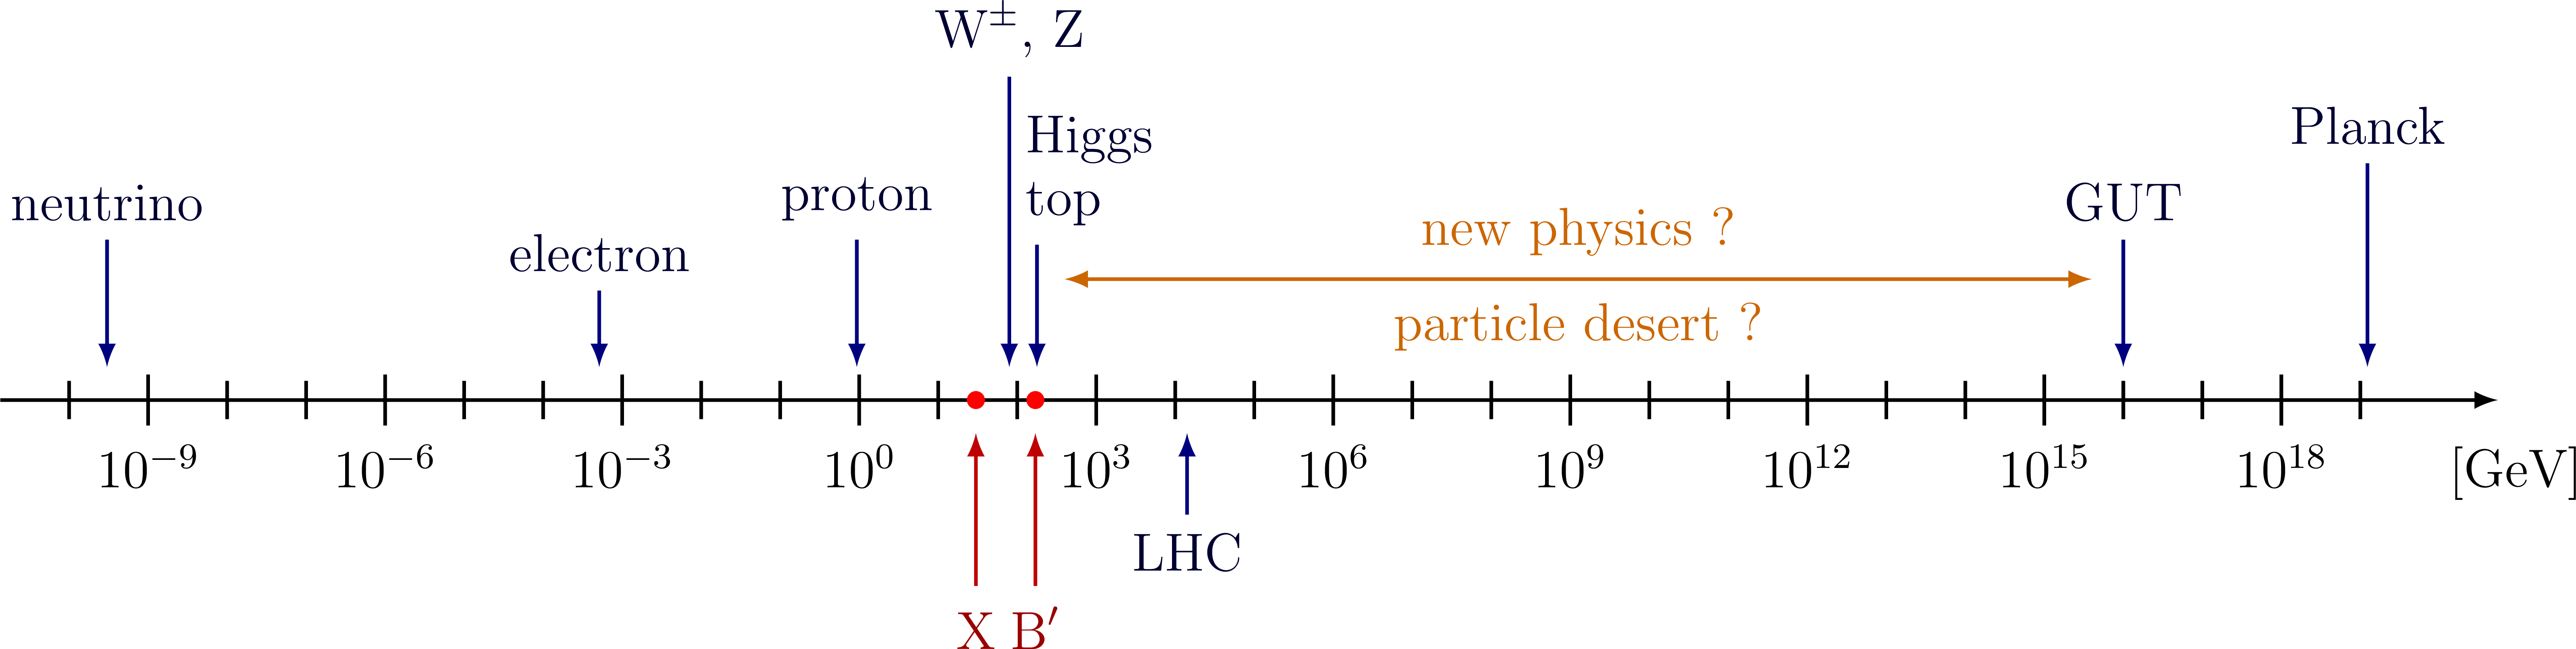
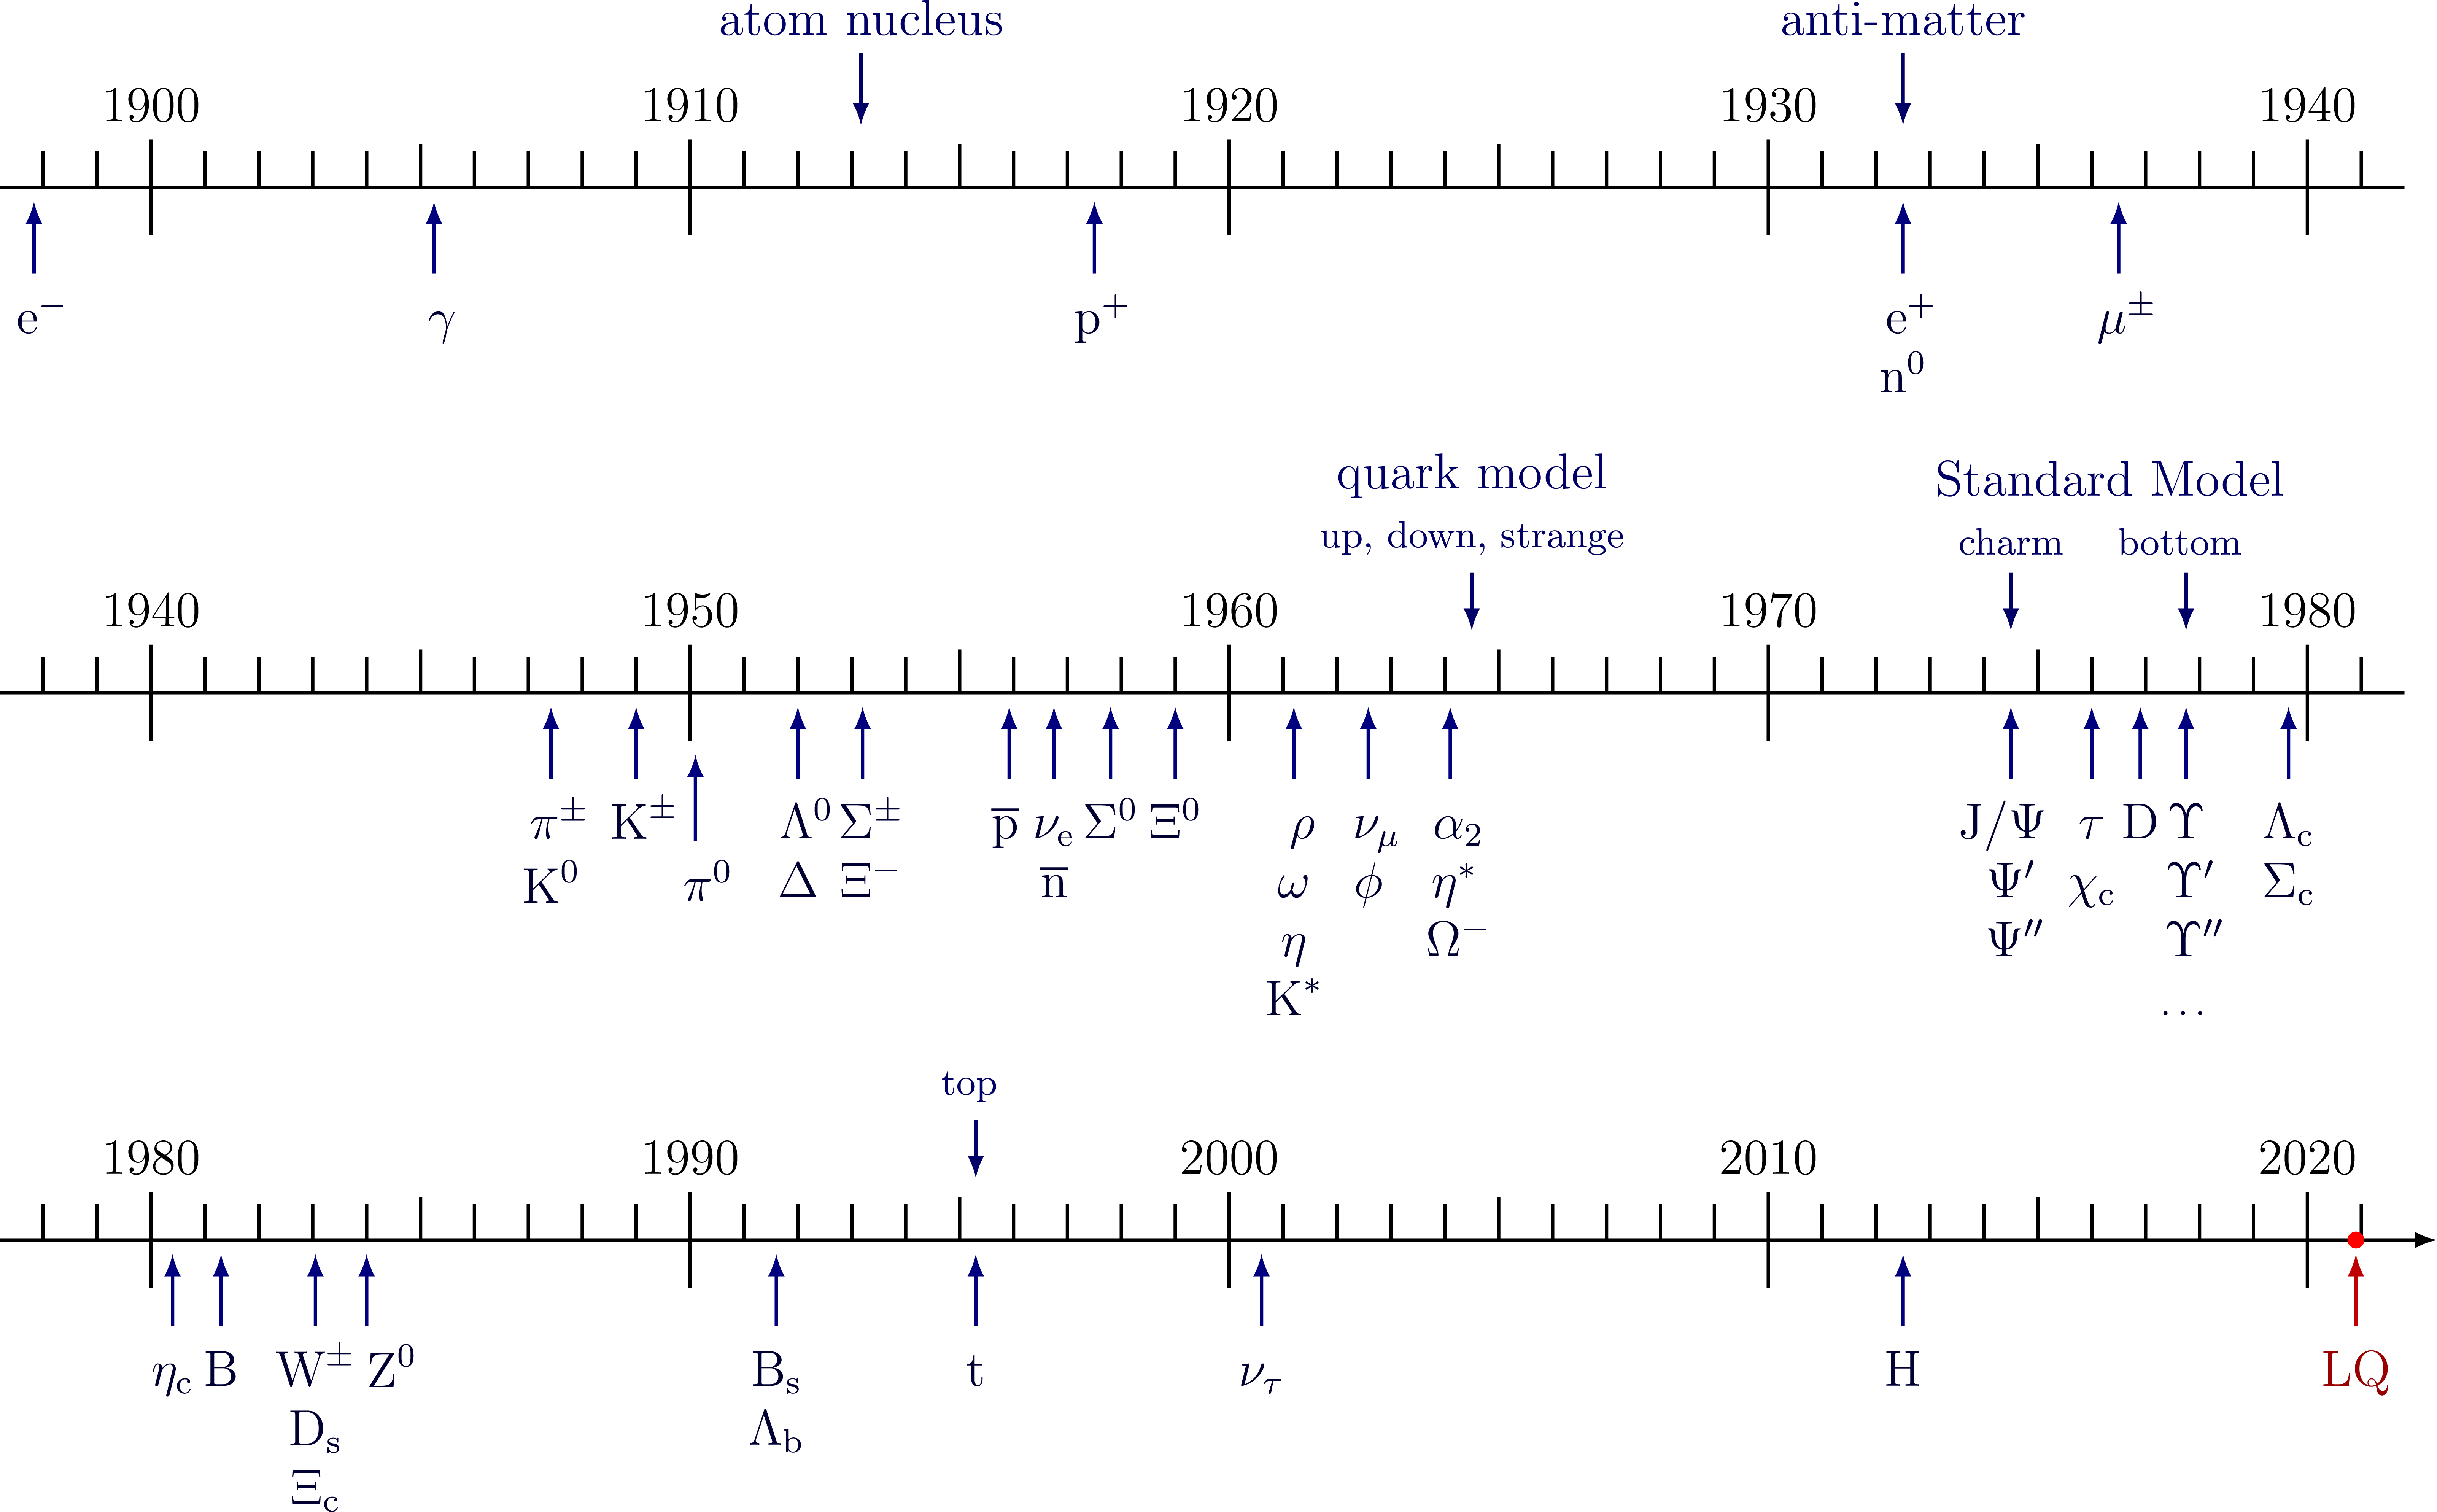
History timeline and energy scale of particle physics (including the GUT and Planck scale, and a possible particle desert). Inspiration for the chronology of particle discoveries: particleadventure.org and Wikipedia.
Edit and compile if you like:
% Author: Izaak Neutelings (July 2017)
% Timelines & energy scales of particle physics
\documentclass[border=1pt,tikz]{standalone}
\usepackage{amsmath} % for \dfrac
\usepackage{tikz}
\tikzset{>=latex} % for LaTeX arrow head
\begin{document}
% TIMELINE - simple test
\begin{tikzpicture}[]
% limits
\newcount\yearOne; \yearOne=1900
\def\w{15} % width of axes
\def\n{4} % number of decades
\def\lt{0.40} % ten tick length
\def\lf{0.36} % five tick length
\def\lo{0.30} % one tick length
% help functions
\def\yearLabel(#1,#2){\node[above] at ({(#1-\yearOne)*\w/\n/10},\lt) {#2};}
\def\yearArrowLabel(#1,#2,#3,#4){
\def\xy{{(#1-\yearOne)*\w/\n/10}}; \pgfmathparse{int(#2*100)};
\ifnum \pgfmathresult<0
\def\yyp{{(\lt*(0.90+#2))}}; \def\yyw{{(\yyp-\lt*#3)}}
\draw[<-,thick,black,align=center] (\xy,\yyp) -- (\xy,\yyw) node[below,black] at (\xy,\yyw) {#4};
\else
\def\yyp{{(\lt*(0.10+#2)}}; \def\yyw{{(\yyp+\lt*#3)}}
\draw[<-,thick,black,align=center] (\xy,\yyp) -- (\xy,\yyw) node[above,black] at (\xy,\yyw) {#4};
\fi}
% axis
%\draw[thick] (0,0) -- (\w,0);
\draw[->,thick] (-\w*0.03,0) -- (\w*1.03,0);
% ticks
\foreach \tick in {0,1,...,\n}{
\def\x{{\tick*\w/\n}}
\def\year{\the\numexpr \yearOne+\tick*10 \relax}
\draw[thick] (\x,\lt) -- (\x,-\lt) % ten tick
node[below] {\year};
\ifnum \tick<\n
\draw[thick] ({(\x+\w/\n/2)},0) -- ({(\x+\w/\n/2)},\lf); % five tick
\foreach \ticko in {1,2,3,4,6,7,8,9}{
\def\xo{{(\x+\ticko*\w/\n/10)}}
\draw[thick] (\xo,0) -- (\xo,\lo); % one tick
}\fi
}
% label
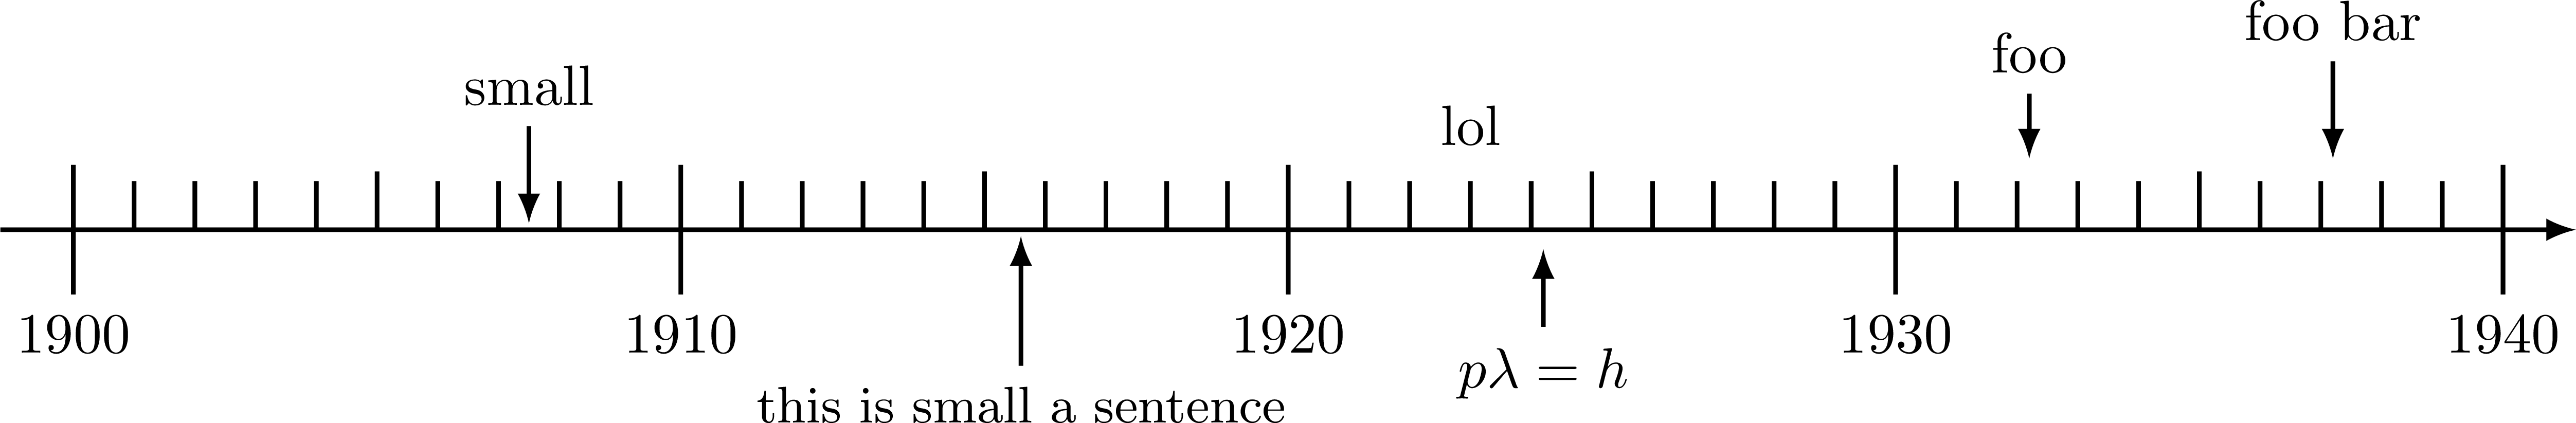
\yearLabel(1923,lol)
\yearArrowLabel(1932.2, 1.0,1.0,foo)
\yearArrowLabel(1937.2, 1.0,1.5,foo bar)
\yearArrowLabel(1907.5, 0.0,1.5,small)
\yearArrowLabel(1915.6,-1.0,2.0,\small this is small a sentence)
\yearArrowLabel(1924.2,-1.2,1.2,$p\lambda=h$)
\end{tikzpicture}
% LOGARITHMIC SCALE
\large
\begin{tikzpicture}[]
% limits
\newcount\nOne; \nOne=-10
\def\w{18} % width of axes
\def\n{29} % number of decades
\def\noffset{1} % offset labels
\def\nskip{3} % skip number
\def\la{2.00} % arrow length
\def\lt{0.20} % tick length
\def\ls{0.15} % tick length (skipped)
% help functions
\def\myx(#1){{(#1-\nOne)*\w/\n}}
\def\arrowLabel(#1,#2,#3,#4){
\def\xy{(#1-\nOne)*\w/\n}; \pgfmathparse{int(#2*100)};
\ifnum \pgfmathresult<0
\def\yyp{{(\lt*(-0.10+#2))}}; \def\yyw{{(\yyp-\la*\lt*#3)}}
\draw[<-,thick,black!50!blue,align=center]
(\myx(#1),\yyp) -- (\myx(#1),\yyw)
node[below,black!80!blue] {#4}; %,fill=white
\else
\def\yyp{{(\lt*(0.10+#2)}}; \def\yyw{{(\yyp+\la*\lt*#3)}}
\draw[<-,thick,black!50!blue,align=center]
(\myx(#1),\yyp) -- (\myx(#1),\yyw)
node[above,black!80!blue] {#4};
\fi}
\def\arrowLabelRed(#1,#2,#3,#4){
\def\yyp{{(\lt*(-0.10+#2))}}; \def\yyw{{(\yyp-\la*\lt*#3)}}
\fill[red,radius=2pt] (\myx(#1),0) circle;
\draw[<-,thick,black!25!red,align=center]
(\myx(#1),\yyp) -- (\myx(#1),\yyw)
node[below,black!40!red] {\strut#4}; %,fill=white
}
% axis
\draw[->,thick] (-\w*0.03,0) -- (\w*1.06,0)
node[right=4pt,below=6pt] {[GeV]};
% ticks
\foreach \tick in {0,1,...,\n}{
\def\x{{\tick*\w/\n}}
\def\dec{\the\numexpr \nOne+\tick \relax}
\pgfmathparse{Mod(\tick-\noffset,\nskip)==0?1:0}
\ifnum\pgfmathresult>0
\draw[thick] (\x,\lt) -- (\x,-\lt) % ten tick
node[below] {$10^{\dec}$}; % label
\else
\draw[thick] (\x,\ls) -- (\x,-\ls); % ten tick
\fi
}
% label
\arrowLabel(-9.52,1.2,2.5,neutrino) % log(0.0000000003)=-9.523 (0.3 eV)
\arrowLabel(-3.29,1.2,1.5,electron) % log(0.000510)=-3.292 (0.510 MeV)
\arrowLabel(-0.03,1.2,2.5,proton) % log(0.938)=-0.03
\arrowLabel( 1.90,1.2,5.7,$\text{W}^\pm$, $\text{Z}$) % log(80)=1.90, log(90)=1.95
\arrowLabel( 2.25,1.2,2.4,\qquad Higgs\\\quad top) % log(125)=2.10, log(175)=2.24
\arrowLabel( 4.15,-1.2,1.6,LHC) % log(1400)=4.146
\arrowLabel(16.00,1.2,2.5,GUT) % 10^25 eV = 10^16 GeV
\arrowLabel(19.09,1.2,4.0,Planck) % Planck % quantum gravity % 1.22x10^19 . GeV
% low mass
\arrowLabelRed(1.477,-1.2,3.0,X) % ln(30) = 1.477
\arrowLabelRed(2.230,-1.2,3.0,$\text{B}'$) % ln(170) = 2.230
% stretch
\draw[<->,thick,black!20!orange]
({(2.6-\nOne)*\w/\n},0.95) -- ({(15.6-\nOne)*\w/\n},0.95)
node[midway,below=1pt] {particle desert ?}
node[midway,above=1pt] {new physics ?};
\end{tikzpicture}
% TIMELINE - particle physics
% sources: http://web.ihep.su/dbserv/compas/src/
% http://www.particleadventure.org/other/history/
% https://en.wikipedia.org/wiki/Timeline_of_particle_discoveries
\large
\begin{tikzpicture}[] %[minimum height=10pt, text height=10pt,text depth=10pt,
% limits
\newcount\yearOne; \yearOne=1900
\newcount\yoffset;
\def\w{18} % width of axes
\def\n{4} % number of decades
\def\lt{0.40} % ten tick length
\def\lf{0.36} % five tick length
\def\lo{0.30} % one tick length
\def\lext{0.07} % left extension of axes
\def\rext{1.045} % left extension of axes
% help functions
\def\yearLabel(#1,#2,#3){\node[above,black!60!blue] at ({(#1-\yearOne)*\w/\n/10},{\lt*#2}) {#3};}
\def\yearArrowLabel(#1,#2,#3,#4){
\def\xy{{(#1-\yearOne)*\w/\n/10}}; \pgfmathparse{int(#2*100)};
\ifnum \pgfmathresult<0 % below
\def\yyp{{(\lt*(0.90+#2))}}; \def\yyw{{(\yyp-\lt*#3)}}
\draw[<-,thick,black!50!blue,align=center]
(\xy,\yyp) -- (\xy,\yyw)
node[below,black!80!blue] at (\xy,\yyw) {\strut #4};
\else % under
\def\yyp{{(\lt*(0.10+#2)}}; \def\yyw{{(\yyp+\lt*#3)}}
\draw[<-,thick,black!60!blue,align=center]
(\xy,\yyp) -- (\xy,\yyw)
node[above] at (\xy,\yyw) {#4};
\fi}
\def\yearArrowLabelRed(#1,#2,#3,#4){
\def\xy{{(#1-\yearOne)*\w/\n/10}}; \pgfmathparse{int(#2*100)};
\def\yyp{{(\lt*(0.90+#2))}}; \def\yyw{{(\yyp-\lt*#3)}}
\fill[red,radius=2pt] (\xy,0) circle;
\draw[<-,thick,black!25!red,align=center]
(\xy,\yyp) -- (\xy,\yyw)
node[below,black!40!red] at (\xy,\yyw) {\strut #4};
}
%---------------%
% 1900 - 1940 %
%---------------%
% axis
\draw[thick] (-\w*0.07,0) -- (\w*\rext,0);
% ticks
\foreach \tick in {0,1,...,\n}{
\def\x{{\tick*\w/\n}}
\def\year{\the\numexpr \yearOne+\tick*10 \relax}
\draw[thick] (\x,-\lt) -- (\x,\lt) % ten tick
node[above] {\year};
\ifnum \tick<\n
\draw[thick] ({(\x+\w/\n/2)},0) -- ({(\x+\w/\n/2)},\lf); % five tick
\foreach \ticko in {1,2,3,4,6,7,8,9}{
\def\xo{{(\x+\ticko*\w/\n/10)}}
\draw[thick] (\xo,0) -- (\xo,\lo); % one tick
}\fi
}
% extra ticks
\draw[thick] (-1*\w/\n/10,0) -- (-1*\w/\n/10,\lo);
\draw[thick] (-2*\w/\n/10,0) -- (-2*\w/\n/10,\lo);
\draw[thick] ({\w+\w/\n/10},0) -- ({\w+\w/\n/10},\lo);
% labels
\yearArrowLabel(1897.83,-1.2,1.5,
$\text{e}^-$) % electron 10/1897 Thomson
\yearArrowLabel(1905.25,-1.2,1.5,
$\gamma$) % photon 03/1905 Einstein
\yearArrowLabel(1913.17, 1.2,1.5,
atom nucleus) % nucleus 02/1913 Rutherford
\yearArrowLabel(1917.50,-1.2,1.5,
$\text{p}^+$) % proton 1917 Rutherford (Philos. Mag., Ser. 6, Vol. 37, 581 (1919))
\yearArrowLabel(1932.50, 1.2,1.5,
anti-matter) % anti-matter
\yearArrowLabel(1932.50,-1.2,1.5,
$\text{e}^+$\\ % positron 1932 Anderson
$\text{n}^0$) % neutron 1932 Chadwick
\yearArrowLabel(1936.50,-1.2,1.5,
$\mu^\pm$) % muon 1936
%---------------%
% 1940 - 1980 %
%---------------%
\yearOne=1940; \advance\yoffset by 120
\begin{scope}[yshift=-\yoffset]
% axis
\draw[thick] (-\w*\lext,0) -- (\w*\rext,0);
% ticks
\foreach \tick in {0,1,...,\n}{
\def\x{{\tick*\w/\n}}
\def\year{\the\numexpr \yearOne+\tick*10 \relax}
\draw[thick] (\x,-\lt) -- (\x,\lt) % ten tick
node[above] {\year};
\ifnum \tick<\n
\draw[thick] ({(\x+\w/\n/2)},0) -- ({(\x+\w/\n/2)},\lf); % five tick
\foreach \ticko in {1,2,3,4,6,7,8,9}{
\def\xo{{(\x+\ticko*\w/\n/10)}}
\draw[thick] (\xo,0) -- (\xo,\lo); % one tick
}\fi
}
% extra ticks
\draw[thick] (-1*\w/\n/10,0) -- (-1*\w/\n/10,\lo);
\draw[thick] (-2*\w/\n/10,0) -- (-2*\w/\n/10,\lo);
\draw[thick] ({\w+\w/\n/10},0) -- ({\w+\w/\n/10},\lo);
% labels
\yearArrowLabel(1947.42,-1.2,1.5,
$\pi^\pm$\\ % pions 05/1947 Lattes, Muirhead, Occhialini, Powell
$\text{K}^0$) % neutral kaons 12/1947 Rochester & Butler, Nature, 160, 855
\yearArrowLabel(1949.00,-1.2,1.5,
$\text{K}^\pm$) % kaons 12/1949 Powell, Fowler, Perkins, Nature, 163, 82
\yearArrowLabel(1950.10,-2.2,1.8,
\,$\pi^0$) % pi0 01/1950 Caltech
\yearArrowLabel(1952.00,-1.2,1.5,
$\Lambda^0$\\ % Lambda0 12/1950 Hopper, Biswas, Phys. Rev. 80, 1099
$\Delta$) % 1952 Anderson, Fermi, (Chicago Cyclotron), Phys. Rev., 85, 936
% 1956 Ashkin (Rochester cyclotron), Phys. Rev., 101, 1149
% Sigma+ 1953 Bonetti, Nuovo Cimento, 10, 1; Danysz, Pniewski, Phil. Mag., 44, 348; Cosmotron Brookhaven, Phys. Rev., 93, 109
% Xi- "negative hyperon" 1954 Cowan (Caltech), Phys. Rev., 94, 161
\yearArrowLabel(1953.20,-1.2,1.5,\,\,$\Sigma^\pm$\\\,\,$\Xi^-$)
\yearArrowLabel(1955.92,-1.2,1.5,$\overline{\text{p}}$\,) % 11/1955 Chamberlain, Segrè (Bevatron) Phys. Rev. 100, 947
\yearArrowLabel(1956.75,-1.2,1.5,$\nu_\text{e}$\\$\overline{\text{n}}$) % 09/1956 Reines, Cowan, Nature, 178, 446
\yearArrowLabel(1957.80,-1.2,1.5,$\Sigma^0$) %
\yearArrowLabel(1959.00,-1.2,1.5,$\Xi^0$) % Xi 1959 (1964 Brookhaven)
% 1960 Sigma*(1385) Phys. Rev. Lett., 5, 520
\yearArrowLabel(1961.20,-1.2,1.5,
$\rho$\\ % 1961 Erwin (Cosmotron) Phys. Rev. Lett., 6, 628
$\omega$\\ % 1961 Maglic, Alvarez, Phys. Rev. Lett., 7, 178
$\eta$\\ % 1961 Pevsner, Phys. Rev. Lett., 7, 421
$\text{K}^*$) % 1961 Alston, Phys. Rev. Lett., 6, 300, 1962 Phys. Rev. Lett., 9, 330
% 19.. strangeness "associated-production", Pais
% 1962 Eightfold Way, Gell-Man
\yearArrowLabel(1962.58,-1.2,1.5,\vspace{2pt}
$\nu_\mu$\\ % 07/1962, Ledderman, Danby, Phys. Rev. Lett. 9, 36
$\phi$) % 1962, Pjerrou Phys. Rev. Lett., 9, 114, Bertanza, Phys. Rev. Lett., 9, 180
% 1962 f particle?
\yearArrowLabel(1964.10,-1.2,1.5,
$\alpha_2$\\ %
\,$\eta^*$\\ %
\,\,$\Omega^-$) % 02/1964, Barnes, Brookhaven, Phys. Rev. Lett. 12, 204
\yearArrowLabel(1964.50, 1.2,1.2,
quark model\\
\small{up, down, strange}) % Gell-Mann
% 1967 Steven Weinberg, Abdus Salam: electroweak unification
\yearArrowLabel(1974.50, 1.2,1.2,
\qquad\qquad Standard Model\\
\small{charm}) % charm
% 1974 November Revolution
\yearArrowLabel(1974.50,-1.2,1.5,$\text{J/}\Psi$\,\,\\$\Psi'$\\\,$\Psi''$) %
%\yearLabel(1973,4.0,Standard Model) % Standard Model
% tau 1975 Perl, Abrams, Phys. Rev. Lett. 35, 1489
\yearArrowLabel(1976.00,-1.2,1.5,$\tau$\\$\chi_\text{c}$) %
\yearArrowLabel(1976.90,-1.2,1.5,
$\text{D}$ ) % 1976 SLAC
\yearArrowLabel(1977.75, 1.2,1.2,
\small{bottom} ) % bottom
\yearArrowLabel(1977.75,-1.2,1.5,$\Upsilon$\\\,$\Upsilon'$\\\,\,$\Upsilon''$\\\small\ldots) % Fermilab
\yearArrowLabel(1979.65,-1.2,1.5,$\Lambda_\text{c}$\\$\Sigma_\text{c}$) %
\end{scope}
%---------------%
% 1980 - 2020 %
%---------------%
\yearOne=1980; \advance\yoffset by 130
\begin{scope}[yshift=-\yoffset]
% axis
\draw[->,thick] (-\w*\lext,0) -- (\w*1.06,0);
% ticks
\foreach \tick in {0,1,...,\n}{
\def\x{{\tick*\w/\n}}
\def\year{\the\numexpr \yearOne+\tick*10 \relax}
\draw[thick] (\x,-\lt) -- (\x,\lt) % ten tick
node[above] {\year};
\ifnum \tick<\n
\draw[thick] ({(\x+\w/\n/2)},0) -- ({(\x+\w/\n/2)},\lf); % five tick
\foreach \ticko in {1,2,3,4,6,7,8,9}{
\def\xo{{(\x+\ticko*\w/\n/10)}}
\draw[thick] (\xo,0) -- (\xo,\lo); % one tick
}\fi
}
% extra ticks
\draw[thick] (-1*\w/\n/10,0) -- (-1*\w/\n/10,\lo);
\draw[thick] (-2*\w/\n/10,0) -- (-2*\w/\n/10,\lo);
\draw[thick] ({\w+\w/\n/10},0) -- ({\w+\w/\n/10},\lo);
% labels
\yearArrowLabel(1980.40,-1.2,1.5,
$\eta_\text{c}$ ) %
\yearArrowLabel(1981.30,-1.2,1.5,
B ) %
\yearArrowLabel(1983.05,-1.2,1.5,
\mbox{$\text{W}^\pm$\hspace{4pt}}\\
$\text{D}_\text{s}$\\
$\Xi_\text{c}$ ) %
\yearArrowLabel(1984.00,-1.2,1.5,
\mbox{\hspace{12pt}$\text{Z}^0$} ) %
\yearArrowLabel(1991.60,-1.2,1.5,$\text{B}_\text{s}$\\$\Lambda_\text{b}$) % Bs Fermilab
\yearArrowLabel(1995.30,-1.2,1.5,t) %
\yearArrowLabel(1995.30, 1.2,1.2,
\small{top} ) %
\yearArrowLabel(2000.60,-1.2,1.5,$\nu_\tau$) %
\yearArrowLabel(2012.50,-1.2,1.5,H) %
%\yearArrowLabelRed(2017.7,-1.2,1.5,X\\\,$\text{B}'$) % low mass
\yearArrowLabelRed(2020.9,-1.2,1.5,LQ) % leptoquark
\end{scope}
\end{tikzpicture}
\end{document}
Click to download: timeline.tex • timeline.pdf
Open in Overleaf: timeline.tex


