For a simple method without pstricks, please see this page.
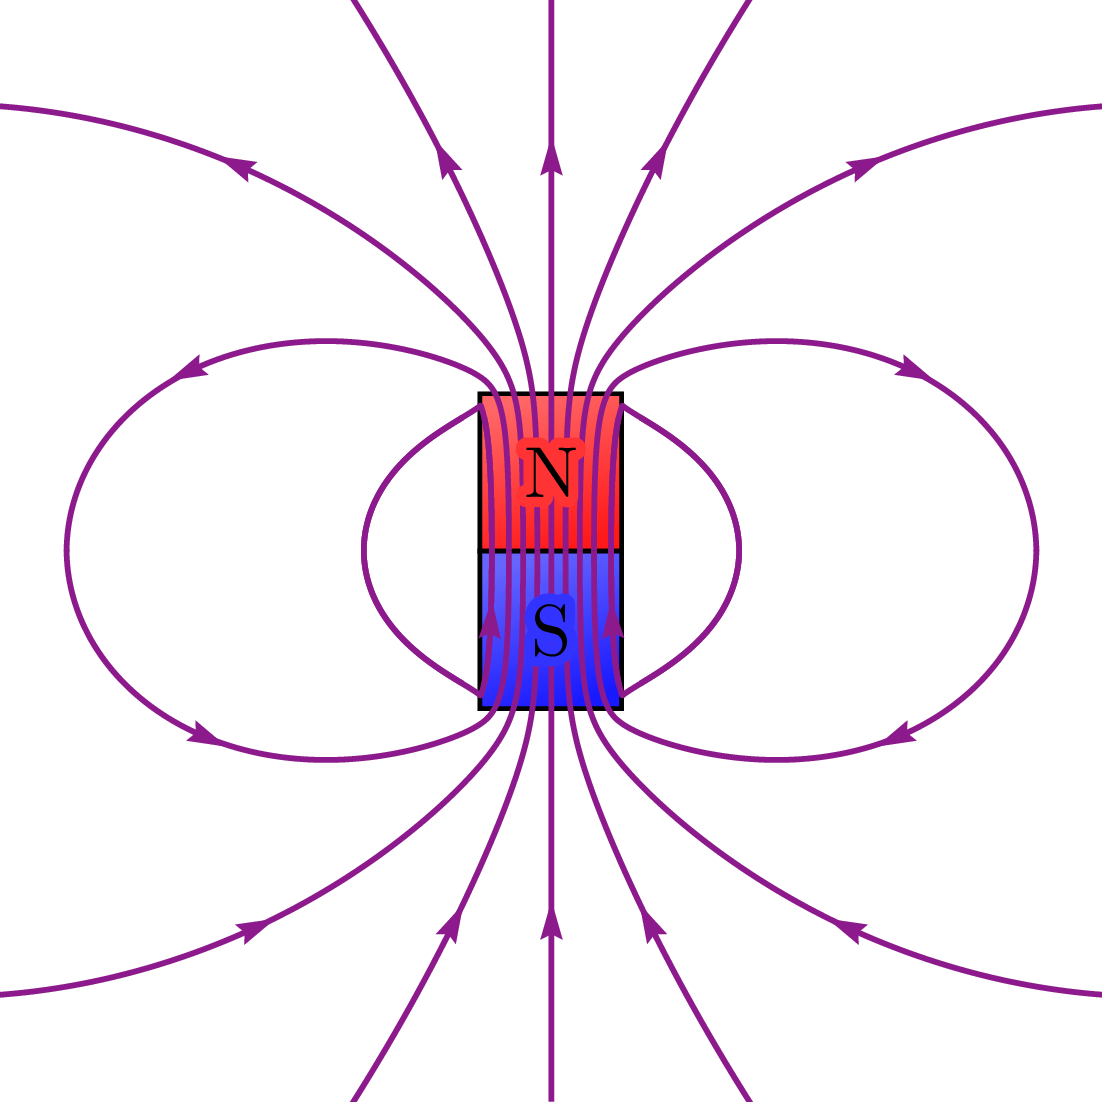
Sources: Inspiration, pstricks manual.
Edit and compile if you like:
% Author: Izaak Neutelings (March 2020)
% PSTricks => compile with XeLaTeX
% http://mirror.easyname.at/ctan/graphics/pstricks/contrib/pst-magneticfield/doc/pst-magneticfield-doc.pdf
%  N=6:          number of turns
%  R=2:          radius
%  L=4:          length
%  pointsB=500:  maximum number of points on each line of the entire coil
%  pointsS=1000: maximum number of points on lines around turns selected
%  nL=8:         number of lines of the entire coil
%  PasB=0.02:    differential steps for the lines of the entire coil
%  PasS=0.00275: differential steps for the lines around turns selected
%  numSpires={}: choice of individual coils to improve the rendering of its layout
%  nS=1:         number of field lines around the turns selected
%  drawSelf=false: do not represent the solenoid with the option (useful for 3D)
% https://tex.stackexchange.com/questions/468225/pstricks-magnetic-field-lines-of-a-bar-magnet
%\documentclass{standalone}
\documentclass[border=3pt,tikz]{standalone}
\usepackage{tikz}
\usepackage{auto-pst-pdf}
\usepackage{pst-magneticfield}
\usepackage[outline]{contour} % glow around text
\usetikzlibrary{calc}
\tikzset{>=latex} % for LaTeX arrow head
\usetikzlibrary{decorations.pathreplacing}
%\usepackage{pgfplots}
%\newcommand{\fieldlinecurve}[2]{{(pow(#1,2)*(3*cos(#2)+cos(3*#2))}, {(pow(#1,2))*(sin(#2)+sin(3*#2))}}
\usepackage{xcolor}
\colorlet{Bcol}{violet!90}
\colorlet{Ncol}{red!60}
\colorlet{Scol}{blue!60}
\tikzstyle{north}=[thick,top color=red!60,bottom color=red!90,shading angle=20]
\tikzstyle{south}=[thick,top color=blue!60,bottom color=blue!90,shading angle=20]
\contourlength{1.5pt}


\begin{document}

%\psset{unit=0.5}
%\begin{pspicture*}(-20,-16)(20,16)
%  \psframe[linecolor=black, fillstyle=solid,fillcolor=north](-2,0)(2,6)
%  \psframe[linecolor=black, fillstyle=solid,fillcolor=south](-2,0)(2,-6)
%  \psmagneticfield[
%      N=128,R=2,L=11.95,
%      nL=7,pointsB=8000,
%      nS=1,numSpires=13,pointsS=8000,
%      linecolor=Bcol,drawSelf=false](-20,-16)(20,16)
%  %\rput(0,-5.2){\textcolor{white}{S}}
%  %\rput(0,5.2){\textcolor{white}{N}}
%\end{pspicture*}

\def\xmax{3.5}
\def\ymax{3.5}
\def\H{1}
\def\W{0.45}
\begin{tikzpicture}[shift={(\xmax+0.024,\ymax+0.024)}]
  \draw[north] (-\W,0) rectangle (\W, \H);
  \draw[south] (-\W,0) rectangle (\W,-\H);
  \begin{scope} %[shift={(3,3)}]
    \clip (-\xmax,-\ymax) rectangle (\xmax,\ymax); %[shift={(0,-10)}]
    %\psset{unit=0.5}
    \psset{arrowinset=0} % does not work?
    %\newpsstyle{sensCourant}{arrowinset=0}
    \begin{pspicture*}(-\xmax,-\ymax)(\xmax,\ymax) %[shift=-10]
      \psframe[linecolor=white](-\xmax,-\ymax)(\xmax,\ymax)
      %\psframe[linecolor=black, fillstyle=solid,fillcolor=Ncol](-1,0)(1,3)
      %\psframe[linecolor=black, fillstyle=solid,fillcolor=Scol](-1,0)(1,-3)
      \psmagneticfield[
          N=120,R=\W,L=2, %-0.005,
          nL=4,pointsB=800,
          nS=1,numSpires=10,pointsS=1500,
          linewidth=1.0pt,linecolor=Bcol,drawSelf=false
        ](-\xmax,-\ymax)(\xmax,\ymax)
      %\rput(0,-5.2){\textcolor{white}{S}}
      %\rput(0,5.2){\textcolor{white}{N}}
    \end{pspicture*}
  \end{scope}
  \node[scale=1.3] at (0, \H/2) {\contour{red!80}{N}};
  \node[scale=1.3] at (0,-\H/2) {\contour{blue!80}{S}};
\end{tikzpicture}

%\begin{tikzpicture}[
%    scale=1,
%    interface/.style={postaction={draw, decorate, decoration={border,angle=45, amplitude=-3mm, segment length=2mm}}}
%  ]
%  \begin{scope}[
%    field line/.style={color=red!75!gray, smooth,
%    variable=\t, samples at={0,5,...,360}}
%    ]
%    \clip (-2,-2) rectangle (2,2);
%    \foreach \u in {0}{
%      \foreach \r in {0.1,0.3,...,1.8} {
%        \draw[field line, smooth] plot (\fieldlinecurve{\r}{\t});
%      }
%    }
%  \end{scope}
%
%\end{tikzpicture}

%\begin{tikzpicture}
%    \begin{axis}[
%        title={$x \exp(-x^2-y^2)$ and its gradient},
%        domain=-2:2,
%        view={0}{90},
%        axis background/.style={fill=white},
%    ]
%    \addplot3[contour gnuplot={number=9,
%       labels=false},thick]
%       {exp(0-x^2-y^2)*x};
%    \end{axis}
%\end{tikzpicture}

\end{document}
Click to download: magnet_fieldlines_pstricks.tex • magnet_fieldlines_pstricks.pdf
Open in Overleaf: magnet_fieldlines_pstricks.tex


