")


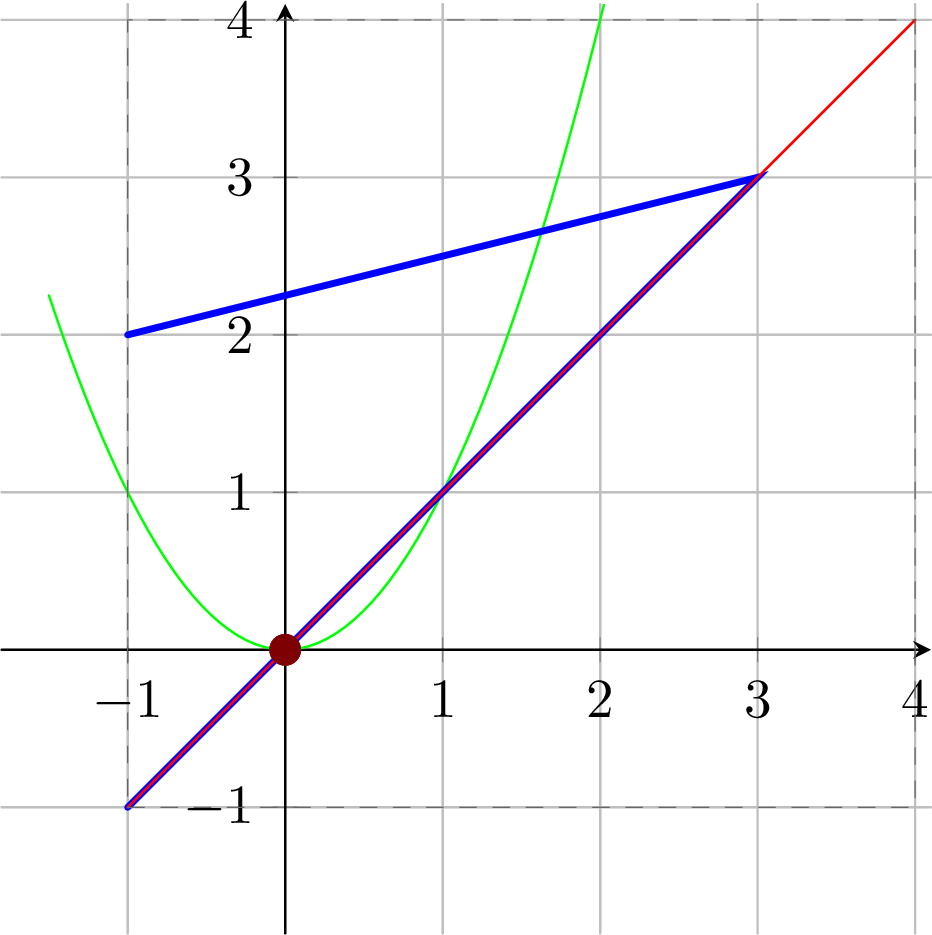
Include a text file data.txt containing for example
   x    y

-1.0 -1.0

 0.0  0.0

 1.0  1.0

 3.0  3.0

-1.0  2.0
Edit and compile if you like:
% Author: Izaak Neutelings (September 2020)
\documentclass[border=3pt,tikz]{standalone}
\usepackage{amsmath}
\usepackage{tikz,pgfplots}
\tikzset{>=latex} % for LaTeX arrow head
\pgfplotsset{compat=1.17} % TikZ coordinates <-> axes coordinates

\begin{document}


% LOAD DATA
\begin{tikzpicture}[line cap=round]
  \begin{axis}[
      domain=-1.5:3,samples=80,
      xmin=-1.8, xmax=4.1,
      ymin=-1.8, ymax=4.1,
      axis lines=center,
      anchor=origin,x=1cm,y=1cm, % coincide with TikZ coordinates
      %axis equal image, % fit TikZ image
      grid=both,
      %xlabel=$x$,
      %ylabel=$y$,
    ]
    \addplot[green] {x^2};
    \addplot[very thick,blue] table {data.txt};
  \end{axis}
  \draw[red,thin] (-1,-1) -- (4,4);
  \draw[black!60,dashed,very thin] (-1,-1) -| (4,4) -| cycle;
  \fill[red!50!black] (0,0) circle(0.1);
  \fill[red!50!black] (0,0) circle(0.1);
\end{tikzpicture}


\end{document}
Click to download: data.tex • data.pdf
Open in Overleaf: data.tex


