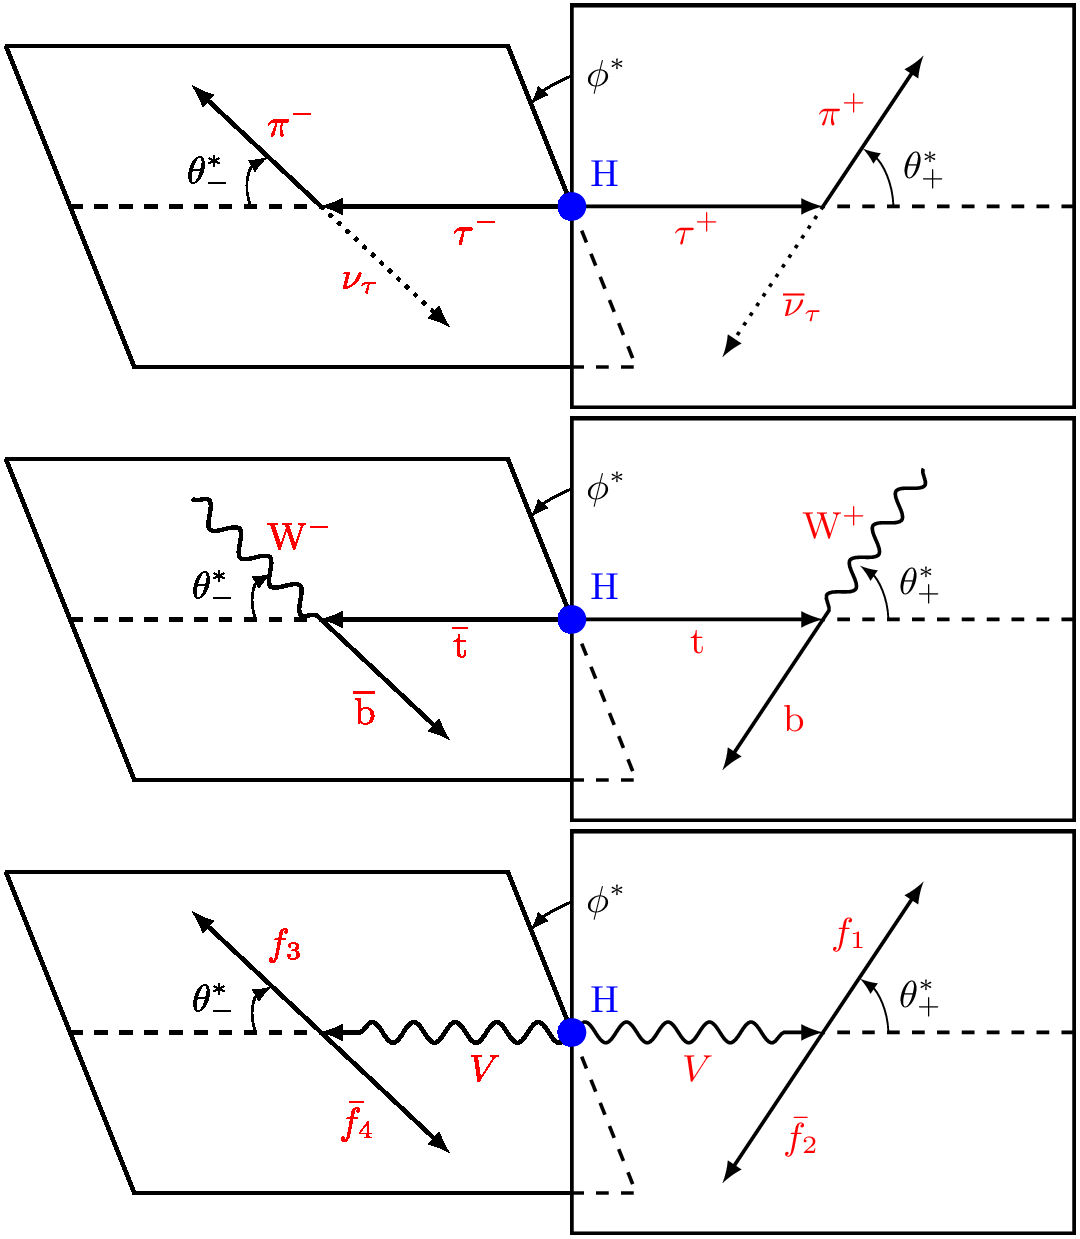
Analysis of angular relation between decay products of a Higgs boson (H → VV, H → tt, H → 𝜏𝜏). Inspired by the graph in this review of the Standard Model Higgs boson. For more related figures, please see the “decay” tag, or the Particle Physics category.
Edit and compile if you like:
% Author: Izaak Neutelings (June, 2017)
% model diagram: https://arxiv.org/abs/hep-ph/0503172
% boson/wiggle/snake: https://tex.stackexchange.com/questions/68890/how-can-i-draw-snake-arrow-in-automata-using-tikz

\documentclass{article}
\usepackage{tikz}
\usepackage{tikz-3dplot}
\tikzset{>=latex} % for LaTeX arrow head
\usetikzlibrary{decorations.pathmorphing} % for snake

%\usetikzlibrary{quotes,angles,positioning} % labeling points
%\usetikzlibrary{angles,quotes} % for pic (angle labels)
%\usetikzlibrary{calc}
%\tikzset{ % for carc in pic
%  pics/carc/.style args={#1:#2:#3}{
%    code={
%      \draw[pic actions] (#1:#3) arc(#1:#2:#3);
%}}}

% split figures into pages
\usepackage[active,tightpage]{preview}
\PreviewEnvironment{tikzpicture}
\setlength\PreviewBorder{1pt}%

\begin{document}


%                         PA________________PB
%  QA________________QB  _|                  |
%   \       F3         \/ |            F1    |
%    \        \         \ |           /      |
%     \      ( \         \|          / )     |
%      \--------<---------o--------->--------+
%       \        \        |\       /         |
%        \        \       | \     /          |
%         \        F4     |  \    F2         |
%          QD_____________|_QC               |
%                         PD________________PC
%


% FALSE PERSPECTIVE - Higgs to tau lepton pair
\small
\tdplotsetmaincoords{90}{90} % look straight at yz plane
\begin{tikzpicture}[tdplot_main_coords,scale=0.85]

  \def\W{5}
  \def\w{2.5}
  \def\R{0.7}

  \coordinate (A)  at (0,-\W, 0);
  \coordinate (O)  at (0,  0, 0);
  \coordinate (B)  at (0, \W, 0);

  \coordinate (P1) at (0,  0,   2);
  \coordinate (P2) at (0, \W,   2);
  \coordinate (P3) at (0, \W,  -2);
  \coordinate (P4) at (0,  0,  -2);
  \coordinate (P0) at (0, \w,   0);
  \coordinate (F1) at (0,3.5, 1.5);
  \coordinate (F2) at (0,1.5,-1.5);

  \coordinate (phi) at (0,0,1.3);

  \begin{scope}[xslant=-0.4,yscale=0.8]
    \coordinate (Q1) at (0, -\W,   2);
    \coordinate (Q2) at (0,   0,   2);
    \coordinate (Q3) at (0,   0,  -2);
    \coordinate (Q4) at (0, -\W,  -2);
    \coordinate (Q0) at (0, -\w,   0);
    \coordinate (F3) at (0,-3.3, 1.5);
    \coordinate (F4) at (0,-1.7,-1.5);
  \end{scope}

  % plane 2
  \draw[thick]
        (Q1) %node at (Q1) {Q1}
     -- (Q2) %node at (Q2) {Q2}
     -- (Q3) %node at (Q3) {Q3}
     -- (Q4) %node at (Q4) {Q4}
     -- (Q1);

  % plane 1 - filled white
  \fill[color=white,thick,draw=black]
        (P1) -- (P2) -- (P3) -- (P4) -- cycle;

  % plane 2 - dashes corner
  \begin{scope}
    \clip (P1) -- (P2) -- (P3) -- (P4) -- cycle;
    \draw[dashed,thick] (Q2) -- (Q3) -- (Q4);
  \end{scope}

  % axis and arrows
  \draw[dashed,thick]
    (A)  -- (Q0);
  \draw[dashed,thick]
    (B)  -- (P0);
  \draw[thick,->]
    (O)  -- node[red,below=-2pt]       {$\tau^+$} (P0);
  \draw[thick,->]
    (O)  -- node[red,below right=-2pt] {$\tau^-$} (Q0);
  \draw[thick,->]
    (P0) -- node[red,above left=-2pt]  {$\pi^+$} (F1);
  \draw[thick,dotted,->]
    (P0) -- node[red,below right=-1pt] {$\overline{\nu}_\tau$} (F2);
  \draw[thick,->]
    (Q0) -- node[red,above right=-1pt] {$\pi^-$} (F3);
  \draw[thick,dotted,->]
    (Q0) -- node[red,below left=-2pt]  {$\nu_\tau$} (F4);

  % dots
  \fill[blue]
  	(O) circle [radius=4pt];
    \node [above=8pt,right=1pt,blue] at (O) {H}; % needs extra package
  %\fill (P0) circle [radius=2pt];
  %\fill (Q0) circle [radius=2pt];

  % angles
  \draw[canvas is yz plane at x=0,rotate around z=20,->]
    (phi) arc [start angle=90,end angle=118,radius=1]
    node at (phi) [right=0pt] {$\phi^*$};
  \draw[canvas is yz plane at x=0,->]
    (P0)+(\R,0,0)  arc [start angle=0,end angle=55,radius=\R]
    node[midway,above=1pt,right=1pt] {$\theta^*_+$};
  \draw[canvas is yz plane at x=0,xslant=-0.4,yscale=0.8,->]
    (Q0)+(-\R,0,0) arc [start angle=180,end angle=120,radius=\R]
    node[midway,above=1pt,left=1pt] {$\theta^*_-$};

\end{tikzpicture}


% FALSE PERSPECTIVE - Higgs to top quark pair
\small
\tdplotsetmaincoords{90}{90} % look straight at yz plane
\begin{tikzpicture}[tdplot_main_coords,scale=0.85]

  \def\W{5}
  \def\w{2.5}
  \def\R{0.65}

  \coordinate (A)  at (0,-\W, 0);
  \coordinate (O)  at (0,  0, 0);
  \coordinate (B)  at (0, \W, 0);

  \coordinate (P1) at (0,  0,   2);
  \coordinate (P2) at (0, \W,   2);
  \coordinate (P3) at (0, \W,  -2);
  \coordinate (P4) at (0,  0,  -2);
  \coordinate (P0) at (0, \w,   0);
  \coordinate (F1) at (0,3.5, 1.5);
  \coordinate (F2) at (0,1.5,-1.5);

  \coordinate (phi) at (0,0,1.3);

  \begin{scope}[xslant=-0.4,yscale=0.8]
    \coordinate (Q1) at (0, -\W,   2);
    \coordinate (Q2) at (0,   0,   2);
    \coordinate (Q3) at (0,   0,  -2);
    \coordinate (Q4) at (0, -\W,  -2);
    \coordinate (Q0) at (0, -\w,   0);
    \coordinate (F3) at (0,-3.3, 1.5);
    \coordinate (F4) at (0,-1.7,-1.5);
  \end{scope}

  % plane 2
  \draw[thick]
        (Q1) %node at (Q1) {Q1}
     -- (Q2) %node at (Q2) {Q2}
     -- (Q3) %node at (Q3) {Q3}
     -- (Q4) %node at (Q4) {Q4}
     -- (Q1);

  % plane 1 - filled white
  \fill[color=white,thick,draw=black]
        (P1) -- (P2) -- (P3) -- (P4) -- cycle;

  % plane 2 - dashes corner
  \begin{scope}
    \clip (P1) -- (P2) -- (P3) -- (P4) -- cycle;
    \draw[dashed,thick] (Q2) -- (Q3) -- (Q4);
  \end{scope}

  % axis and arrows
  \draw[dashed,thick]
    (A)  -- (Q0);
  \draw[dashed,thick]
    (B)  -- (P0);
  \draw[thick,->]
    (O)  -- node[red,below=-1pt]       {t} (P0);
  \draw[thick,->]
    (O)  -- node[red,below right=-2pt] {$\overline{\textrm{t}}$} (Q0);
  \draw[thick,decorate,decoration={snake}] % ,post length=0mm
    (F1) -- node[red,above left=-2pt]  {W$^+$} (P0);
  \draw[thick,->]
    (P0) -- node[red,below right=-1pt] {b} (F2);
  \draw[thick,decorate,decoration={snake,post length=0mm}]
    (F3) -- node[red,above right=-1pt] {W$^-$} (Q0);
  \draw[thick,->]
    (Q0) -- node[red,below left=-1pt]  {$\overline{\textrm{b}}$} (F4);

  % dots
  \fill[blue] (O) circle [radius=4pt];
    \node [above=8pt,right=1pt,blue] at (O) {H}; % needs extra package
  %\fill (P0) circle [radius=2pt];
  %\fill (Q0) circle [radius=2pt];

  % angles
  \draw[canvas is yz plane at x=0,rotate around z=20,->]
    (phi) arc [start angle=90,end angle=118,radius=1]
    node at (phi) [right=0pt] {$\phi^*$};
  \draw[canvas is yz plane at x=0,->]
    (P0)+(\R,0,0)  arc [start angle=0,end angle=55,radius=\R]
    node[midway,above=1pt,right=1pt] {$\theta^*_+$};
  \draw[canvas is yz plane at x=0,xslant=-0.4,yscale=0.8,->]
    (Q0)+(-\R,0,0) arc [start angle=180,end angle=120,radius=\R]
    node[midway,above=1pt,left=1pt] {$\theta^*_-$};

\end{tikzpicture}


% FALSE PERSPECTIVE - Higgs to top quark pair
\small
\tdplotsetmaincoords{90}{90} % look straight at yz plane
\begin{tikzpicture}[tdplot_main_coords,scale=0.85]

  \def\W{5}
  \def\w{2.5}
  \def\R{0.65}

  \coordinate (A)  at (0,-\W, 0);
  \coordinate (O)  at (0,  0, 0);
  \coordinate (B)  at (0, \W, 0);

  \coordinate (P1) at (0,  0,   2);
  \coordinate (P2) at (0, \W,   2);
  \coordinate (P3) at (0, \W,  -2);
  \coordinate (P4) at (0,  0,  -2);
  \coordinate (P0) at (0, \w,   0);
  \coordinate (F1) at (0,3.5, 1.5);
  \coordinate (F2) at (0,1.5,-1.5);

  \coordinate (phi) at (0,0,1.3);

  \begin{scope}[xslant=-0.4,yscale=0.8]
    \coordinate (Q1) at (0, -\W,   2);
    \coordinate (Q2) at (0,   0,   2);
    \coordinate (Q3) at (0,   0,  -2);
    \coordinate (Q4) at (0, -\W,  -2);
    \coordinate (Q0) at (0, -\w,   0);
    \coordinate (F3) at (0,-3.3, 1.5);
    \coordinate (F4) at (0,-1.7,-1.5);
  \end{scope}

  % plane 2
  \draw[thick]
        (Q1) %node at (Q1) {Q1}
     -- (Q2) %node at (Q2) {Q2}
     -- (Q3) %node at (Q3) {Q3}
     -- (Q4) %node at (Q4) {Q4}
     -- (Q1);

  % plane 1 - filled white
  \fill[color=white,thick,draw=black]
        (P1) -- (P2) -- (P3) -- (P4) -- cycle;

  % plane 2 - dashes corner
  \begin{scope}
    \clip (P1) -- (P2) -- (P3) -- (P4) -- cycle;
    \draw[dashed,thick] (Q2) -- (Q3) -- (Q4);
  \end{scope}

  % axis and arrows
  \draw[dashed,thick]
    (A)  -- (Q0);
  \draw[dashed,thick]
    (B)  -- (P0);
  \draw[thick,->,decorate,decoration={snake,post length=5}]
    (O)  -- node[red,below=2pt]       {$V$} (P0);
  \draw[thick,->,decorate,decoration={snake,post length=5}]
    (O)  -- node[red,below right=2pt] {$V$} (Q0);
  \draw[thick,->] % ,post length=0mm
    (P0) -- node[red,above left=-2pt]  {$f_1$} (F1);
  \draw[thick,->]
    (P0) -- node[red,below right=-1pt] {$\bar{f_2}$} (F2);
  \draw[thick,->]
    (Q0) -- node[red,above right=-1pt] {$f_3$} (F3);
  \draw[thick,->]
    (Q0) -- node[red,below left=-1pt]  {$\bar{f_4}$} (F4);

  % dots
  \fill[blue] (O) circle [radius=4pt];
    \node [above=8pt,right=1pt,blue] at (O) {H}; % needs extra package
  %\fill (P0) circle [radius=2pt];
  %\fill (Q0) circle [radius=2pt];

  % angles
  \draw[canvas is yz plane at x=0,rotate around z=20,->]
    (phi) arc [start angle=90,end angle=118,radius=1]
    node at (phi) [right=0pt] {$\phi^*$};
  \draw[canvas is yz plane at x=0,->]
    (P0)+(\R,0,0)  arc [start angle=0,end angle=55,radius=\R]
    node[midway,above=1pt,right=1pt] {$\theta^*_+$};
  \draw[canvas is yz plane at x=0,xslant=-0.4,yscale=0.8,->]
    (Q0)+(-\R,0,0) arc [start angle=180,end angle=120,radius=\R]
    node[midway,above=1pt,left=1pt] {$\theta^*_-$};

\end{tikzpicture}


% PERSPECTIVE
%\tdplotsetmaincoords{70}{110}     % point of view
%\begin{tikzpicture}[tdplot_main_coords]
%
%  \coordinate (P1) at (0, 0, 2); %(0,2,0);
%  \coordinate (P2) at (0, 6, 2); %(4,2,0);
%  \coordinate (P3) at (0, 6,-2);%(4,-2,0);
%  \coordinate (P4) at (0, 0,-2);%(0,-2,0);
%
%  \begin{scope}[rotate around y=40,scale=1]
%    \coordinate (Q1) at (0,-6, 2);
%    \coordinate (Q2) at (0, 0, 2);
%    \coordinate (Q3) at (0, 0,-2);
%    \coordinate (Q4) at (0,-6,-2);
%  \end{scope}
%
%  % plane 1
%  \draw[thick]
%        (P1) node at (P1) {P1}
%     -- (P2) node at (P2) {P2}
%     -- (P3) node at (P3) {P3}
%     -- (P4) node at (P4) {P4}
%     -- (P1);
%
%  % plane 2
%  \draw[thick] (Q1) node at (Q1) {Q1}
%     -- (Q2) node at (Q2) {Q2}
%     -- (Q3) node at (Q3) {Q3}
%     -- (Q4) node at (Q4) {Q4}
%     -- (Q1);
%
%\end{tikzpicture}


\end{document}
Click to download: decay_planes.tex • decay_planes.pdf
Open in Overleaf: decay_planes.tex


