Edit and compile if you like:
% Author: Izaak Neutelings (June, 2017)
% based on code from a friend

\documentclass[border=3pt,tikz]{standalone}
\usepackage{amsmath} % for \dfrac
\usepackage{tikz}
\tikzset{>=latex} % for LaTeX arrow head
\usepackage{pgfplots} % for the axis environment

\begin{document}


% DRAW PLOT: sin, cos, tan
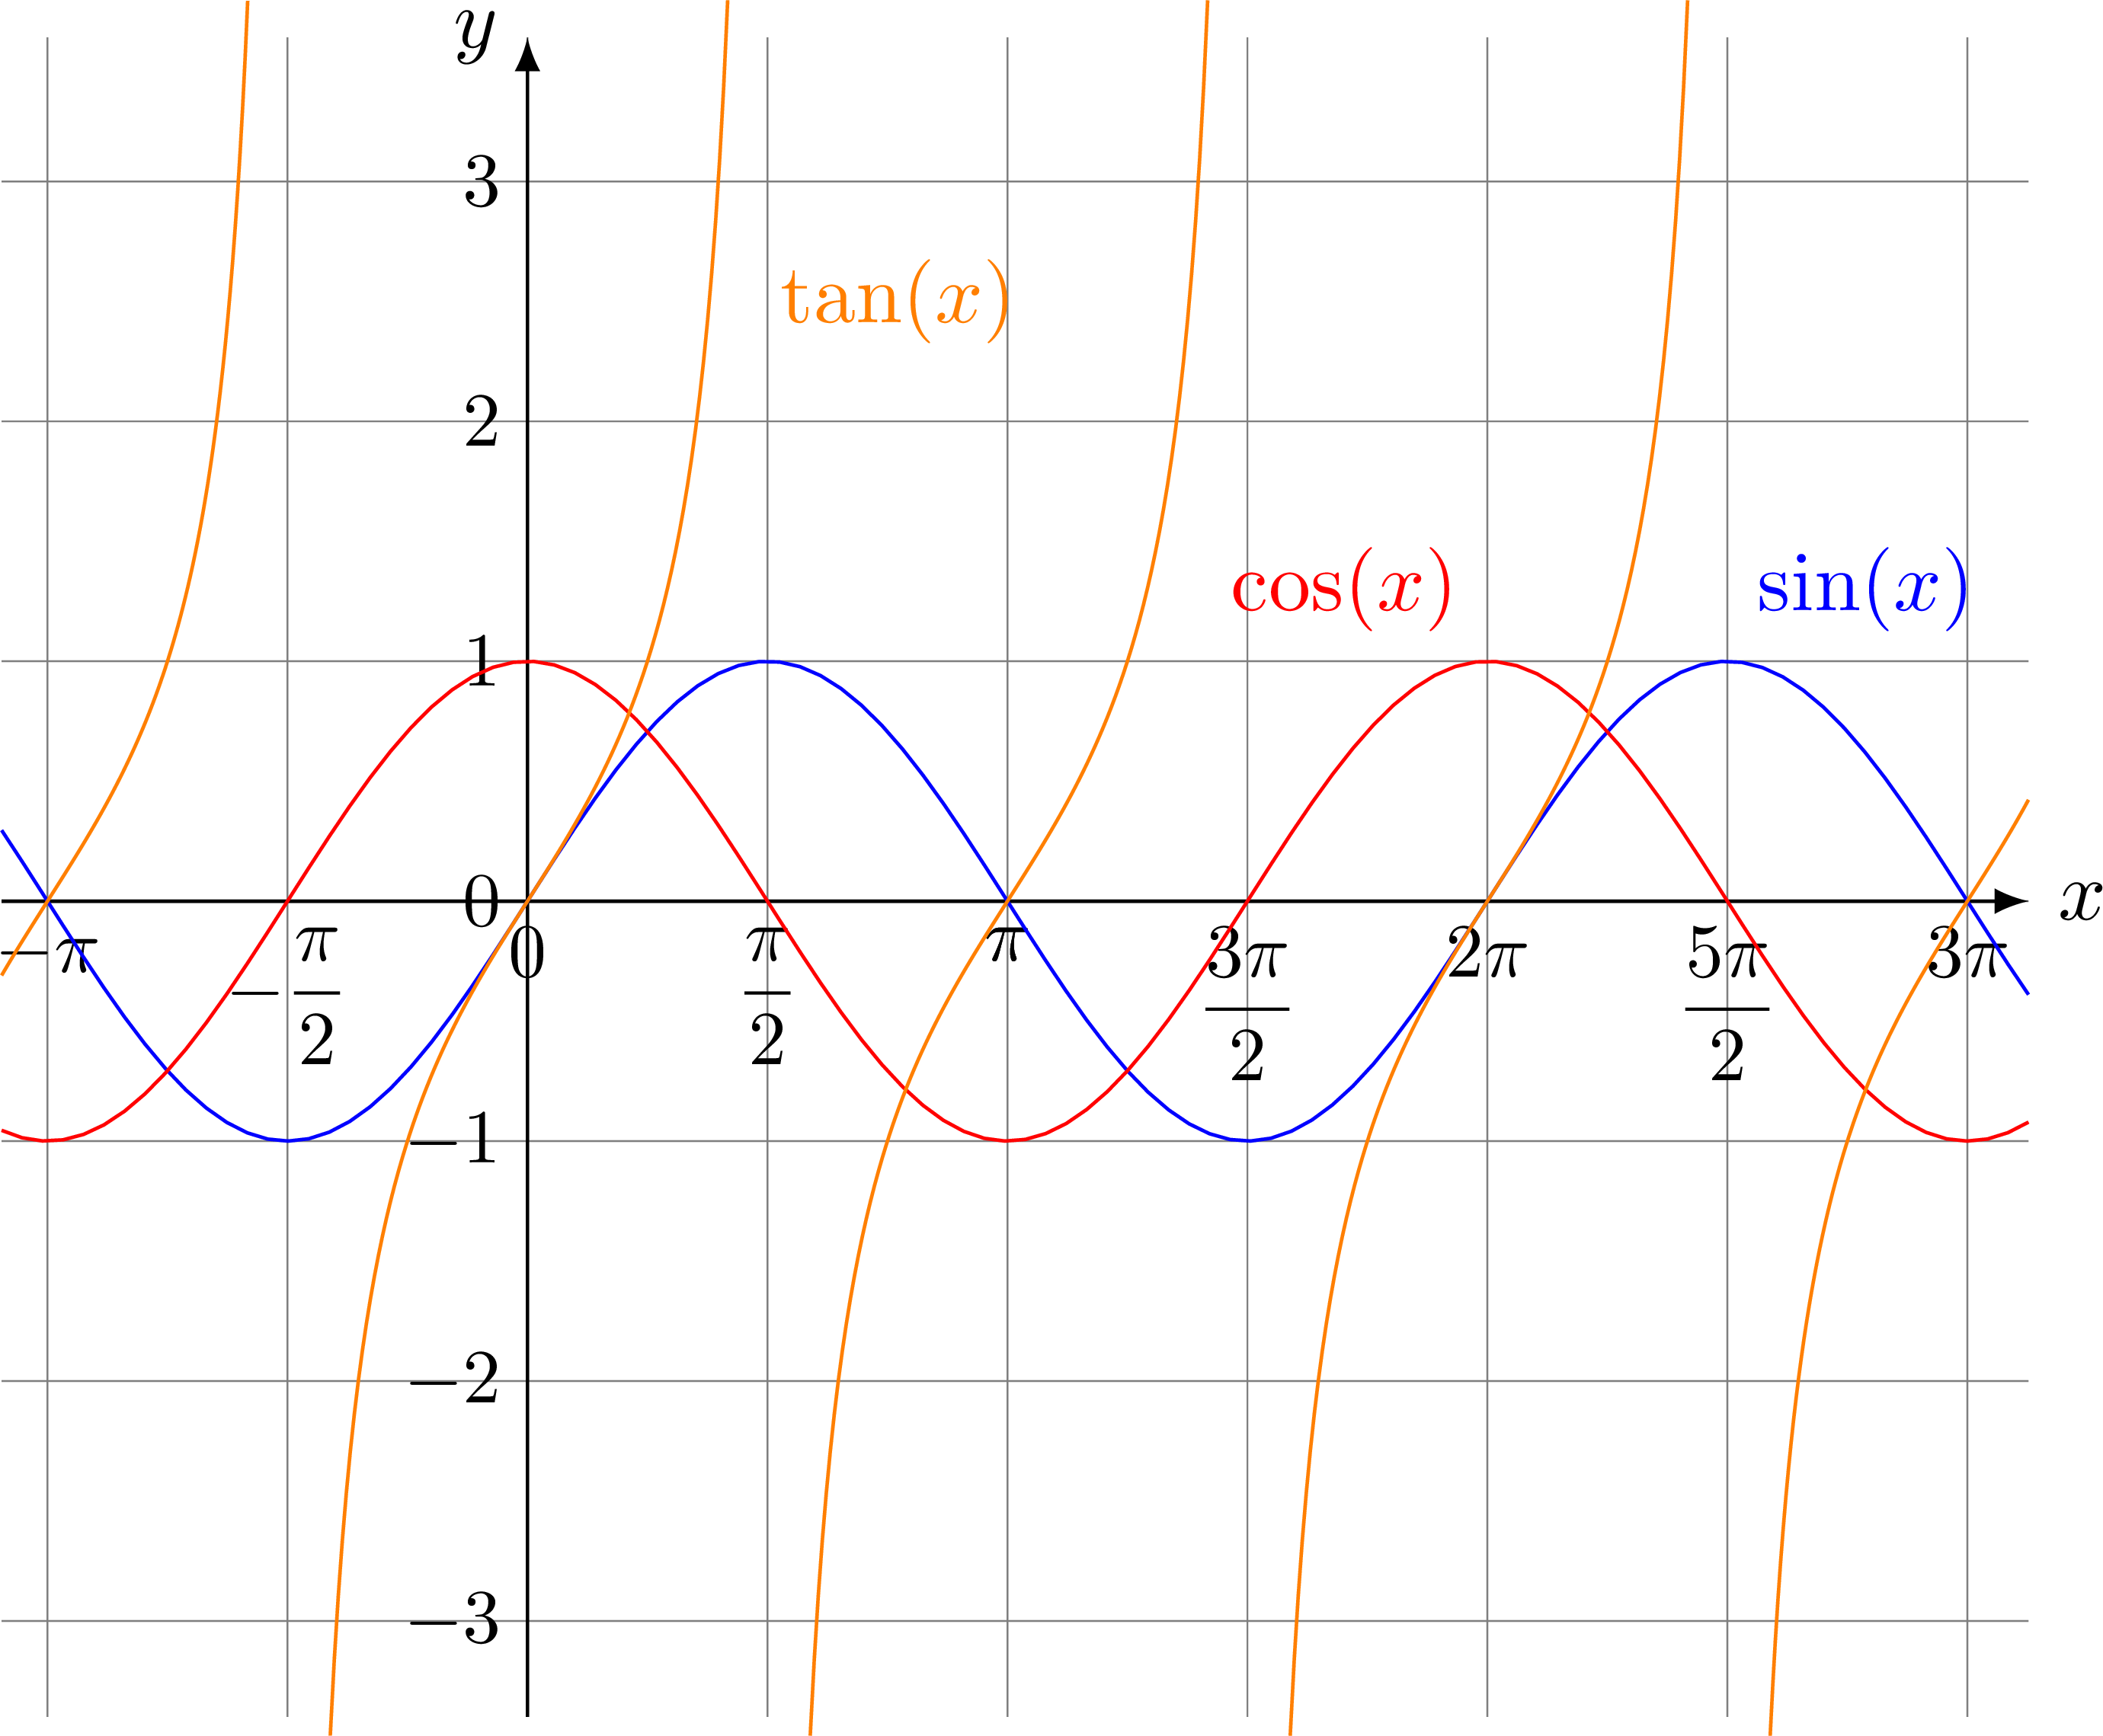
\begin{tikzpicture}[domain=-pi:pi,xscale=2/pi]
%https://tex.stackexchange.com/questions/45151/format-numbers-as-a-fraction-of-pi-with-tikz-pgfmathprintnumber

  % limits
  \def\xa{ -pi-0.3}
  \def\xb{3*pi+0.4}
  \def\ya{-3.4}
  \def\yb{ 3.6}
  \def\N{100} % number of points

  % axes & grid
  \draw[xstep=pi/2,very thin, color=gray]
    (\xa,\ya) grid (\xb,\yb);
  \draw[->]
    (\xa,0) -- (\xb,0)
    node[right] {$x$};
  \draw[->]
    (0,\ya) -- (0,\yb)
    node[left] {$y$};

  % ticks
  \draw[] % x
  	node[below,scale=0.9] at ( -pi,   0) {$-\pi$}
  	node[below,scale=0.9] at ( -pi/2, 0) {$-\dfrac{\pi}{2}$}
  	node[below,scale=0.9] at (     0, 0) {0}
  	node[below,scale=0.9] at (  pi/2, 0) {$\dfrac{\pi}{2}$}
  	node[below,scale=0.9] at (  pi,   0) {$\pi$}
  	node[below,scale=0.9] at (3*pi/2, 0) {$\dfrac{3\pi}{2}$}
  	node[below,scale=0.9] at (2*pi,   0) {$2\pi$}
  	node[below,scale=0.9] at (5*pi/2, 0) {$\dfrac{5\pi}{2}$}
  	node[below,scale=0.9] at (3*pi,   0) {$3\pi$};
  \draw[] % y
  	node[left,scale=0.9] at ( 0,  3) {$3$}
  	node[left,scale=0.9] at ( 0,  2) {$2$}
  	node[left,scale=0.9] at ( 0,  1) {$1$}
  	node[left,scale=0.9] at ( 0,  0) {$0$}
  	node[left,scale=0.9] at ( 0, -1) {$-1$}
  	node[left,scale=0.9] at ( 0, -2) {$-2$}
  	node[left,scale=0.9] at ( 0, -3) {$-3$};

  % functions
  \def\ea{0.28}
  \def\eb{0.26}
  \draw[color=blue,samples=\N,domain=\xa:\xb] % SIN
    plot(\x,{sin(\x r)}) % r for radians
    node[above right] at (5*pi/2,1) {$\sin(x)$};
  \draw[color=red,samples=\N,domain=\xa:\xb] % COS
    plot(\x,{cos(\x r)})
    node[above left] at (2*pi,1) {$\cos(x)$};
  \draw[color=orange] % TAN
    plot[samples=\N,domain=  \xa     :   -pi/2-\eb] (\x, {tan(\x r)})
    plot[samples=\N,domain=  -pi/2+\ea:   pi/2-\eb] (\x, {tan(\x r)})
    plot[samples=\N,domain=   pi/2+\ea: 3*pi/2-\eb] (\x, {tan(\x r)})
    plot[samples=\N,domain= 3*pi/2+\ea: 5*pi/2-\eb] (\x, {tan(\x r)})
    plot[samples=\N,domain= 5*pi/2+\ea:  \xb      ] (\x, {tan(\x r)})
    node[samples=\N,right=-2pt] at (pi/2,2.5) {$\tan(x)$};

\end{tikzpicture}


% AXIS ENVIRONMENT: sin, cos, tan
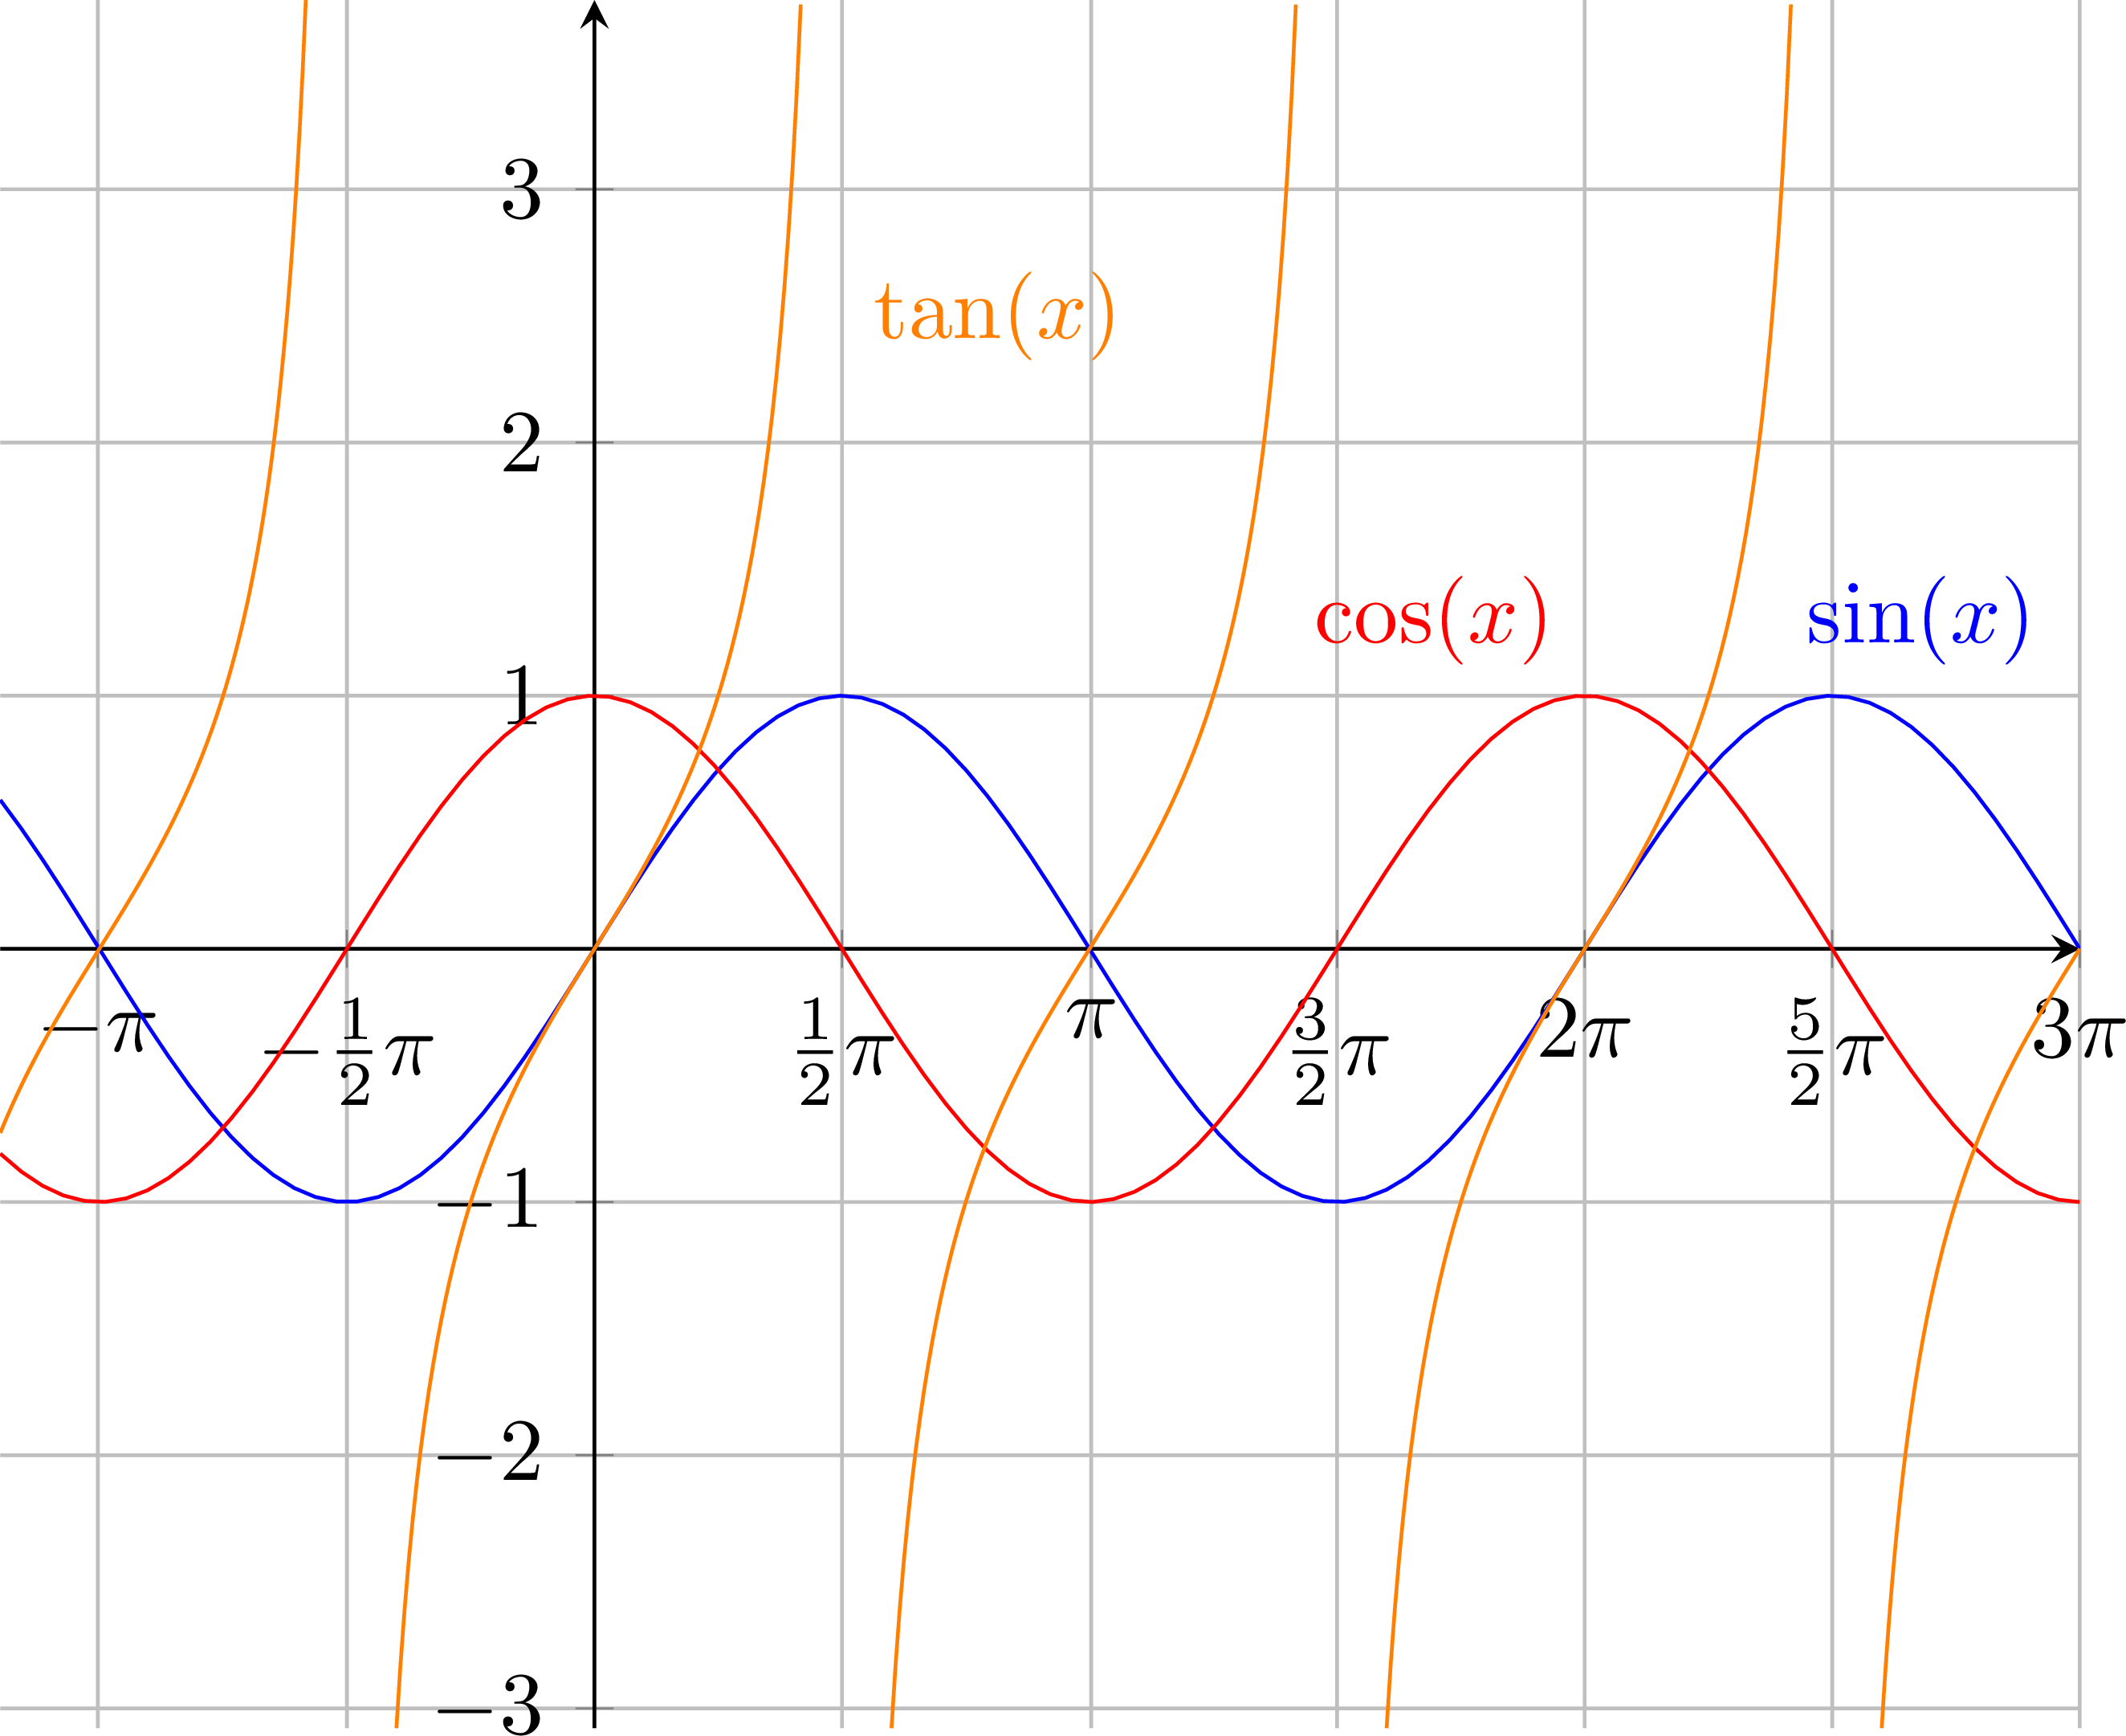
\begin{tikzpicture}
\begin{axis}[enlargelimits=false,
             axis lines=middle,
             scale=1.2,
             xtick={-3.15159, -1.57080, 0,
                     1.57080,  3.15159, 4.71239,
                     6.28318,  7.85398, 9.42478 },
             xticklabels={$-\pi$, $-\frac{1}{2}\pi$, 0,
                          $\frac{1}{2}\pi$, $\pi$, $\frac{3}{2}\pi$,
                          $2\pi$, $\frac{5}{2}\pi$, $3\pi$ },
             ytick={-3,-2,-1,0,1,2,3},
             grid=major, % only a grid on the defined ticks
             samples=100 % number of points
             ]

  % sin
  \addplot[blue,no marks,domain=-1.2*pi:3*pi]{sin(deg(x))}; % deg to convert radians
  \node[right=10pt,above] at (axis cs:5*pi/2,1){\color{blue}$\sin(x)$};

  % cos
  \addplot[red,no marks,domain=-1.2*pi:3*pi] {cos(deg(x))};
  \node[above left] at (axis cs:2*pi,1){\color{red}$\cos(x)$};

  % tan, multiple parts because of singularities
  \addplot[orange,no marks,domain=-1.2*pi:-0.583*pi, ]{tan(deg(x))};
  \addplot[orange,no marks,domain=-0.4*pi:5*pi/12,   ]{tan(deg(x))};
  \addplot[orange,no marks,domain=27*pi/45:17*pi/12, ]{tan(deg(x))};
  \addplot[orange,no marks,domain=1.6*pi:29*pi/12,   ]{tan(deg(x))};
  \addplot[orange,no marks,domain=2.6*pi:36*pi/12,   ]{tan(deg(x))};
  \node[right] at (axis cs:pi/2,2.5){\color{orange}$\tan(x)$};

\end{axis}
\end{tikzpicture}


% AXIS ENVIRONMENT: arcsin, arccos, arctan
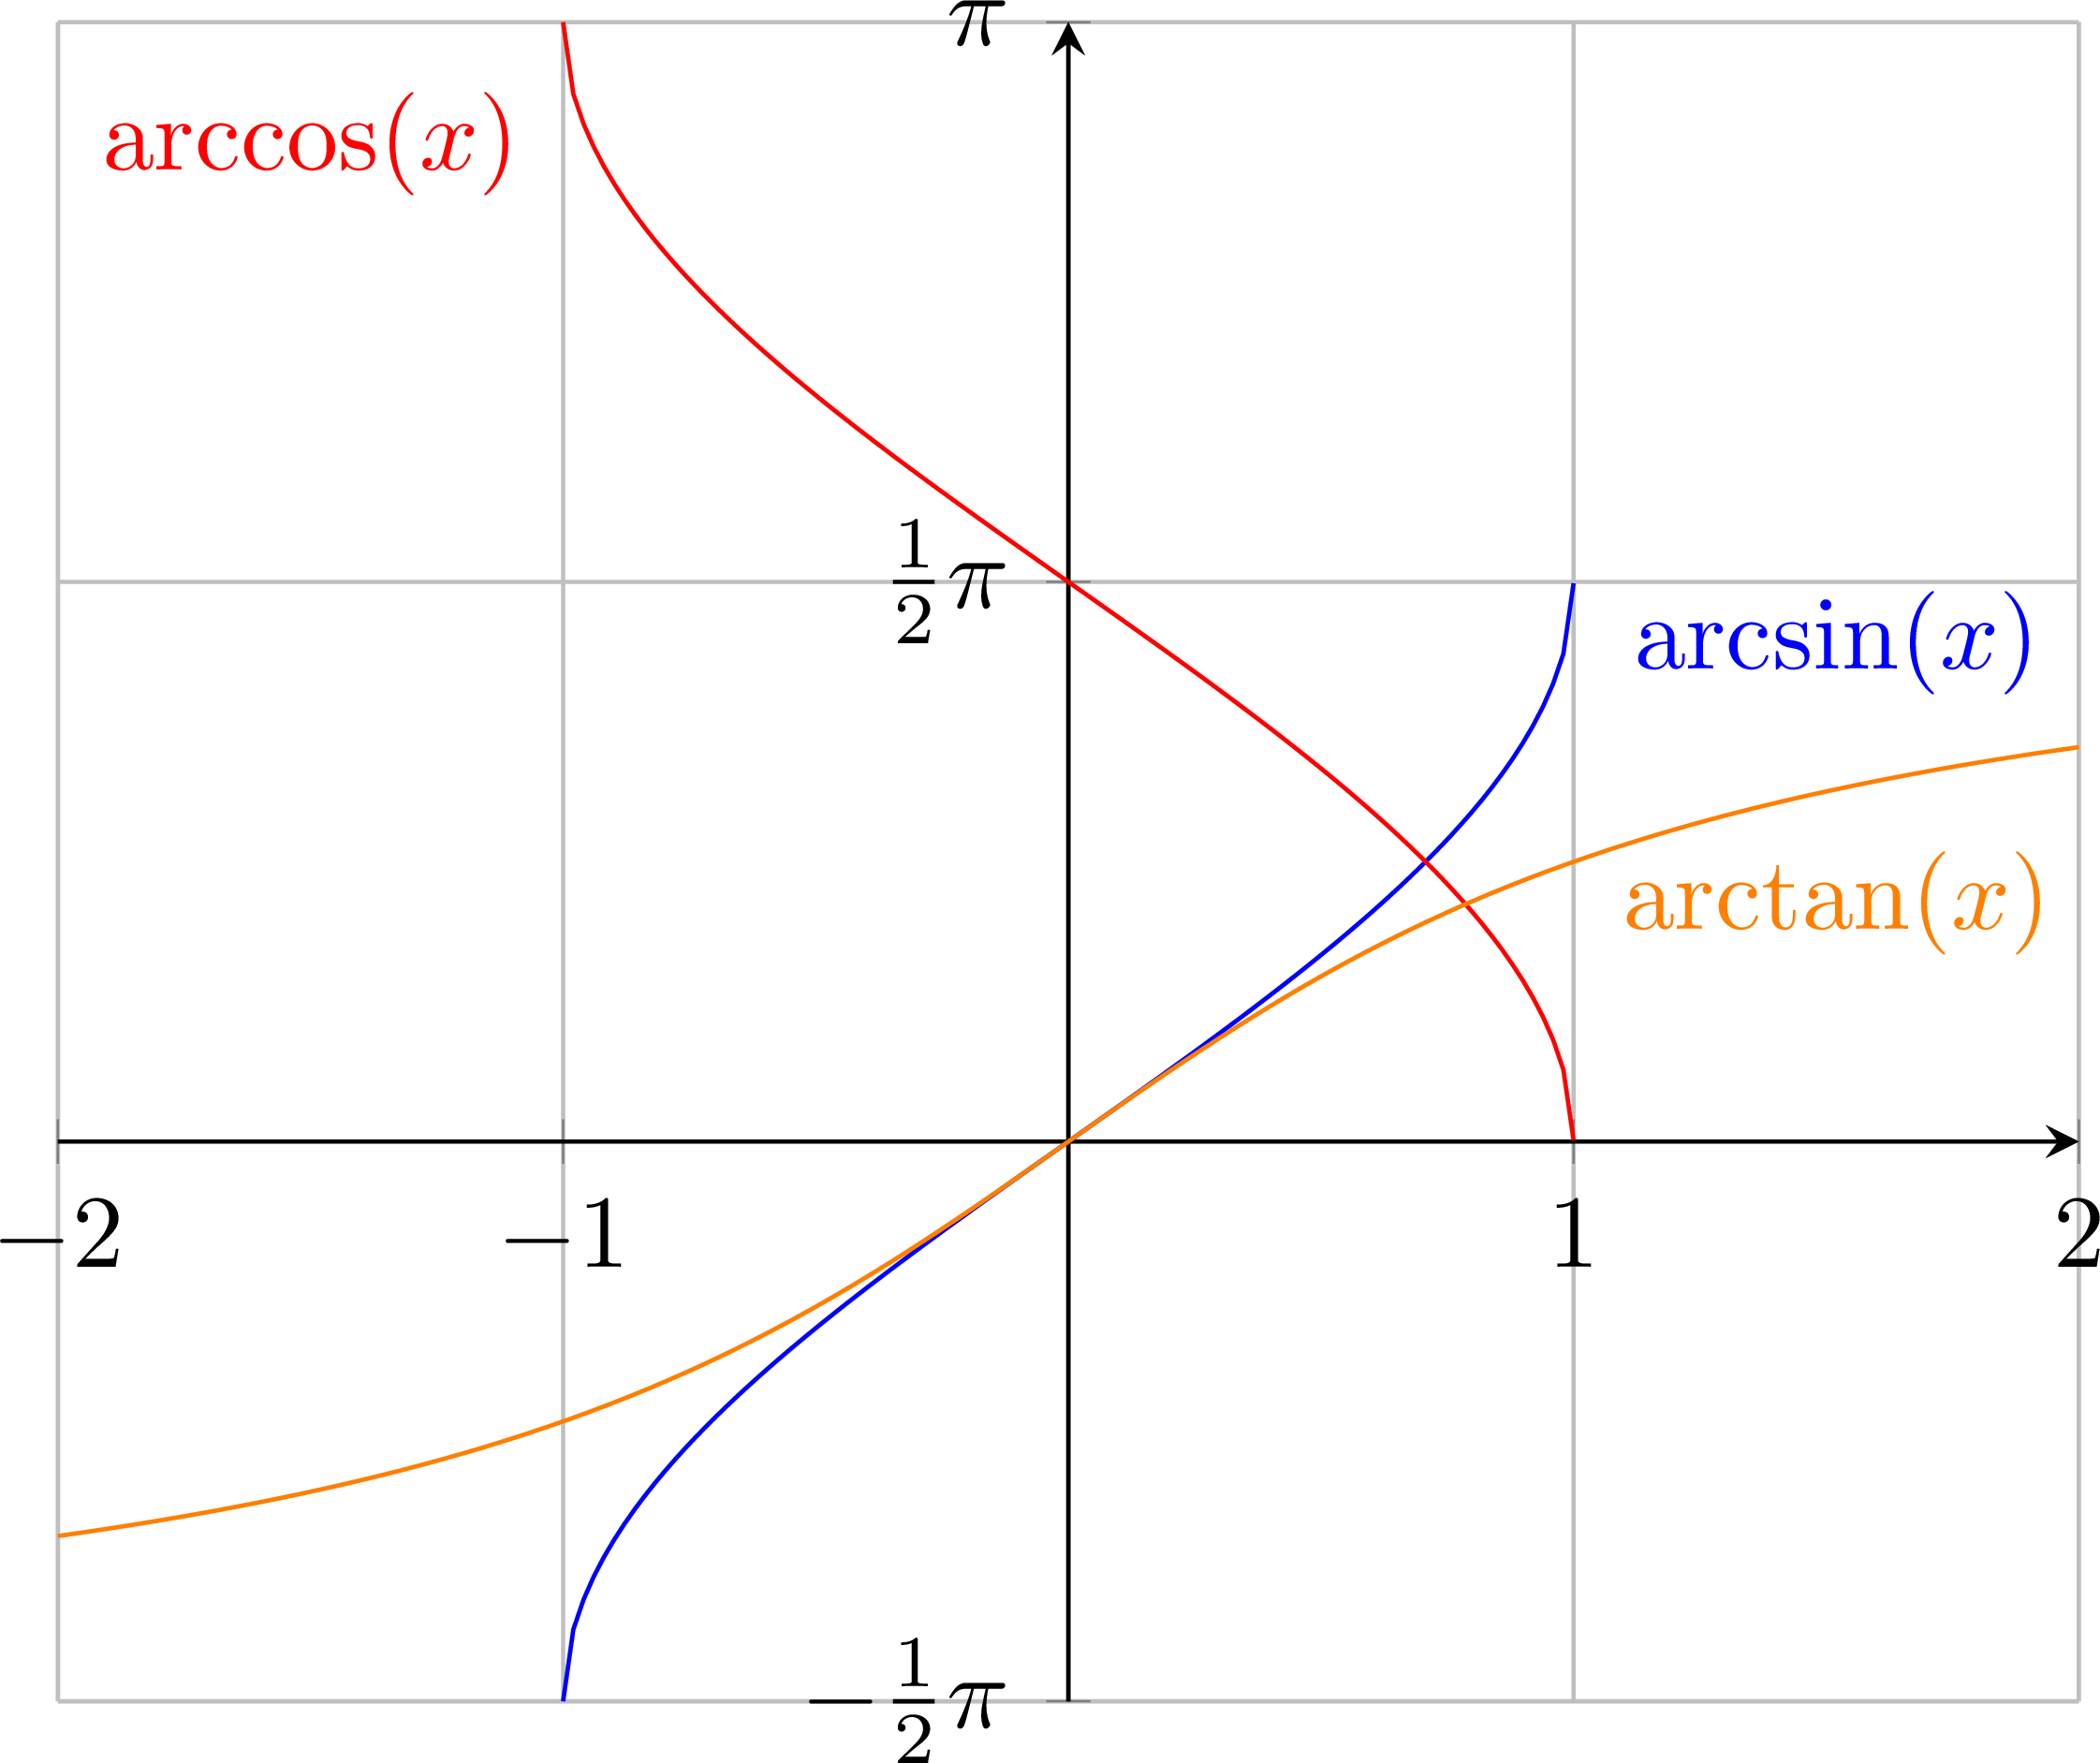
\begin{tikzpicture}
\begin{axis}[enlargelimits=false,
             axis lines=middle,
             xtick={-2,-1,0,1,2},
             ytick={-1.570780, 1.570780, 3.14159},
             yticklabels={$-\frac{1}{2}\pi$,$\frac{1}{2}\pi$,$\pi$},
             grid=major,
             samples=100
             ]

  % arcsin
  \addplot[domain=-1:1,no marks,blue] {rad(asin(x))};
  \node at (axis cs:1.52,1.4){\color{blue}$\arcsin(x)$};

  % arccos
  \addplot[domain=-1:1,no marks,red] {rad(acos(x))};
  \node at (axis cs:-1.5,2.8){\color{red}$\arccos(x)$};

  % arctan
  \addplot[domain=-2:2,no marks,orange] {rad(atan(x))};
  \node at (axis cs:1.52,.67){\color{orange}$\arctan(x)$};

\end{axis}
\end{tikzpicture}


\end{document}
Click to download: functions.tex • functions.pdf
Open in Overleaf: functions.tex



Nice work your graphs of trigonometric function! I have just noticed that line 42 is a duplicate of line 39.