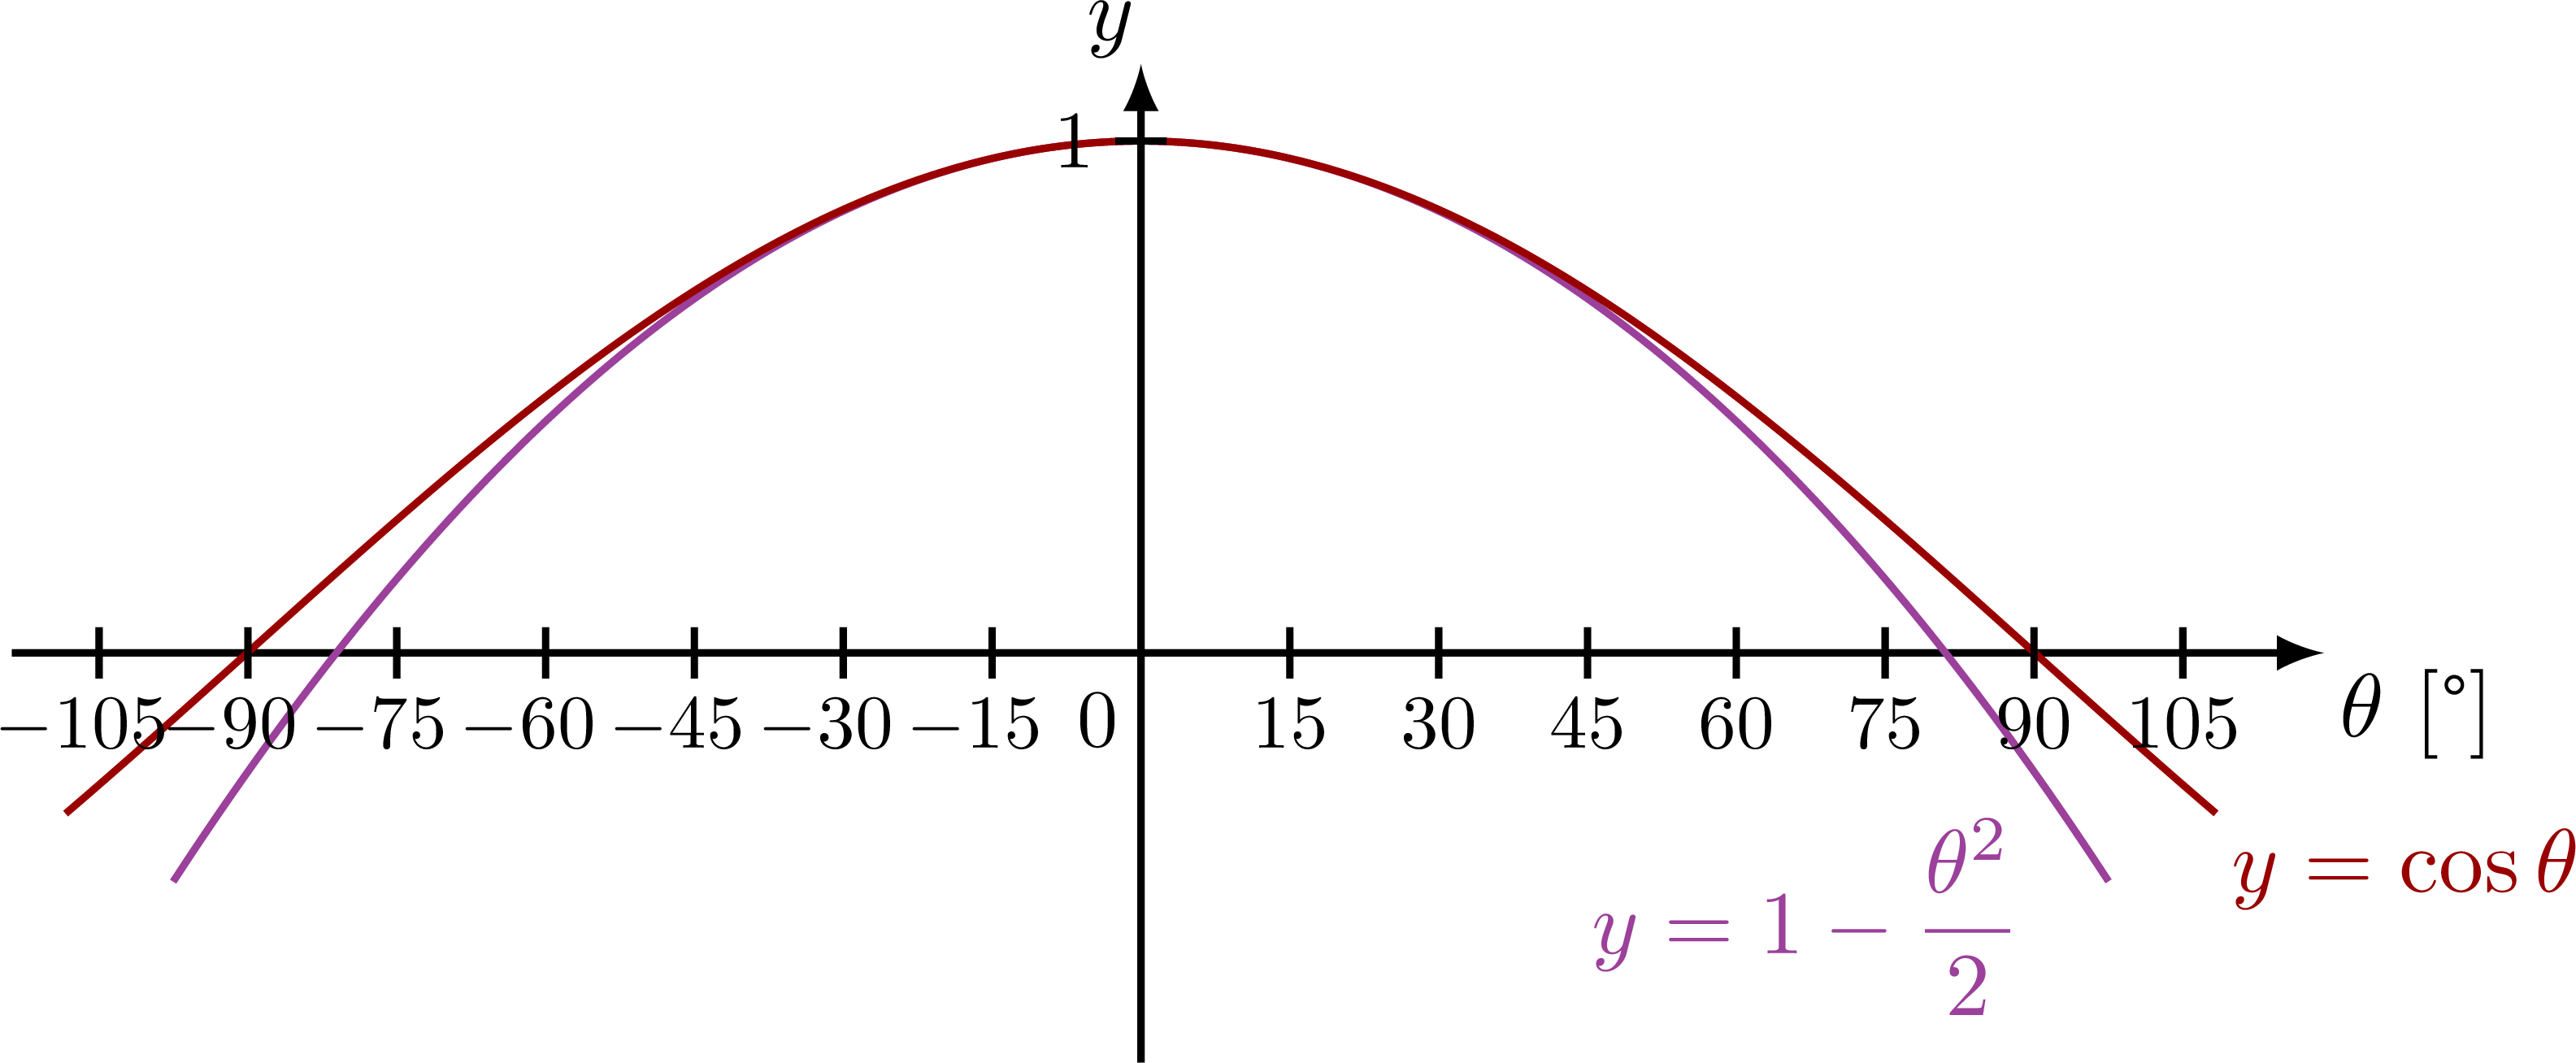
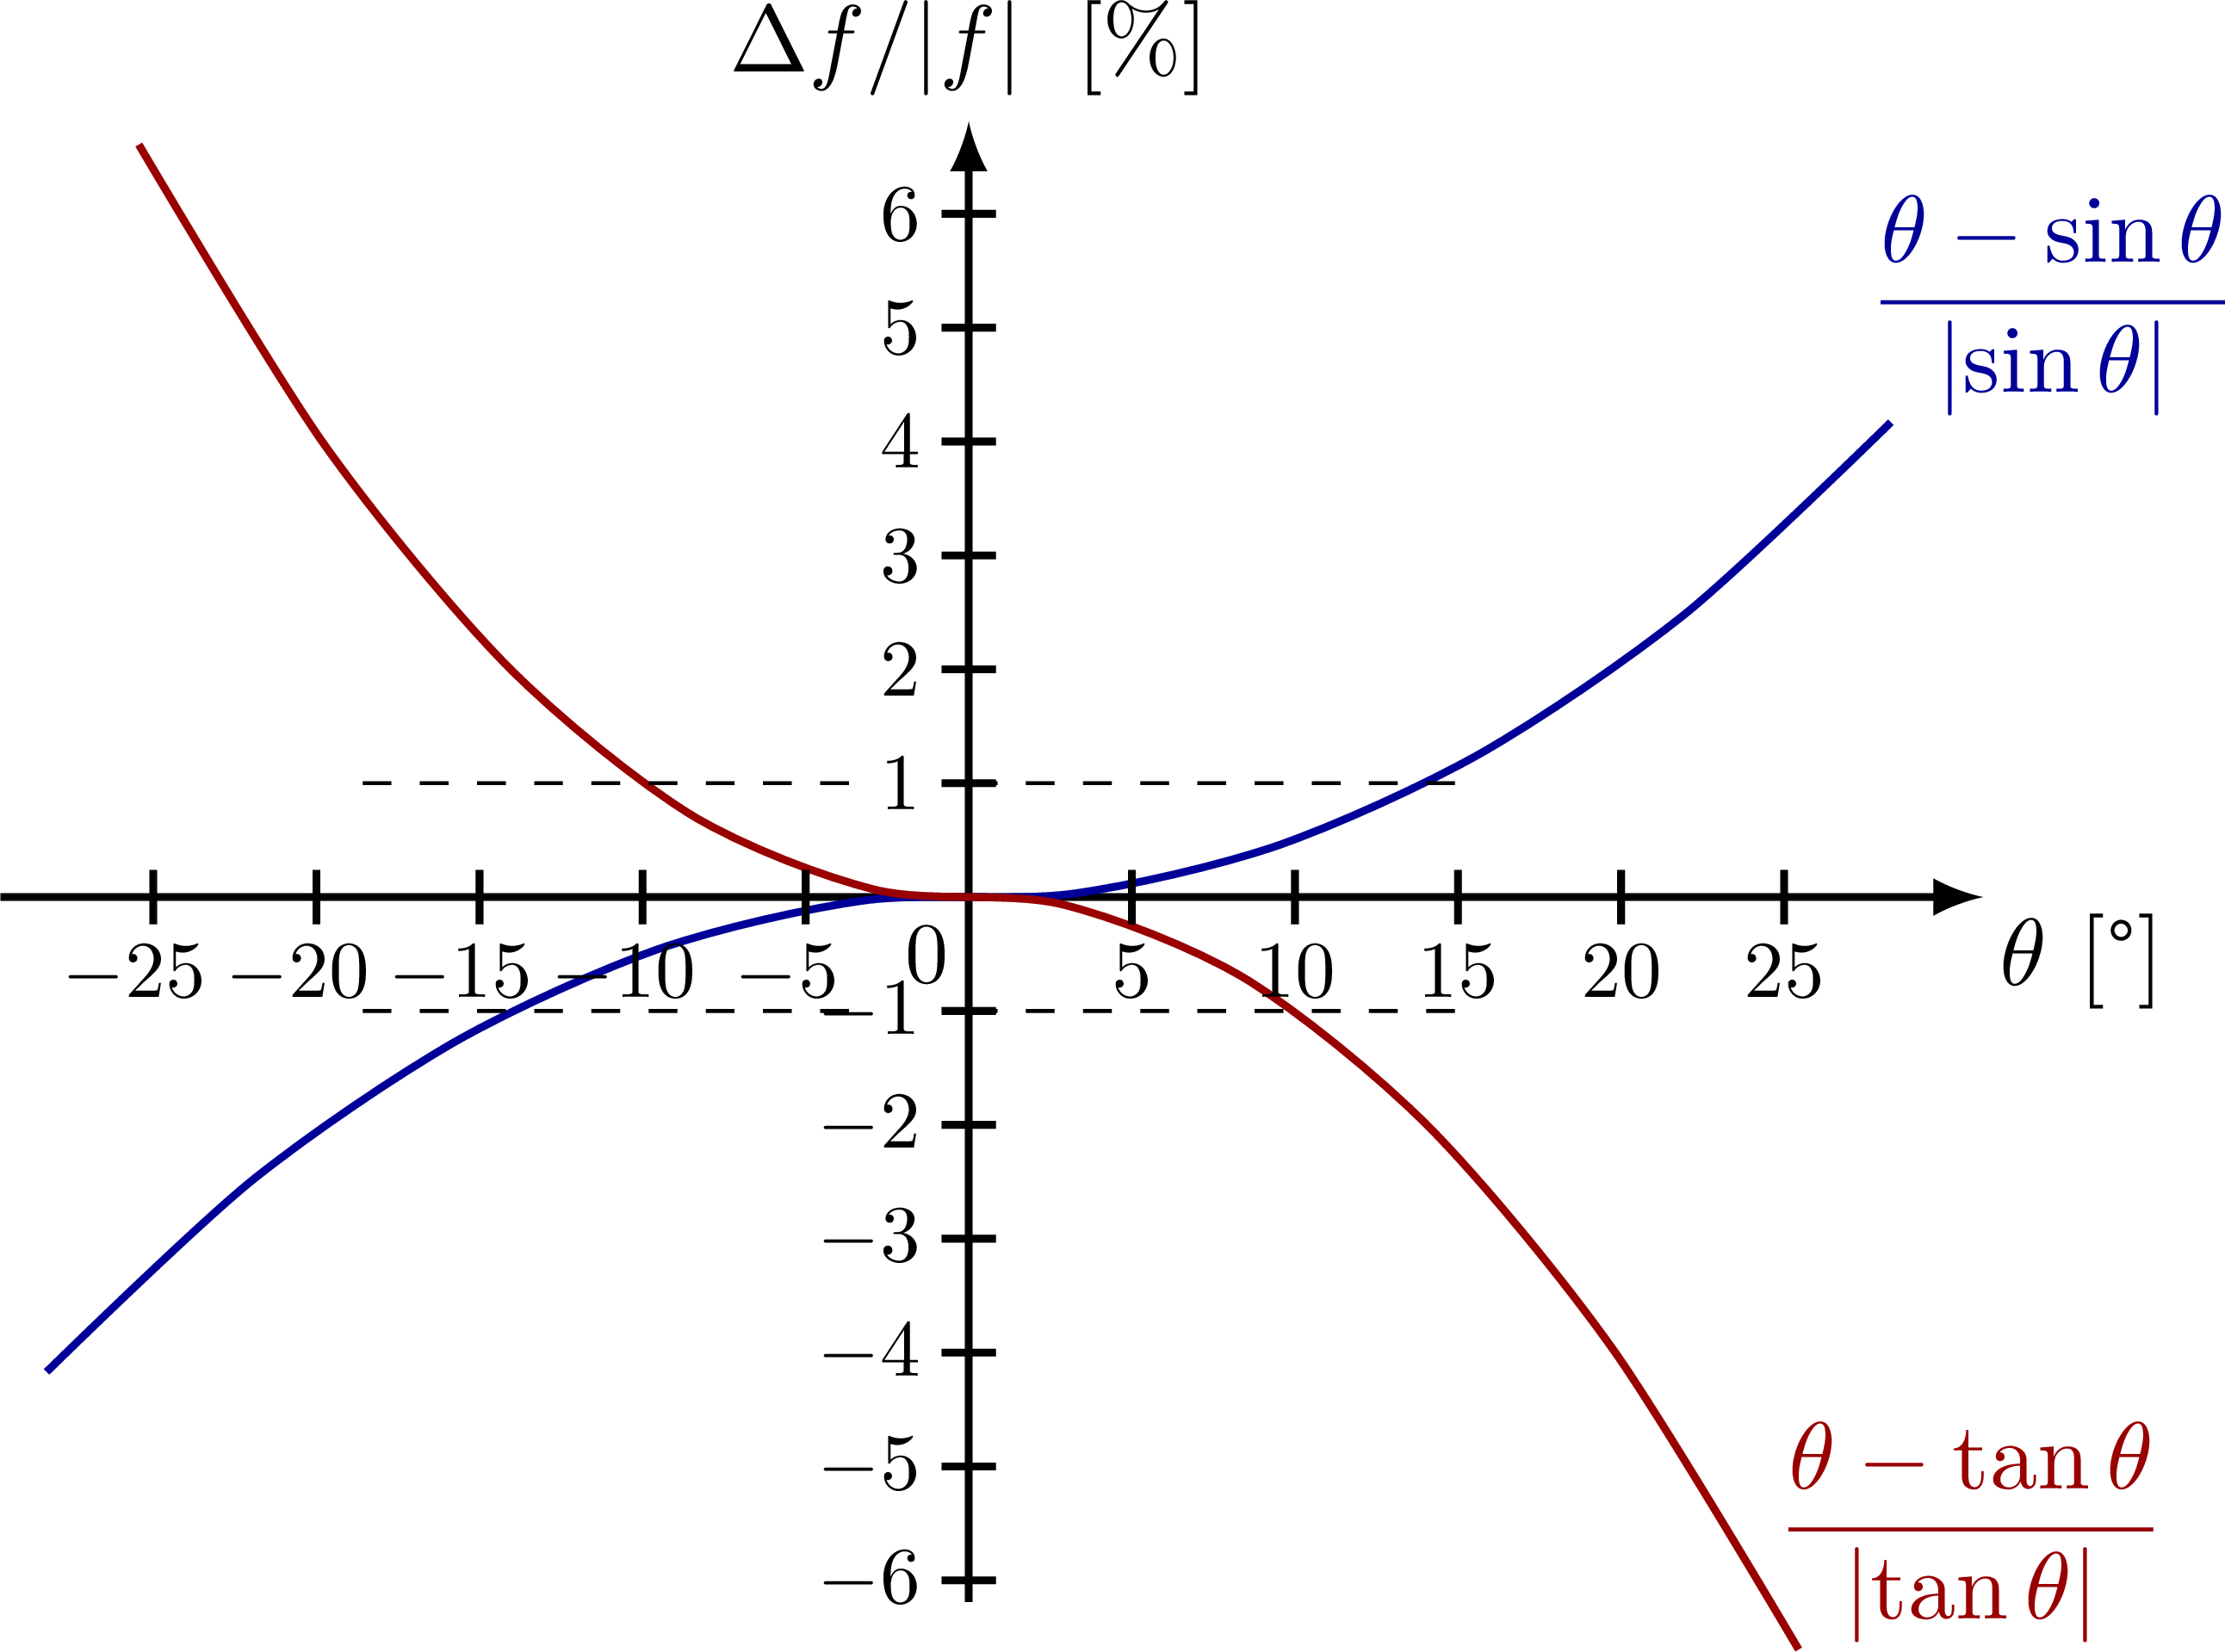
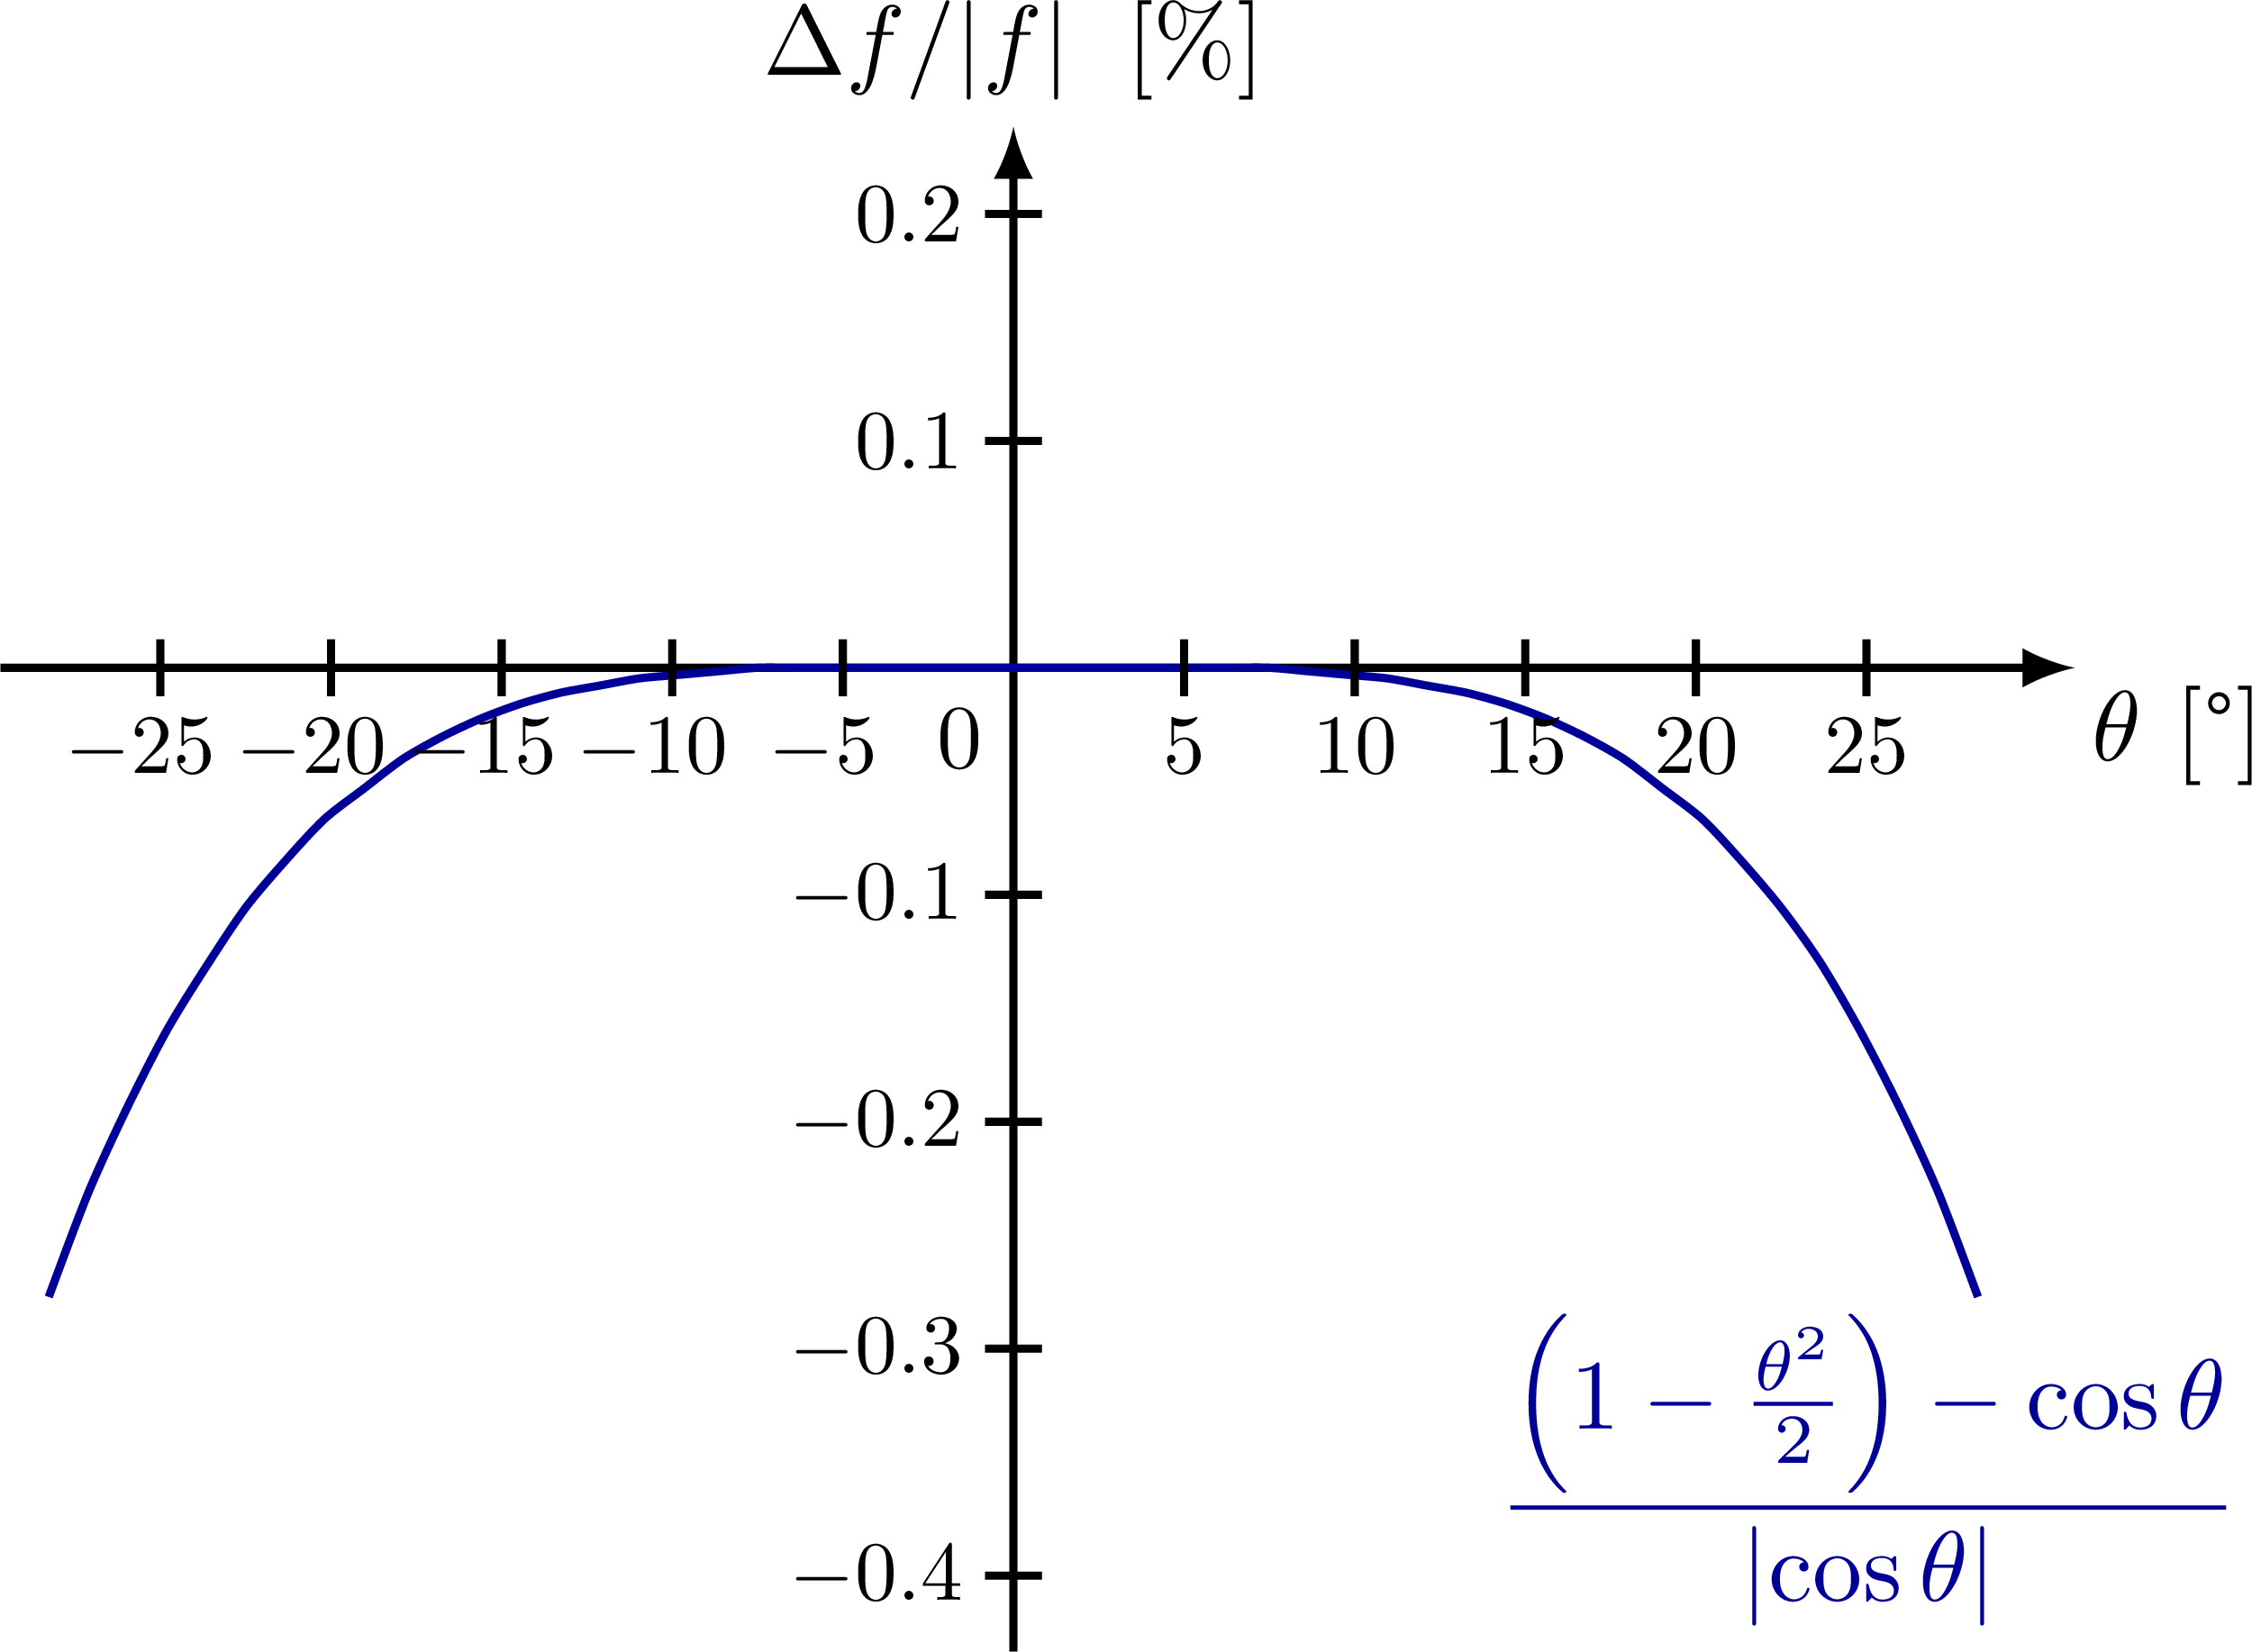
Small-angle approximation of sine, cosine and tangent, and their relative error.
For more on the pendulums, please see the “pendulum” tag . For more on the small-angle approximation, please see the “Taylor expansion” tag .
Edit and compile if you like:
% Author: Izaak Neutelings (June 2020)
\documentclass[border=3pt,tikz]{standalone}
\usepackage{amsmath} % for \text
\usepackage[outline]{contour} % glow around text
\usepackage{physics}
\usepackage{siunitx}
\usepackage{xcolor}
\usepackage{etoolbox} %ifthen
\usetikzlibrary{calc}
\usetikzlibrary{arrows,arrows.meta}
\usetikzlibrary{decorations.markings}
\usetikzlibrary{angles,quotes} % for pic (angle labels)
%\usetikzlibrary{fadings}
\usepackage{etoolbox} % ifthen
\tikzset{>=latex} % for LaTeX arrow head
\contourlength{1.6pt}

\colorlet{myblue}{blue!60!black}
\colorlet{myred}{red!60!black}
\colorlet{mypurple}{red!50!blue!95!black!75}
\colorlet{mygreen}{green!60!black}
\tikzstyle{mydashed}=[black!70,dashed,thin]
\tikzstyle{mymeas}=[{Latex[length=3,width=2]}-{Latex[length=3,width=2]},thin]
\tikzstyle{mysmallarr}=[-{Latex[length=3,width=2]}]

\tikzset{
  declare function={reldiff(\x,\y) = (\x-\y)/abs(\y);}
}
\def\tick#1#2{\draw[thick] (#1) ++ (#2:0.1) --++ (#2-180:0.2)}


\begin{document}


% SIN - X - TAN
\def\A{2.0}
\def\k{0.45} % x -> theta
\def\xmax{4.2}
\def\ymax{\A}
\def\N{7}
\def\nsamples{100}
\begin{tikzpicture}

  \draw[->,thick,black] (-1.05*\xmax,0) -- (1.1*\xmax,0) node[below right=-2] {$\theta$ [\si{\degree}]};
  \draw[->,thick,black] (0,-1.1*\A) -- (0,1.15*\A) node[above left=-3] {$y$};
  \draw[mypurple,thick,variable=\t,samples=\nsamples,smooth,domain=-1.1/\k:1.1/\k]
    plot(\t,\A*\k*\t) node[below=2,above right=-1] {$y=\theta$};
  \draw[myred,thick,variable=\t,samples=\nsamples,smooth,domain=-\xmax:\xmax]
    plot(\t,{\A*sin(180/pi*\k*\t)}) node[right=4,below=0] {$y=\sin\theta$};
  \draw[myblue,thick,variable=\t,samples=\nsamples,smooth,domain=-0.85/\k:0.85/\k]
    plot(\t,{\A*tan(180/pi*\k*\t)}) node[left=2] {$y=\tan\theta$};

  \node[right=2,below left=1.4,scale=0.9] at (0,0) {$0$};
  \tick{0,-\A}{0} node[left=-1,scale=0.9] {$-1$};
  \tick{0,\A}{0} node[left=-1,scale=0.9] {$1$};
  \foreach \i [evaluate={\ang=int(\i*105/\N); \t=pi/180/\k*\ang;}] in {1,...,\N}{
    \tick{-\t,0}{90} node[left=2,below=-1,scale=0.85] {$-\ang$};
    \tick{\t,0}{90} node[below=-1,scale=0.85] {$\ang$};
  }

\end{tikzpicture}


% COS - X
\begin{tikzpicture}

  \draw[->,thick,black] (-1.05*\xmax,0) -- (1.1*\xmax,0) node[below right=-2] {$\theta$ [\si{\degree}]};
  \draw[->,thick,black] (0,-0.8*\A) -- (0,1.15*\A) node[above left=-3] {$y$};
  \draw[mypurple,thick,variable=\t,samples=\nsamples,smooth,domain=-0.9*\xmax:0.9*\xmax]
    plot(\t,{\A*(1-(\k*\t)^2/2)}) node[below=4,left=6] {$y=1-\dfrac{\theta^2}{2}$};
  \draw[myred,thick,variable=\t,samples=\nsamples,smooth,domain=-\xmax:\xmax]
    plot(\t,{\A*cos(180/pi*\k*\t)}) node[below right=-2] {$y=\cos\theta$};

  \node[right=2,below left=1.4,scale=0.9] at (0,0) {$0$};
  \tick{0,\A}{0} node[left=-1,scale=0.9] {$1$};
  \foreach \i [evaluate={\ang=int(\i*105/\N); \t=pi/180/\k*\ang;}] in {1,...,\N}{
    \tick{-\t,0}{90} node[left=2,below=-1,scale=0.85] {$-\ang$};
    \tick{\t,0}{90} node[below=-1,scale=0.85] {$\ang$};
  }

\end{tikzpicture}


% SIN - X - TAN relative difference
\def\k{0.145}  % x -> theta
\def\A{42}     % y -> rel. diff.
\def\xmax{3.4}
\def\ymax{2.6}
\def\Nx{5}
\def\Ny{6}
\def\nsamples{10}
\begin{tikzpicture}

  \draw[->,thick,black] (-1.05*\xmax,0) -- (1.1*\xmax,0) node[below right=-2] {$\theta$ [\si{\degree}]};
  \draw[->,thick,black] (0,-\ymax) -- (0,1.1*\ymax) node[above=-1] {$\Delta f / \abs{f} \;\; [\%]$};
  %\draw[myblue,thick,variable=\t,samples=\nsamples,smooth,domain=-\xmax:\xmax]
  %  plot(\t,{\A*reldiff(\k*\t,sin(180/pi*\k*\t))})
  %  node[above left=-7] {$\dfrac{\theta-\sin\theta}{\abs{\theta}}$};
  \draw[myblue,thick,variable=\t,samples=\nsamples,smooth,domain=-\xmax:\xmax]
    plot(\t,{\A*((\k*\t)^3/6-(\k*\t)^5/120)/abs(sin(180/pi*\k*\t))})
    node[left=3,above right=-3] {$\dfrac{\theta-\sin\theta}{\abs{\sin\theta}}$};
  %\draw[myred,thick,variable=\t,samples=\nsamples,smooth]
  %  plot[domain=-\xmax:-0.08*\xmax](\t,{\A*reldiff(\k*\t,tan(180/pi*\k*\t))}) -- (0,0) --
  %  plot[domain=0.08*\xmax:\xmax](\t,{\A*reldiff(\k*\t,tan(180/pi*\k*\t))})
  %  node[left=3,above right=-3] {$\dfrac{\theta-\tan\theta}{\abs{\tan}}$};
  \draw[myred,thick,variable=\t,samples=\nsamples,smooth,domain=-0.9*\xmax:0.9*\xmax]
    plot(\t,{\A*(-(\k*\t)^3/3-2*(\k*\t)^5/15)/abs(tan(180/pi*\k*\t))})
    node[left=3,above right=-3] {$\dfrac{\theta-\tan\theta}{\abs{\tan\theta}}$};

  \draw[dashed]
    (0,\A/100) --++ (pi/180/\k*15,0)
    (-0.13*\xmax,\A/100) --++ (-pi/180/\k*15,0)
    (0,-\A/100) --++ (pi/180/\k*15,0)
    (-0.13*\xmax,-\A/100) --++ (-pi/180/\k*15,0);
  \node[right=1,below left=0,scale=0.9] at (0,0) {$0$};
  \foreach \i [evaluate={\ang=int(\i*25/\Nx); \t=pi/180/\k*\ang;}] in {1,...,\Nx}{
    \tick{-\t,0}{90} node[left=2,below=-1,scale=0.85] {$-\ang$};
    \tick{\t,0}{90} node[below=-1,scale=0.85] {$\ang$};
  }
  \foreach \i [evaluate={\rd=int(6*\i/\Ny); \y=\A*\rd/100;}] in {1,...,\Ny}{
    \tick{0,-\y}{0} node[left=-1,scale=0.85] {$-\rd$};
    \tick{0,\y}{0} node[left=-1,scale=0.85] {$\rd$};
  }

\end{tikzpicture}


% COS - X relative difference
\def\A{800} % y -> rel. diff.
\def\Ny{4}
\def\nsamples{50}
\begin{tikzpicture}

  \draw[->,thick,black] (-1.05*\xmax,0) -- (1.1*\xmax,0) node[below right=-2] {$\theta$ [\si{\degree}]};
  \draw[->,thick,black] (0,-4/3*\ymax) -- (0,1.1*2/3*\ymax) node[above=-1] {$\Delta f / \abs{f} \;\; [\%]$};
  %\draw[myblue,thick,variable=\t,samples=\nsamples,smooth,domain=-\xmax:\xmax]
  %  plot[domain=-\xmax:-0.4*\xmax](\t,{\A*reldiff(1-(\k*\t)^2/2,cos(180/pi*\k*\t))}) -- (0,0) --
  %  plot[domain=0.4*\xmax:\xmax](\t,{\A*reldiff(1-(\k*\t)^2/2,cos(180/pi*\k*\t))})
  %  node[below left=-1] {$\dfrac{\left(1-\frac{\theta^2}{2}\right)-\cos\theta}{\abs{\theta}}$};
  \draw[myblue,thick,variable=\t,samples=\nsamples,smooth,domain=-\xmax:\xmax]
    plot(\t,{\A*(-(\k*\t)^4/24+(\k*\t)^6/720)/cos(180/pi*\k*\t)})
    node[left=11,below=-2] {$\dfrac{\left(1-\frac{\theta^2}{2}\right)-\cos\theta}{\abs{\cos\theta}}$};

  \node[right=1,below left=1,scale=0.9] at (0,0) {$0$};
  \foreach \i [evaluate={\ang=int(\i*25/\Nx); \t=pi/180/\k*\ang;}] in {1,...,\Nx}{
    \tick{-\t,0}{90} node[left=2,below=-1,scale=0.85] {$-\ang$};
    \tick{\t,0}{90} node[below=-1,scale=0.85] {$\ang$};
  }
  \foreach \i [evaluate={\rd=int(\i); \y=\A*\rd/1000;}] in {1,...,\Ny}{
    \ifnumcomp{\i}{<}{3}{
      \tick{0,\y}{0} node[left=-1,scale=0.85] {$0.\rd$};
    }{}
    \tick{0,-\y}{0} node[left=-1,scale=0.85] {$-0.\rd$};
  }

\end{tikzpicture}


\end{document}
Click to download: small_angle_approximation.tex • small_angle_approximation.pdf
Open in Overleaf: small_angle_approximation.tex


