")


Edit and compile if you like:
% Author: Izaak Neutelings (December 2020)
\documentclass[border=3pt,tikz]{standalone}
\usepackage{tikz}
\usetikzlibrary{arrows.meta} % for arrow size
\tikzset{>=latex} % for LaTeX arrow head
\colorlet{xcol}{blue!70!black}
\colorlet{vcol}{green!60!black}
\colorlet{myred}{red!70!black}
\tikzstyle{vvec}=[->,vcol,very thick,line cap=round]
\tikzstyle{myarr}=[-{Latex[length=3,width=2]},myred]
\def\tick#1#2{\draw[thick] (#1) ++ (#2:0.1) --++ (#2-180:0.2)}
\def\xpeak#1{{(0.21+#1)*\xmax}}
\def\wave#1{
\coordinate (F) at (\xpeak{#1},\ypeak);
\draw[very thick,xcol]
(-0.08*\xmax,0) -- ({(0.06+#1)*\xmax},0) to[out=0,in=180,looseness=0.5] (F)
to[out=0,in=180,looseness=0.6]++ (0.25*\xmax,-\ypeak) -- (0.94*\xmax,0);
}
\begin{document}
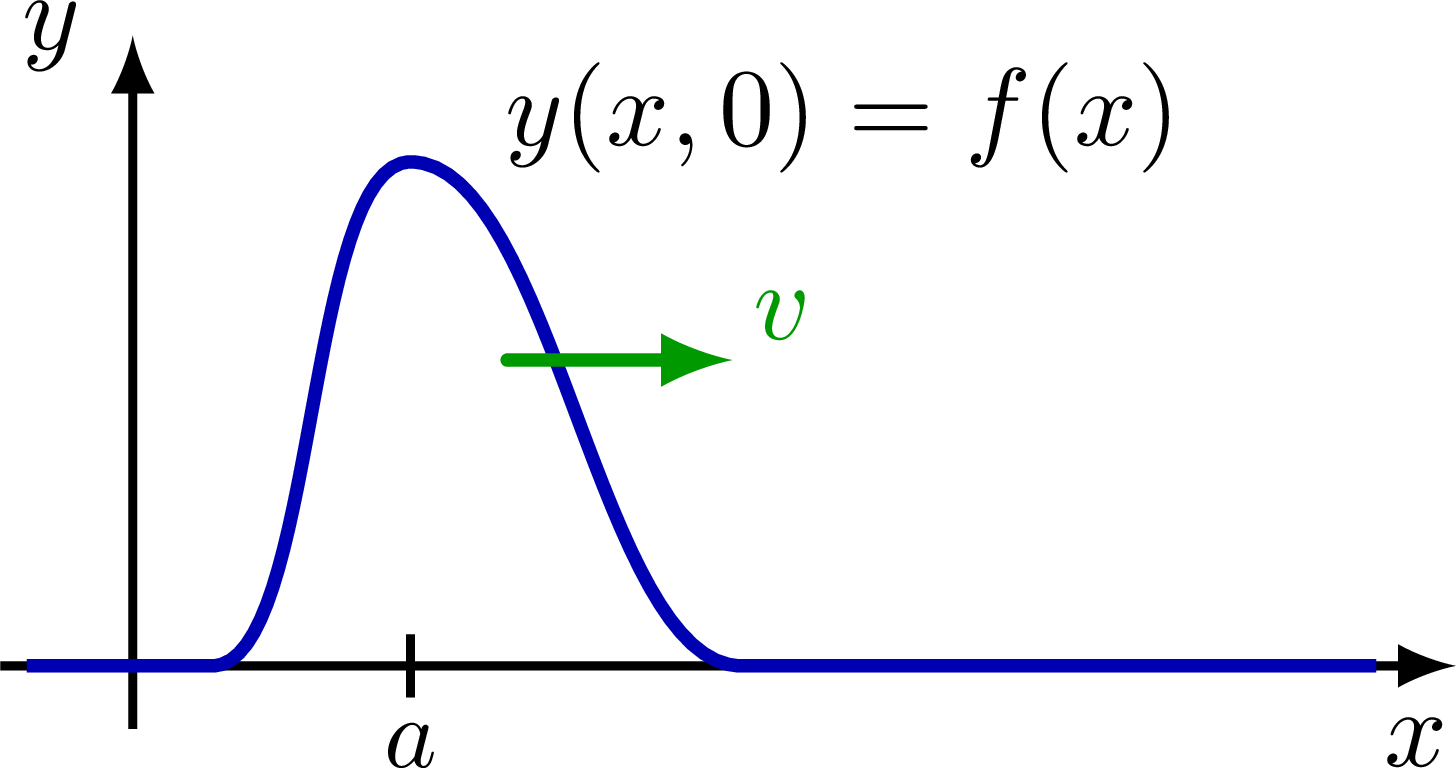
% WAVE t = 0
\def\xmax{4.2}
\def\ymax{2.0}
\def\ypeak{0.80*\ymax}
\def\v{0.17*\xmax}
\begin{tikzpicture}
\draw[->,thick] (-0.1*\xmax,0) -- (\xmax,0) node[right=4,below left=1] {$x$};
\draw[->,thick] (0,-0.1*\ymax) -- (0,\ymax) node[left=1] {$y$};
\wave{0.0}
\node[above=4,right=5] at (F) {$y(x,0)=f(x)$};
%\node[left] at (0.97*\xmax,0.65*\ymax) {$t=0$};
\tick{\xpeak{0.0},0}{90} node[scale=0.9,below=-1] {$a$};
\draw[vvec] (F)++(-64:0.35*\ymax) --++ (\v,0) node[above right=-2] {$v$};
\end{tikzpicture}
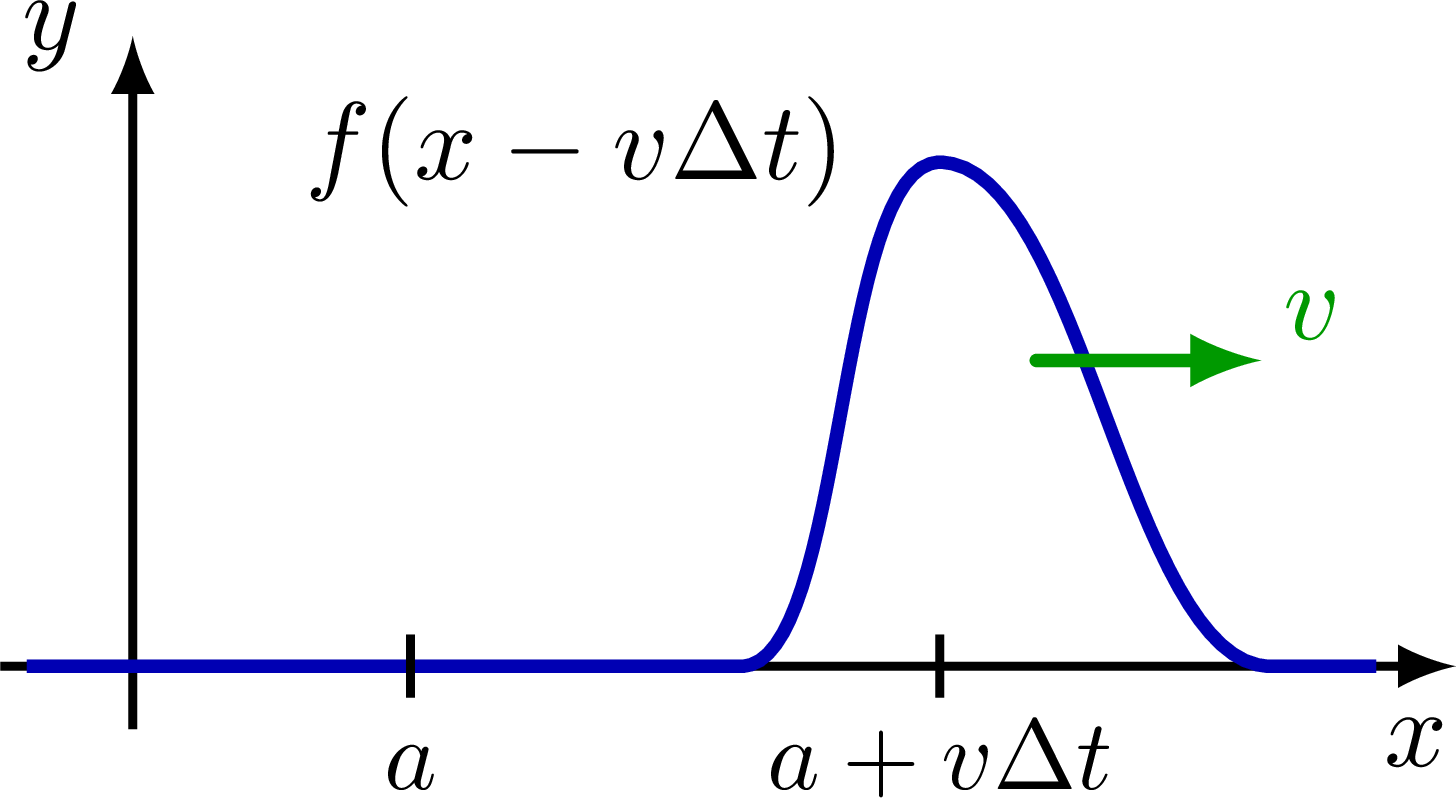
% WAVE t = Delta t
\begin{tikzpicture}
\draw[->,thick] (-0.1*\xmax,0) -- (\xmax,0) node[right=4,below left=1] {$x$};
\draw[->,thick] (0,-0.1*\ymax) -- (0,\ymax) node[left=1] {$y$};
\wave{0.4}
\node[above=1,left=5] at (F) {$f(x-v\Delta t)$};
%\node[left] at (1*\xmax,0.9*\ymax) {$t=\Delta t$};
\tick{\xpeak{0.0},0}{90} node[scale=0.9,below=-3] {\strut$a$};
\tick{\xpeak{0.4},0}{90} node[scale=0.9,below=-3] {\strut$a+v\Delta t$};
\draw[vvec] (F)++(-64:0.35*\ymax) --++ (\v,0) node[above right=-2] {$v$};
\end{tikzpicture}
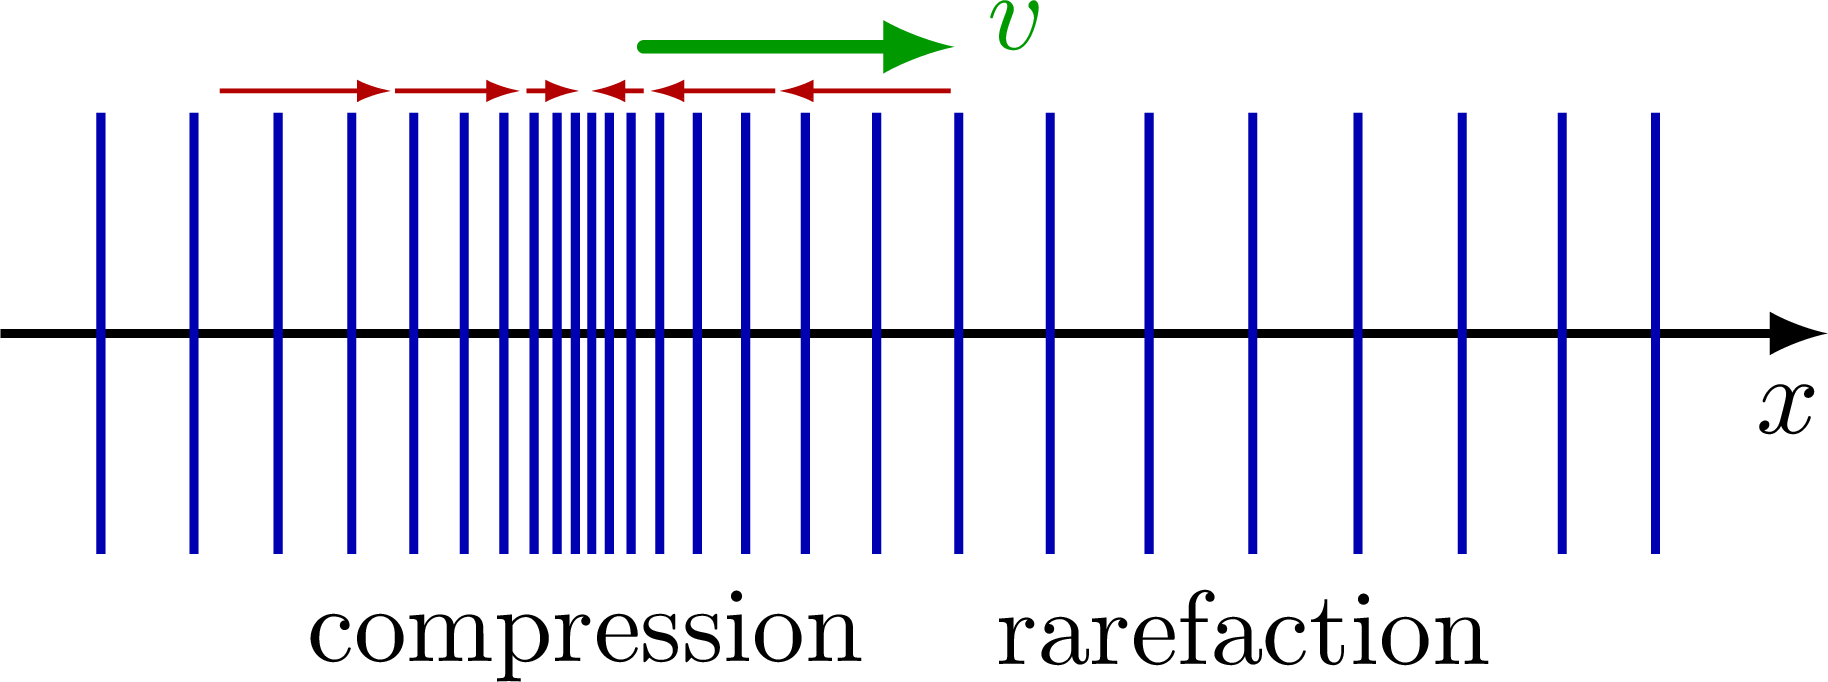
% LONGITUNIDAL WAVE t = 0
\def\N{35} % number of lines
\def\A{0.7} % amplitude
\def\xmax{5.8} % wave length
\def\w{1.2*\xmax/(\N+1)} % interspacing
\def\lamb{0.80*\xmax} % longitudinal wavelength (radians)
\def\om{360/(\lamb)} % longitudinal omega (degrees)
\def\S{2.8*\w} % longitudinal amplitude
\def\ds#1{\S*sin(\om*(#1+\dx))} % displacement
\def\arr#1{\draw[myarr] (#1*\lamb-\dx,1.1*\A) --++ ({\ds{#1*\lamb-\dx}},0);} % arrow
\begin{tikzpicture}
\def\dx{0.08*\xmax} % horizontal offset due to phase
\draw[->,thick] (0,0) -- (\xmax,0) node[right=4,below left=1] {$x$};
\begin{scope}
\clip (0.02*\xmax,-1.1*\A) rectangle (0.94*\xmax,1.1*\A);
%\draw[samples=100,smooth,variable=\x,domain=0:\xmax] plot({\x},{\ds{\x}});
\foreach \i [evaluate={\x=\i*\w-0.1*\xmax;}] in {1,...,\N}{
\draw[xcol,thick] ({\x+\ds{\x}},-\A) --++ (0,2*\A);
}
\end{scope}
\draw[vvec] (0.54*\lamb-\dx,1.3*\A) --++ (\v,0) node[above=2,right=-1] {$v$};
\draw[myarr] (0.46*\lamb-\dx,1.1*\A) --++ ({\ds{0.46*\lamb-\dx}+0.03},0); %\arr{0.46}
\draw[myarr] (0.54*\lamb-\dx,1.1*\A) --++ ({\ds{0.54*\lamb-\dx}-0.03},0); %\arr{0.54}
\arr{0.37} \arr{0.63}
\arr{0.25} \arr{0.75}
\node[below,scale=0.95] at (0.50*\lamb-\dx,-\A) {compression};
\node[below,scale=0.95] at (0.95*\lamb-\dx,-\A) {rarefaction};
%\fill[red] ({0.5*\lamb-\dx},-0.8*\A) circle(0.04); % probe
\end{tikzpicture}
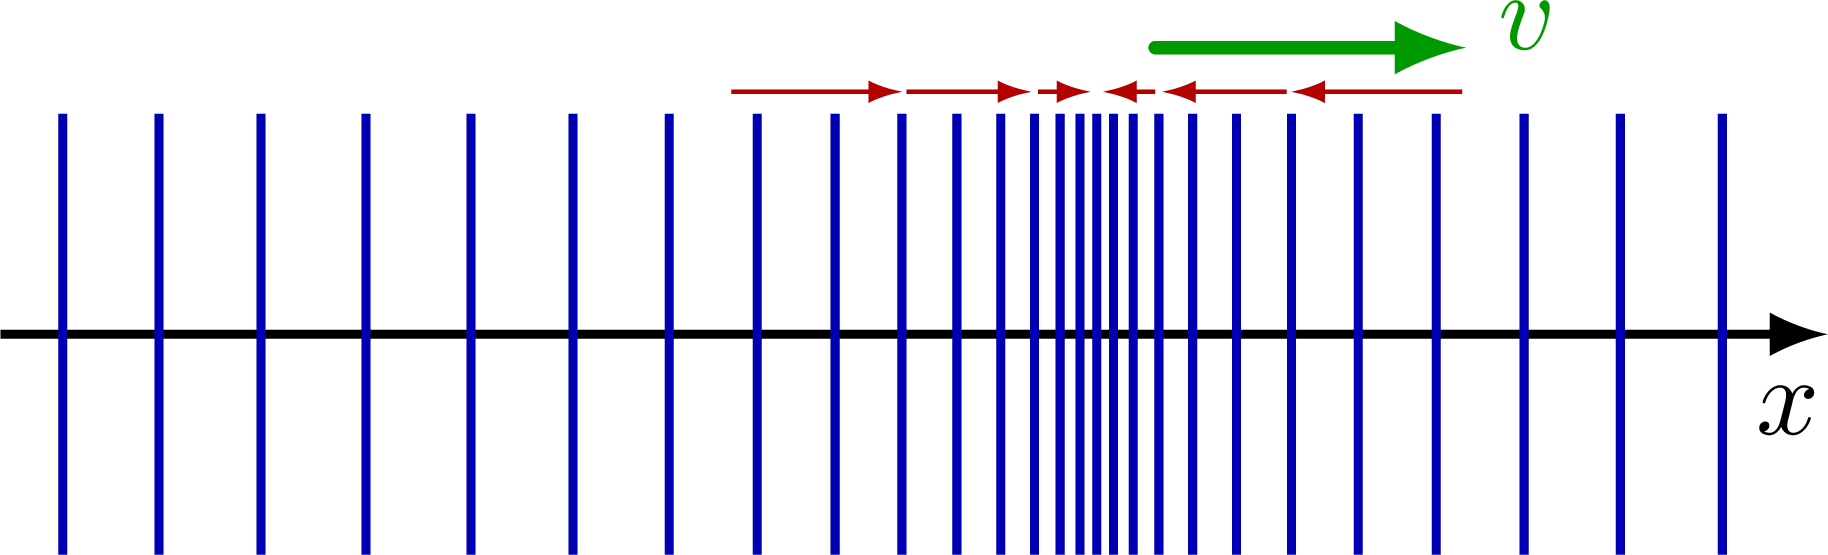
% LONGITUNIDAL WAVE t = Delta t
\begin{tikzpicture}
\def\dx{-0.20*\xmax} % horizontal offset
\draw[->,thick] (0,0) -- (\xmax,0) node[right=4,below left=1] {$x$};
\begin{scope}
\clip (0.02*\xmax,-1.1*\A) rectangle (0.95*\xmax,1.1*\A);
%\draw[samples=100,smooth,variable=\x,domain=0:\xmax] plot(\x,{\ds{\x}});
\foreach \i [evaluate={\x=\i*\w-0.1*\xmax;}] in {1,...,\N}{
\draw[xcol,thick] ({\x+\ds{\x}},-\A) --++ (0,2*\A);
}
\end{scope}
\draw[vvec] (0.54*\lamb-\dx,1.3*\A) --++ (\v,0) node[above=2,right=-1] {$v$};
\draw[myarr] (0.46*\lamb-\dx,1.1*\A) --++ ({\ds{0.46*\lamb-\dx}+0.03},0); %\arr{0.46}
\draw[myarr] (0.54*\lamb-\dx,1.1*\A) --++ ({\ds{0.54*\lamb-\dx}-0.03},0); %\arr{0.54}
\arr{0.37} \arr{0.63}
\arr{0.25} \arr{0.75}
%\fill[red] ({0.5*\lamb-\dx},-0.8*\A) circle(0.04); % probe
\end{tikzpicture}
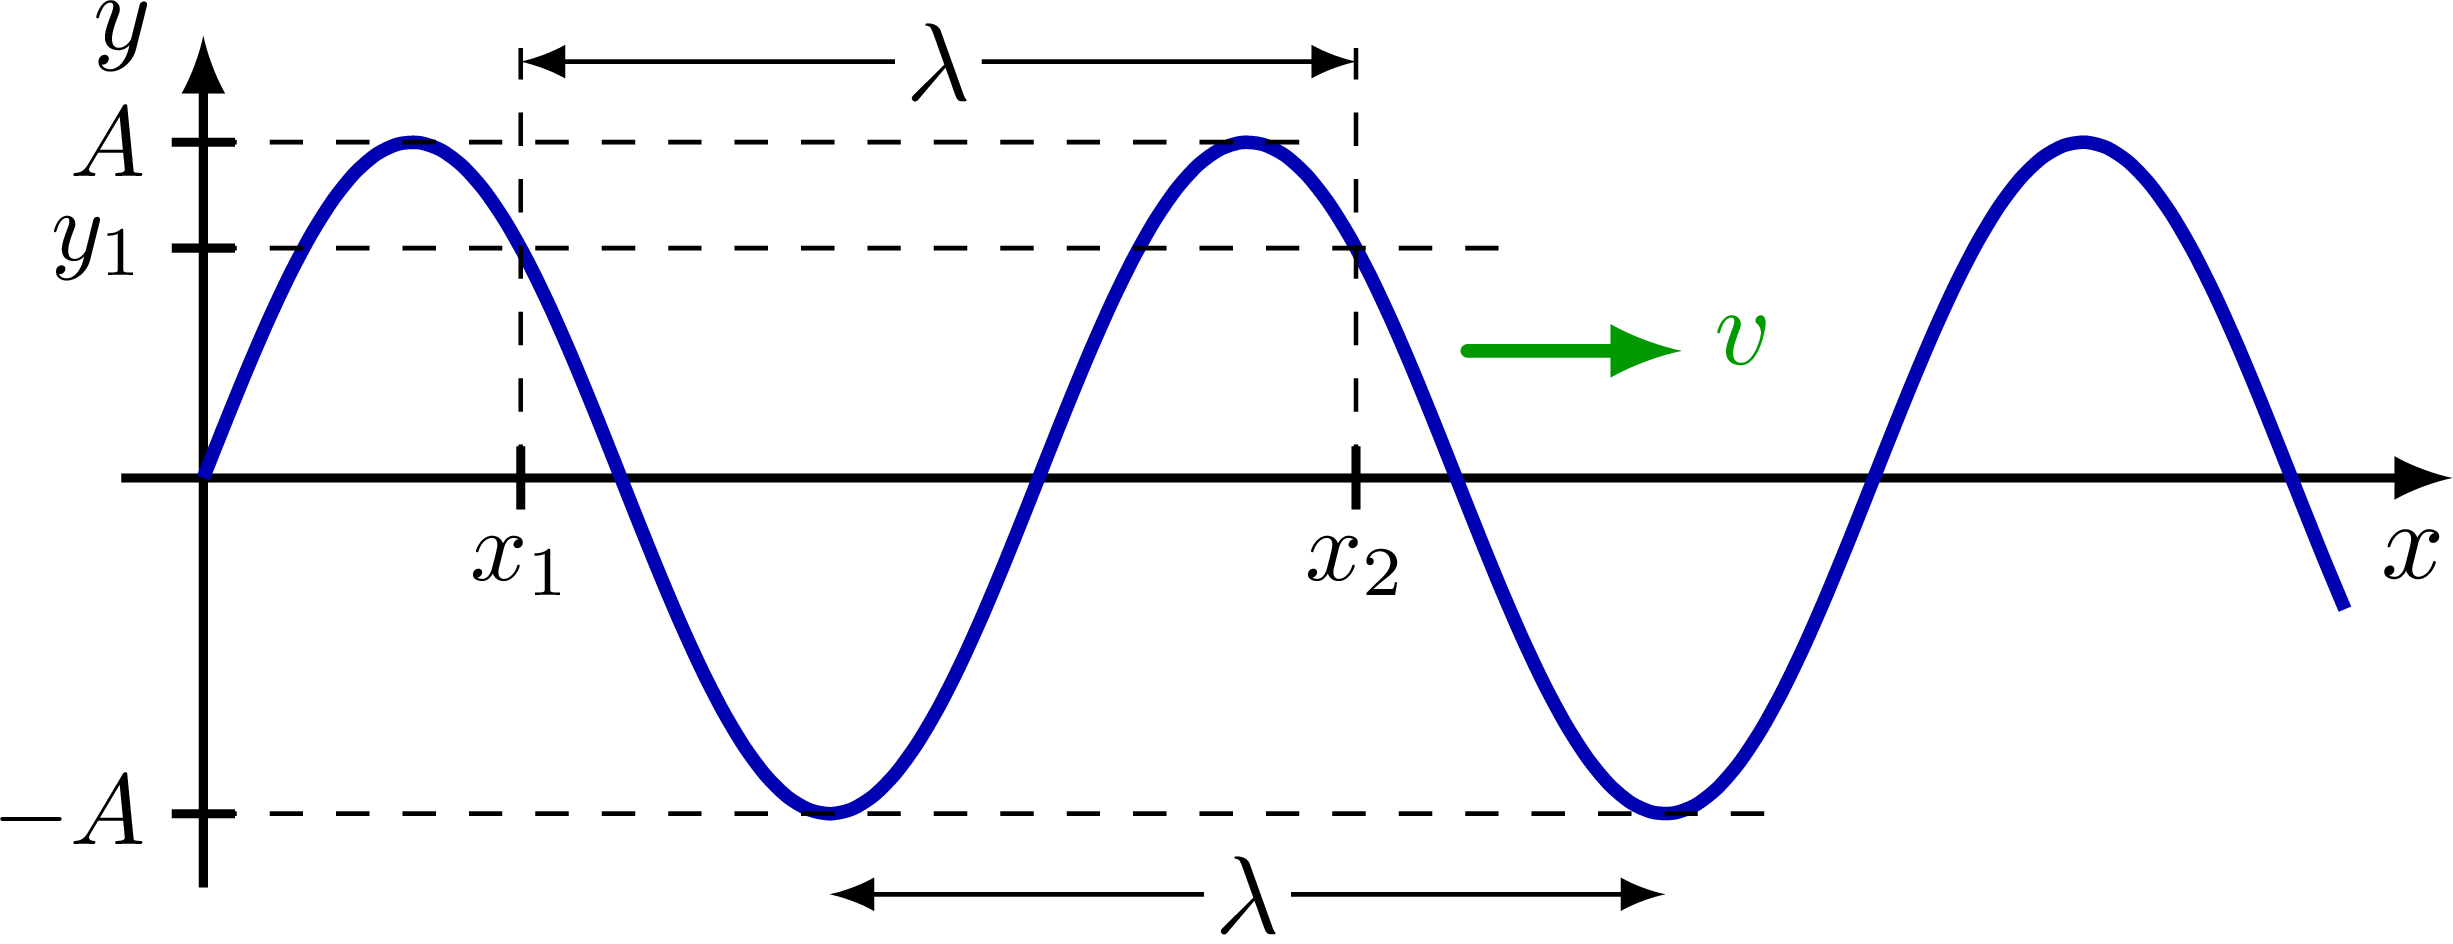
% WAVE t = 0
\def\xmax{6.8}
\def\ymax{1.3}
\def\A{0.82*\ymax}
\def\v{0.10*\xmax}
\def\lamb{0.39*\xmax} % wavelength (radians)
\def\om{360/(\lamb)} % omega (degrees)
\def\xa{0.38*\lamb} % point x_1
\def\xb{1.38*\lamb} % point x_2
\def\ya{\A*sin(\om*\xa)} % point y_1 = y_2
\begin{tikzpicture}
\draw[->,thick] (-0.2*\ymax,0) -- (1.05*\xmax,0) node[right=4,below left=1] {$x$};
\draw[->,thick] (0,-\ymax) -- (0,1.08*\ymax) node[left=1] {$y$};
\draw[xcol,very thick,samples=100,smooth,variable=\x,domain=0:\xmax]
plot(\x,{\A*sin(\om*\x)});
\draw[dashed]
(0,\A) --++ (1.35*\lamb,0)
(0,-\A) --++ (1.87*\lamb,0)
(0,{\ya}) --++ (1.15*\xb,0)
(\xa,0) --++ (0,{1.28*\A})
(\xb,0) --++ (0,{1.28*\A});
\draw[<->] (\xa, 1.24*\A) -- (\xb, 1.24*\A) node[midway,fill=white,inner sep=1] {$\lambda$};
\draw[<->] (0.75*\lamb,-1.24*\A) --++ (\lamb,0) node[midway,fill=white,inner sep=1] {$\lambda$};
\tick{0,\A}{0} node[scale=0.9,left=-1] {$A$};
\tick{0,-\A}{0} node[scale=0.9,left=-1] {$-A$};
\tick{0,{\ya}}{0} node[scale=0.9,left=-1] {$y_1$};
\tick{\xa,0}{90} node[scale=0.9,below=-1] {$x_1$};
\tick{\xb,0}{90} node[scale=0.9,below=-1] {$x_2$};
\draw[vvec] (1.5*\lamb,0)++(85:0.38*\A) --++ (\v,0) node[above=1,right=-1] {$v$};
\end{tikzpicture}
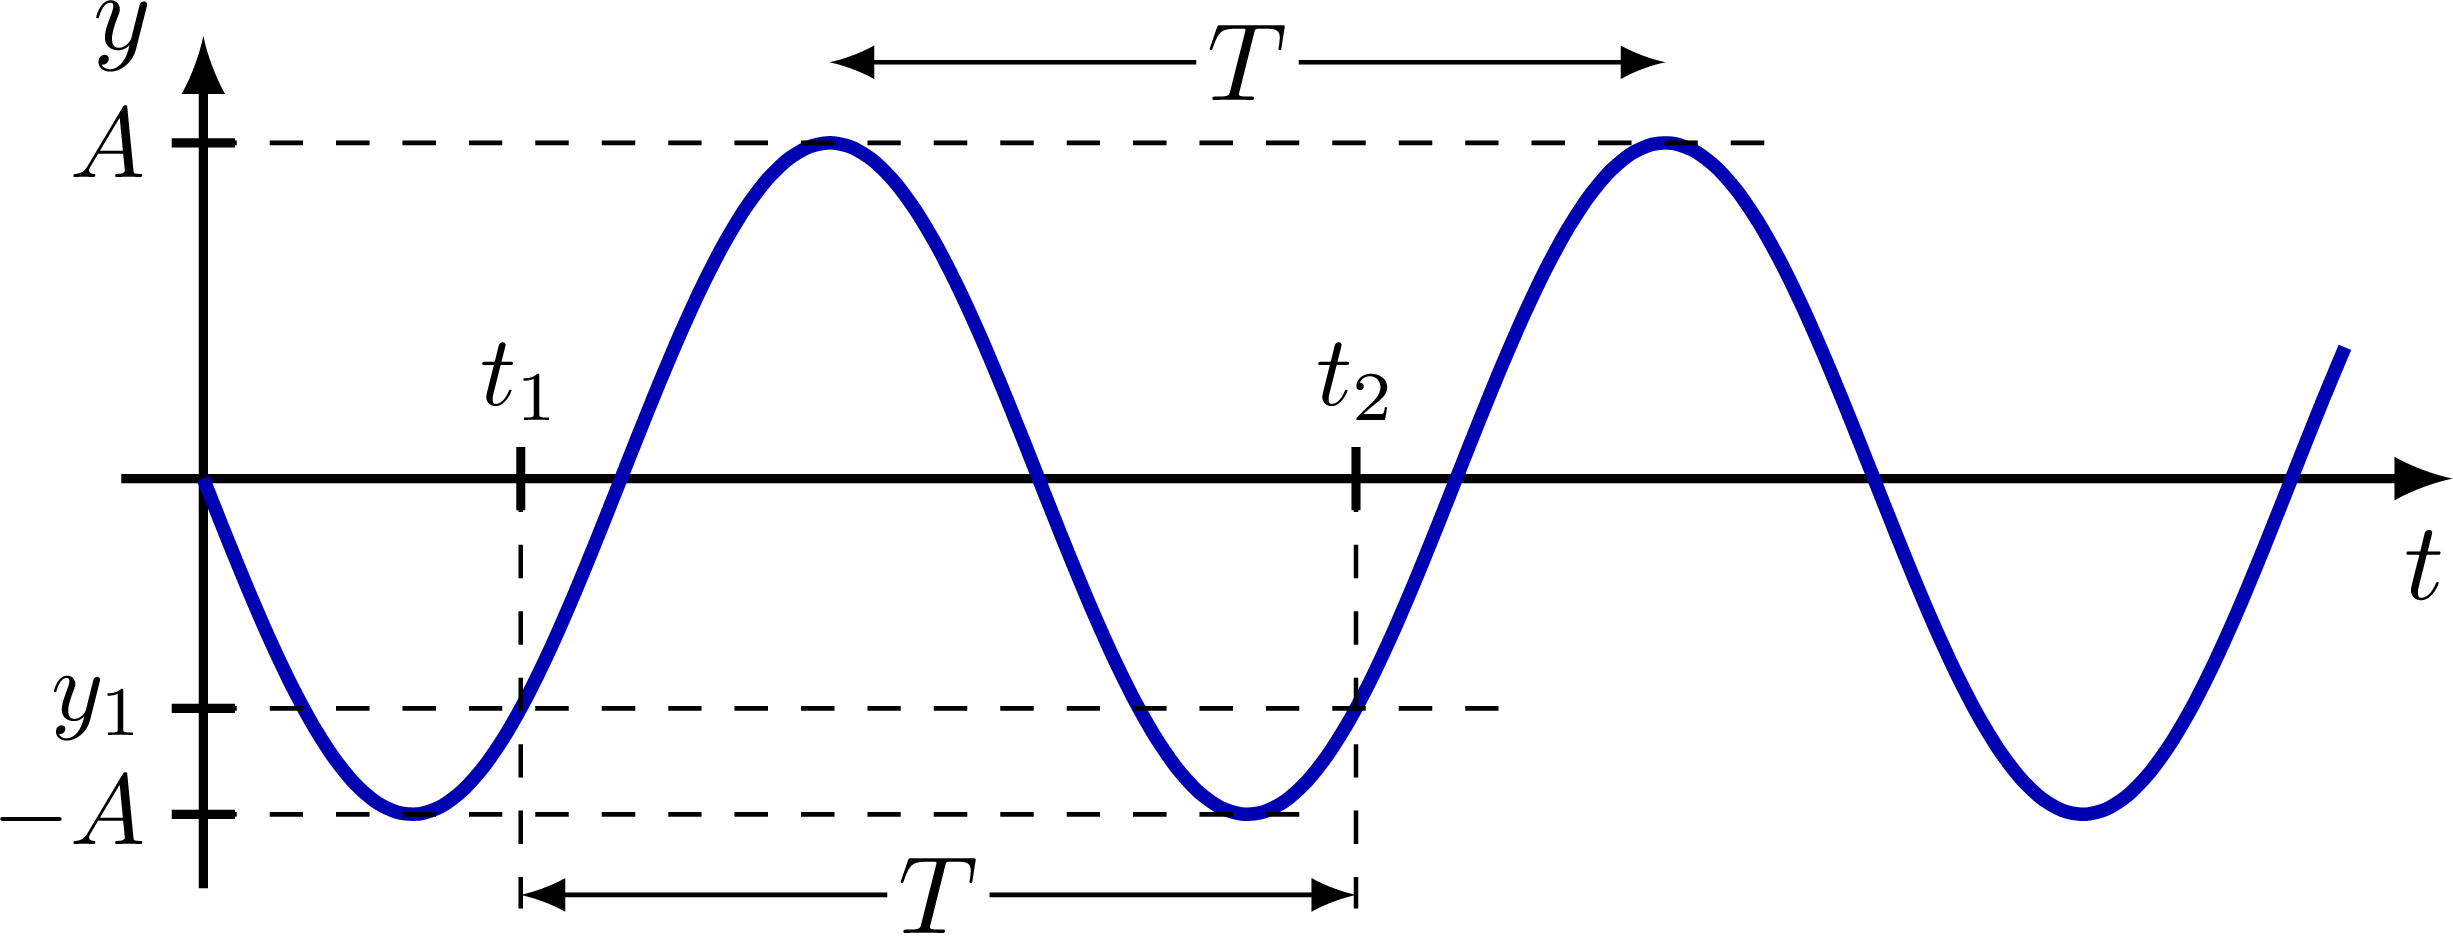
% WAVE x = 0
\begin{tikzpicture}
\draw[->,thick] (-0.2*\ymax,0) -- (1.05*\xmax,0) node[right=4,below left=1] {$t$};
\draw[->,thick] (0,-\ymax) -- (0,1.08*\ymax) node[left=1] {$y$};
\draw[xcol,very thick,samples=100,smooth,variable=\x,domain=0:\xmax]
plot(\x,{-\A*sin(\om*\x)});
\draw[dashed]
(0,\A) --++ (1.87*\lamb,0)
(0,-\A) --++ (1.35*\lamb,0)
(0,{-\ya}) --++ (1.15*\xb,0)
(\xa,0) --++ (0,{-1.28*\A})
(\xb,0) --++ (0,{-1.28*\A});
\draw[<->] (0.75*\lamb,1.24*\A) --++ (\lamb,0) node[midway,fill=white,inner sep=1] {$T$};
\draw[<->] (\xa,-1.24*\A) -- (\xb,-1.24*\A) node[midway,fill=white,inner sep=1] {$T$};
\tick{0,\A}{0} node[scale=0.9,left=-1] {$A$};
\tick{0,-\A}{0} node[scale=0.9,left=-1] {$-A$};
\tick{0,{-\ya}}{0} node[scale=0.9,left=-1] {$y_1$};
\tick{\xa,0}{-90} node[scale=0.9,above=-1] {$t_1$};
\tick{\xb,0}{-90} node[scale=0.9,above=-1] {$t_2$};
%\draw[vvec] (F)++(-64:0.35*\ymax) --++ (\v,0) node[above right=-2] {$v$};
\end{tikzpicture}
\end{document}Click to download: waves.tex • waves.pdf
Open in Overleaf: waves.tex


